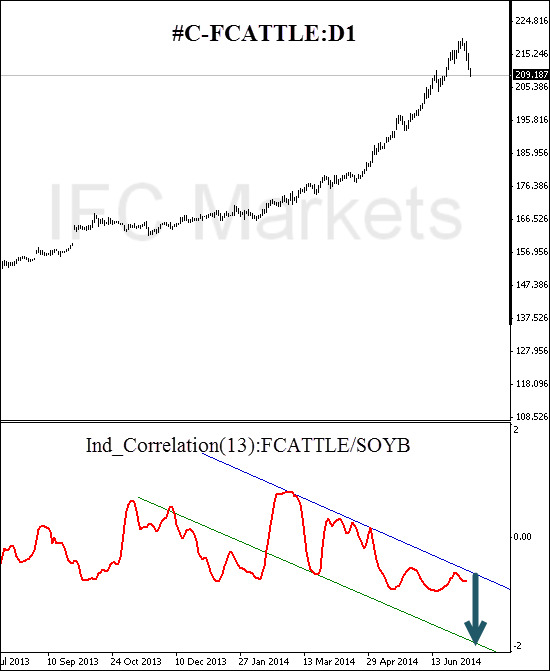
Good afternoon, dear investors. Today we consider the example of unbalanced spread trading, a trading method effectively used within Personal Composite Instruments - PCI Technology. The basis of this method is the expression of the underlying asset in units of the quoted one, provided that both assets have a negative relation: the underlying asset price growth causes the price drop of the quoted asset and vice versa.
Today as such assets we consider the frozen beef and soybean commodity futures: #C-FCATTLE, #C-SOYB. It is quite natural to assume that soy is a cheap filler and a meat product substitute, and under certain conditions we can observe the demand substitution effect. Most apparently this effect appears at the vegetarian lifestyle macro trend expansion, or a drop in personal income. An opposite situation is possible to happen: the meat consumption growth in Asian countries (European influence) eventually leads to a drop in soy demand and increased meat demand, including beef. One of these trends immediately results in #C-FCATTLE and #C-SOYB reverse relation boost.
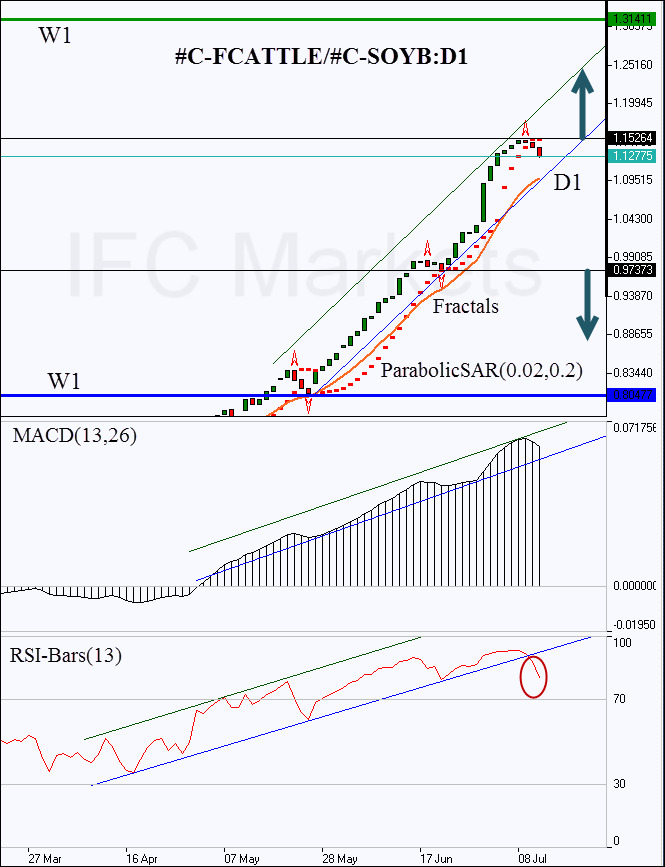
We draw your attention to the fact that since the reverse spread beginning (April 30) #C-FCATTLE futures price has increased by 15% while the PCI price of #C-FCATTLE/#C-SOYB rose by 57%. The reverse spread use multiplied 4 times the yield growth. At the same time we are safe from systematic risks such as falling food demand. We are interested only in the relative movement. The synthetic instrument allows hedging the order, while providing the instrument persistence, i.e. its trend behavior.
Recommended Content
Editors’ Picks
EUR/USD clings to daily gains above 1.0650

EUR/USD gained traction and turned positive on the day above 1.0650. The improvement seen in risk mood following the earlier flight to safety weighs on the US Dollar ahead of the weekend and helps the pair push higher.
GBP/USD recovers toward 1.2450 after UK Retail Sales data

GBP/USD reversed its direction and advanced to the 1.2450 area after touching a fresh multi-month low below 1.2400 in the Asian session. The positive shift seen in risk mood on easing fears over a deepening Iran-Israel conflict supports the pair.
Gold holds steady at around $2,380 following earlier spike

Gold stabilized near $2,380 after spiking above $2,400 with the immediate reaction to reports of Israel striking Iran. Meanwhile, the pullback seen in the US Treasury bond yields helps XAU/USD hold its ground.
Bitcoin Weekly Forecast: BTC post-halving rally could be partially priced in Premium

Bitcoin price shows no signs of directional bias while it holds above $60,000. The fourth BTC halving is partially priced in, according to Deutsche Bank’s research.
Week ahead – US GDP and BoJ decision on top of next week’s agenda

US GDP, core PCE and PMIs the next tests for the Dollar. Investors await BoJ for guidance about next rate hike. EU and UK PMIs, as well as Australian CPIs also on tap.