GBPUSD
Looking at last month’s commentary I recall some of my last phrases ‘Looking at the overall picture, suggest leaving the bullet point above as it is - slightly bearish with the possibility of moving to neutral. A one month rally doesn’t turn a market and three out of four MAs still point lower!’. Well the market was certainly bearish after the then previous Thursday’s Key Reversal Down which followed on until the 18th of Mar! Then of course, the 18th of Mar happened & we had a massive KR Up! However, please note that despite this huge move the market has drifted back down again. This has led to NO KR Up or even a Bullish Engulfing pattern on the Weekly Charts and actually led to a Bearish Engulfing Pattern on the Monthly Chart! In the last few days the second part of my suggestion seems to have come true – so far! The possibility of moving into neutral as this past week, even though it is a quiet Easter Week, has seen numerous Indecisive Doji Crosses… just waiting for the Non-Farm numbers to emerge from the U.S. This indecision may be false as we are very close to the lows and I have changed at least for the moment the bullet point above to full bearish for the very simple reason that all MAs are now pointing down. Nevertheless, caution is still advised as there are Indecisive Candles on this chart! Best support is still 1.4687 & 1.4633 – 1.4643 nearby. Beyond that 1.4502, 1.4344 & 1.4231. Topside 1.4984, dynamic at 1.5043 & the key 50% Fib at 1.5092. This last one is very, very important. Two consecutive closes over this & preferably over the next MA (currently 1.5115) as well and the picture would have changed – radically! So on any rally, that’s the level to watch…at the moment!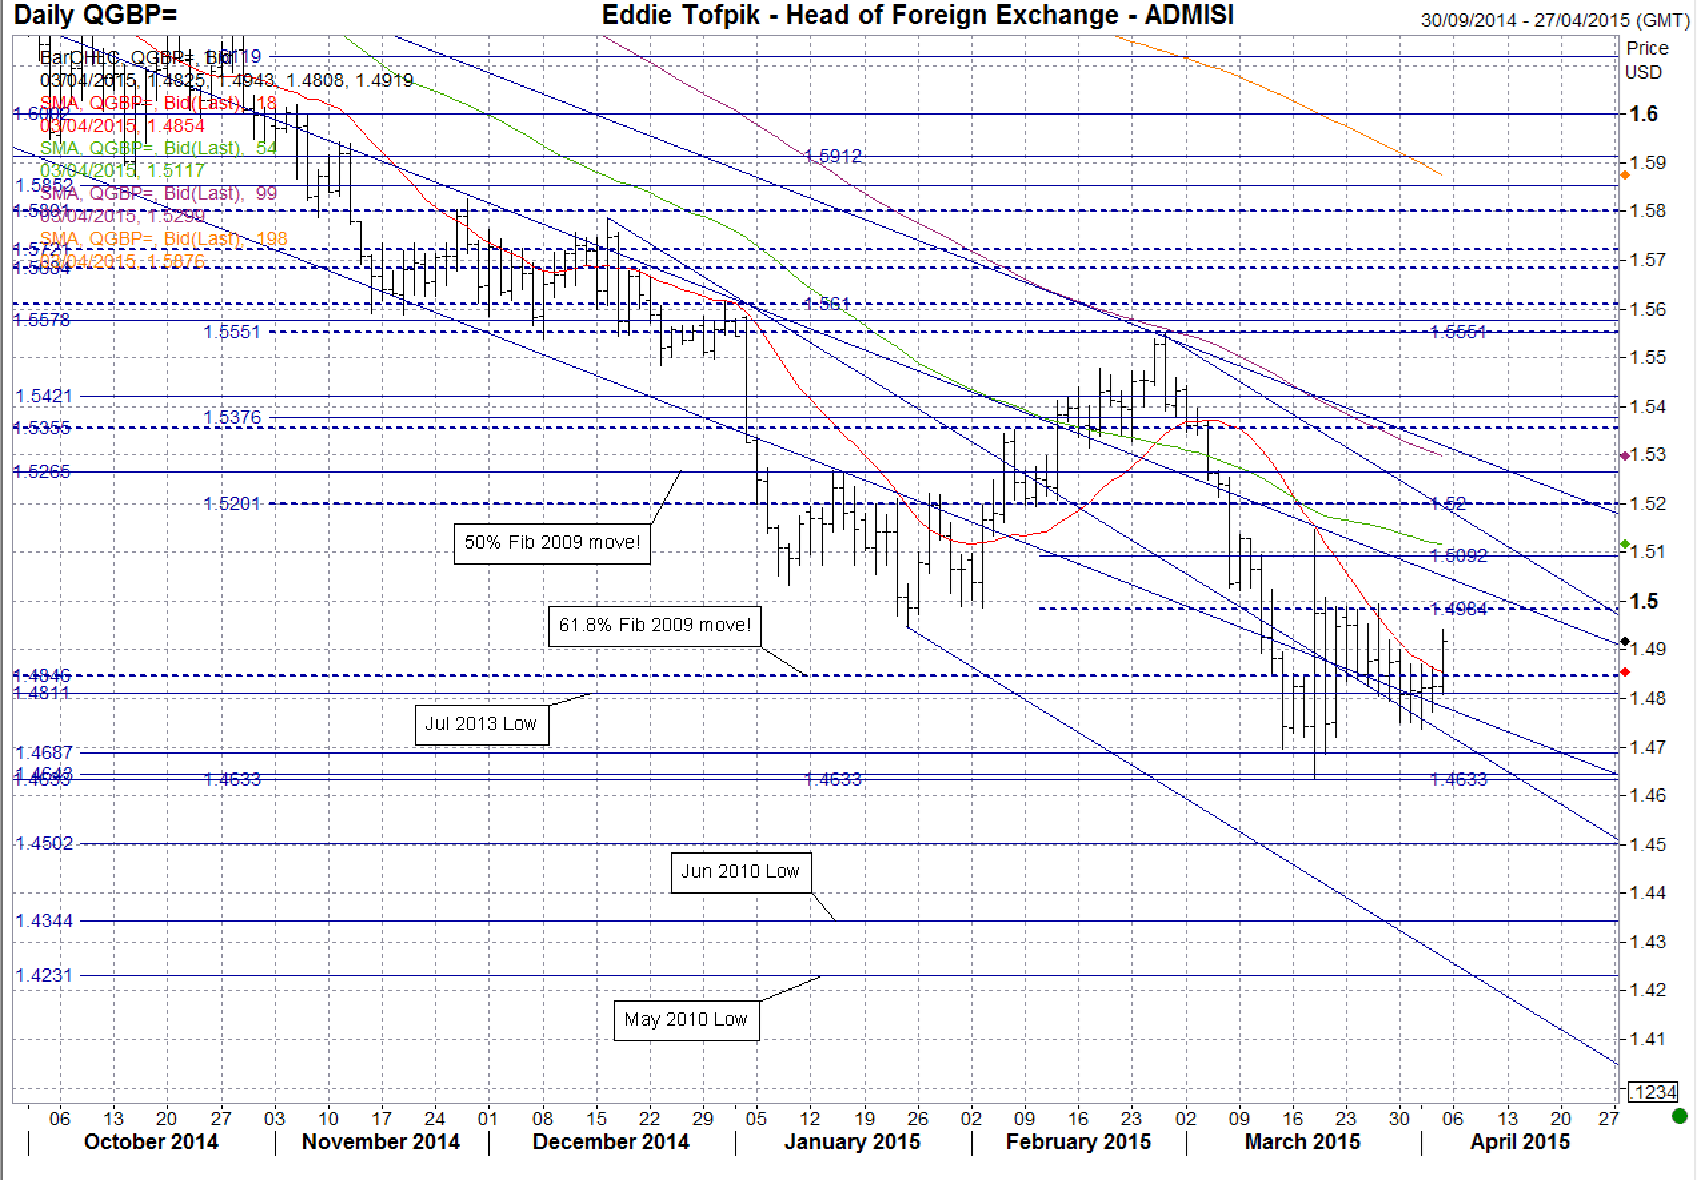
EURGBP
I had the bullet point above as fully bearish last month & that is exactly what we got! We dropped down and for reasons that I cannot quite work out still (apart from roundophobia aka fear of round numbers…) the market stopped just ahead of 0.7000 & reversed back up! So far we have had a pretty nice V bottom but then we’ve only started to hit major resistance from over 0.7300 & even then the real stuff only starts between 0.7388 – 0.7413. This area has been tested but the market had a possible Tweezer Top and rejected it only to then reject the support at 0.7241 with a similar pattern that could also be a Bullish Harami. We are again approaching the 0.7388 resistance again but I am not sure what it will be – Bullish Hammer or Double Top… or neither. Nevertheless, the question mark on the bearish bullet point is appropriate and until we have consecutive closes outside 0.7413 or 0.7241 it may still just bounce back & forwards. In that case the bullet point next month will move again! In the meantime, support at 0.7316 (dynamic), 0.7241, 0.7171, 0.7134 & 0.7087. Resistance beyond 0.7413at 0.7443, 0.7455, 0.7531 – 0.7538 & 0.7580 (dynamic).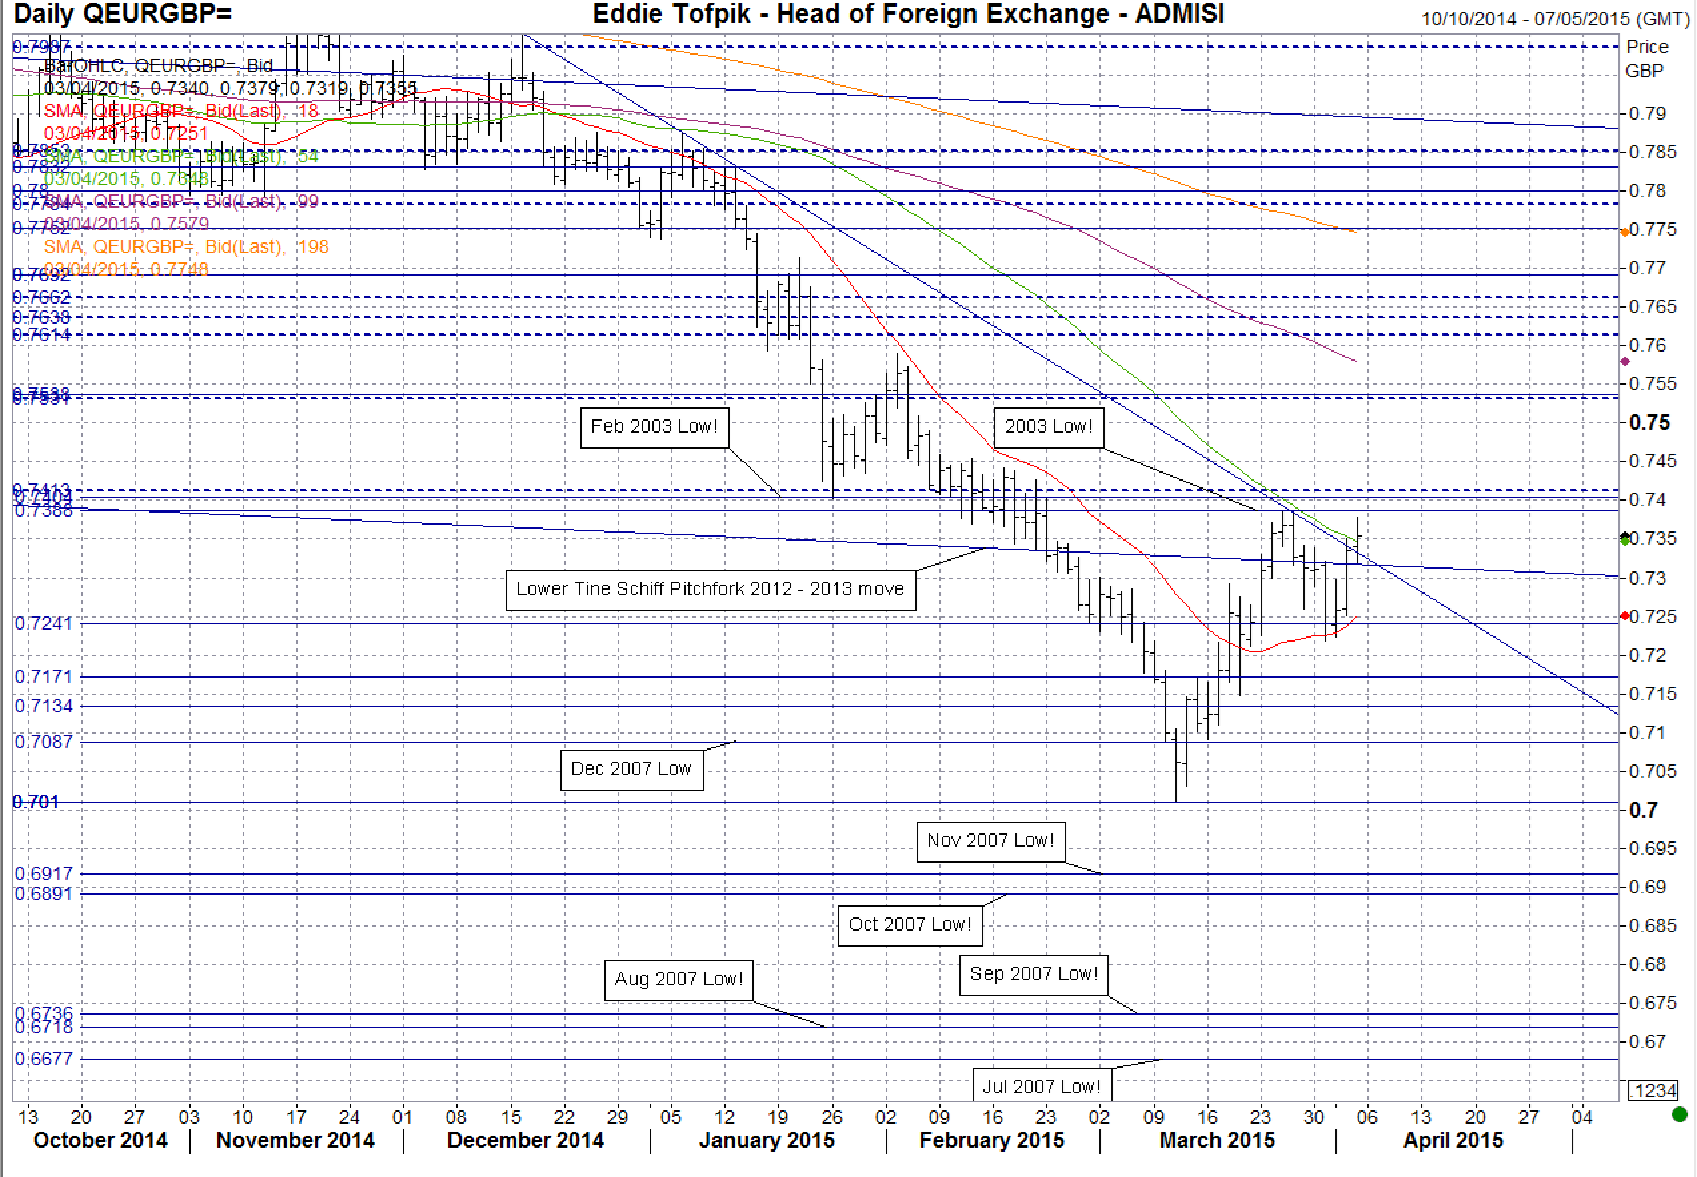
EURUSD
So, from full bearish I move the bullet point above this month down a notch with a question mark purely because of the uptick in the Short MA. In Mar we punched down through the previous 1.1099 support and then taking out lows from Sep, Apr & Mar 2003 but at the Mar 2003 level and even the Apr 2003 level the market failed to have two consecutive closes below. Since then we have retraced but I draw your attention to the resistance at 1.0994, so far we have NOT had two consecutive closes over this despite three separate tests, most recently this last Friday on NFP! All this has created a possible Pipe Bottom on the Weekly Chart but it is likely weak so far as there is no reflection of a bullish pattern on the Monthly Chart! During Mar I posed myself the question ‘Is this a Halfway Hesitation?’ on the Daily Chart above. I added the second question last Friday of ‘Is this an Ascending Triangle?’. The jury is still out on the first and I am still watching the second as we seem to be hitting significant resistance between the key recent 50% Fib at 1.0994 and earlier highs in Mar around 1.1029 – 1.1051! Added to that the next upside MA resistance (currently 1.1113) is rapidly descending and may act as well! All-in-all, I don’t feel able yet to answer either of those questions but would keep a close eye on the possible patterns. Currently support is at 1.0867, 1.0757 1.0712 & then 1.0556. Resistance is at 1.1121, 1.1191 – 1.1210 & then 1.1383. The 1.0994 is a support/resistance number but I think it will best act on a closing basis. Two closes over & we may start a new phase in the action!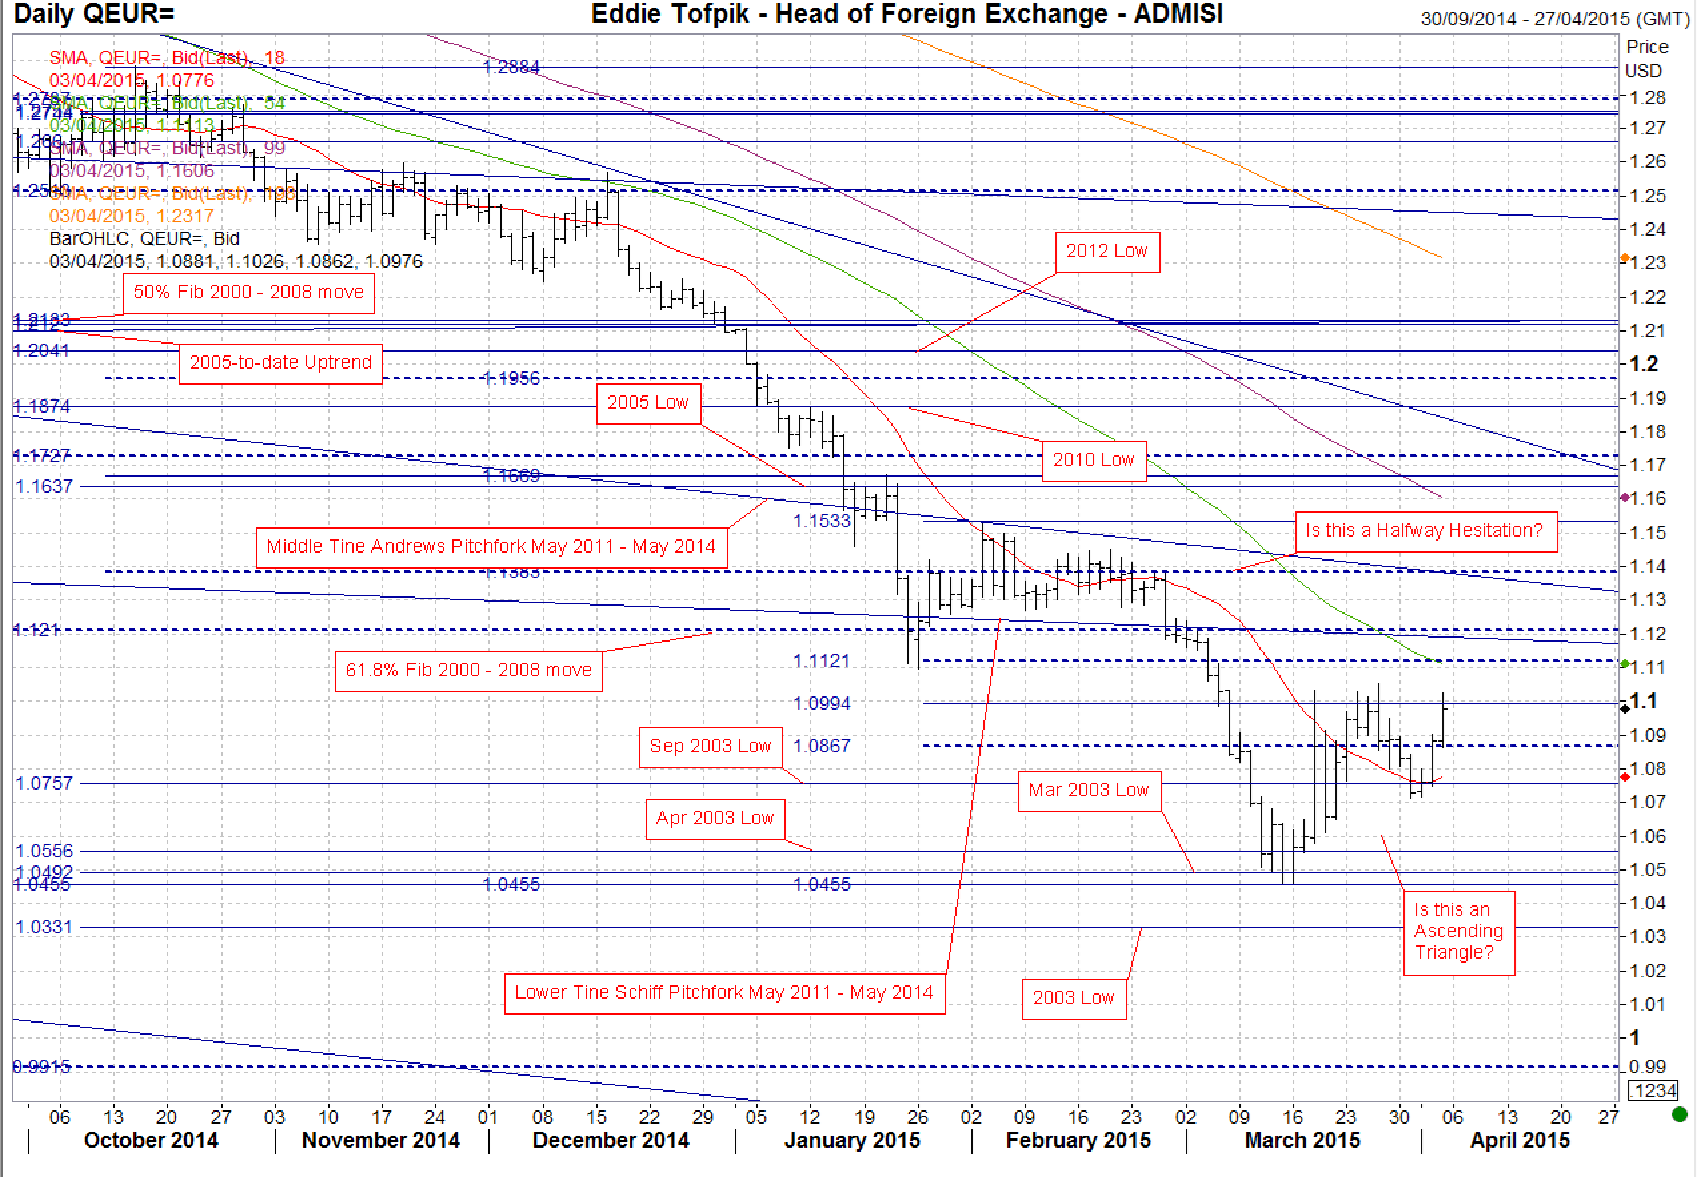
USDJPY
Last month I placed a question mark against the bullet point above as the rally was still there ‘…but it has relegated to the background…’. This month has proved just that because on the Monthly Chart we have an Indecisive Spinning Top Pattern which just about sums up the whole action – nice rally at the start which has possibly set the ground work for a Double Top formation later on and then a decline post mid-month! Yet despite all this we have still three out of four MA’s pointing upwards though in varying degrees of ‘upwardness’ – hence the bullet point stays the same! Looking at the action, it seems we have two areas, one a support and one a resistance which have bracketed the market. Support is from the Dec 2014 50% Fib at 118.79 – two consecutive closes underneath and we definitely have to reassess the situation into possibly neutral. Resistance is the Dec 2014 and also recent high area 121.84 – 122.02 with a similar caveat but with two consecutive closes over – that ought to affirm any rally! Perhaps that is what we are heading for altogether – a sideways Channel – but we need more action to confirm. In the meantime support is obviously at 118.79 then, 118.30, 118.03 – 117.92, 116.99, 116.65 & 115.93. Resistance is at 119.11 (dynamic) 119.56, 119.86, 120.33, 120.75, 121.20, 121.67 & then 121.84 – 122.02! Bullet point stays the same for this month!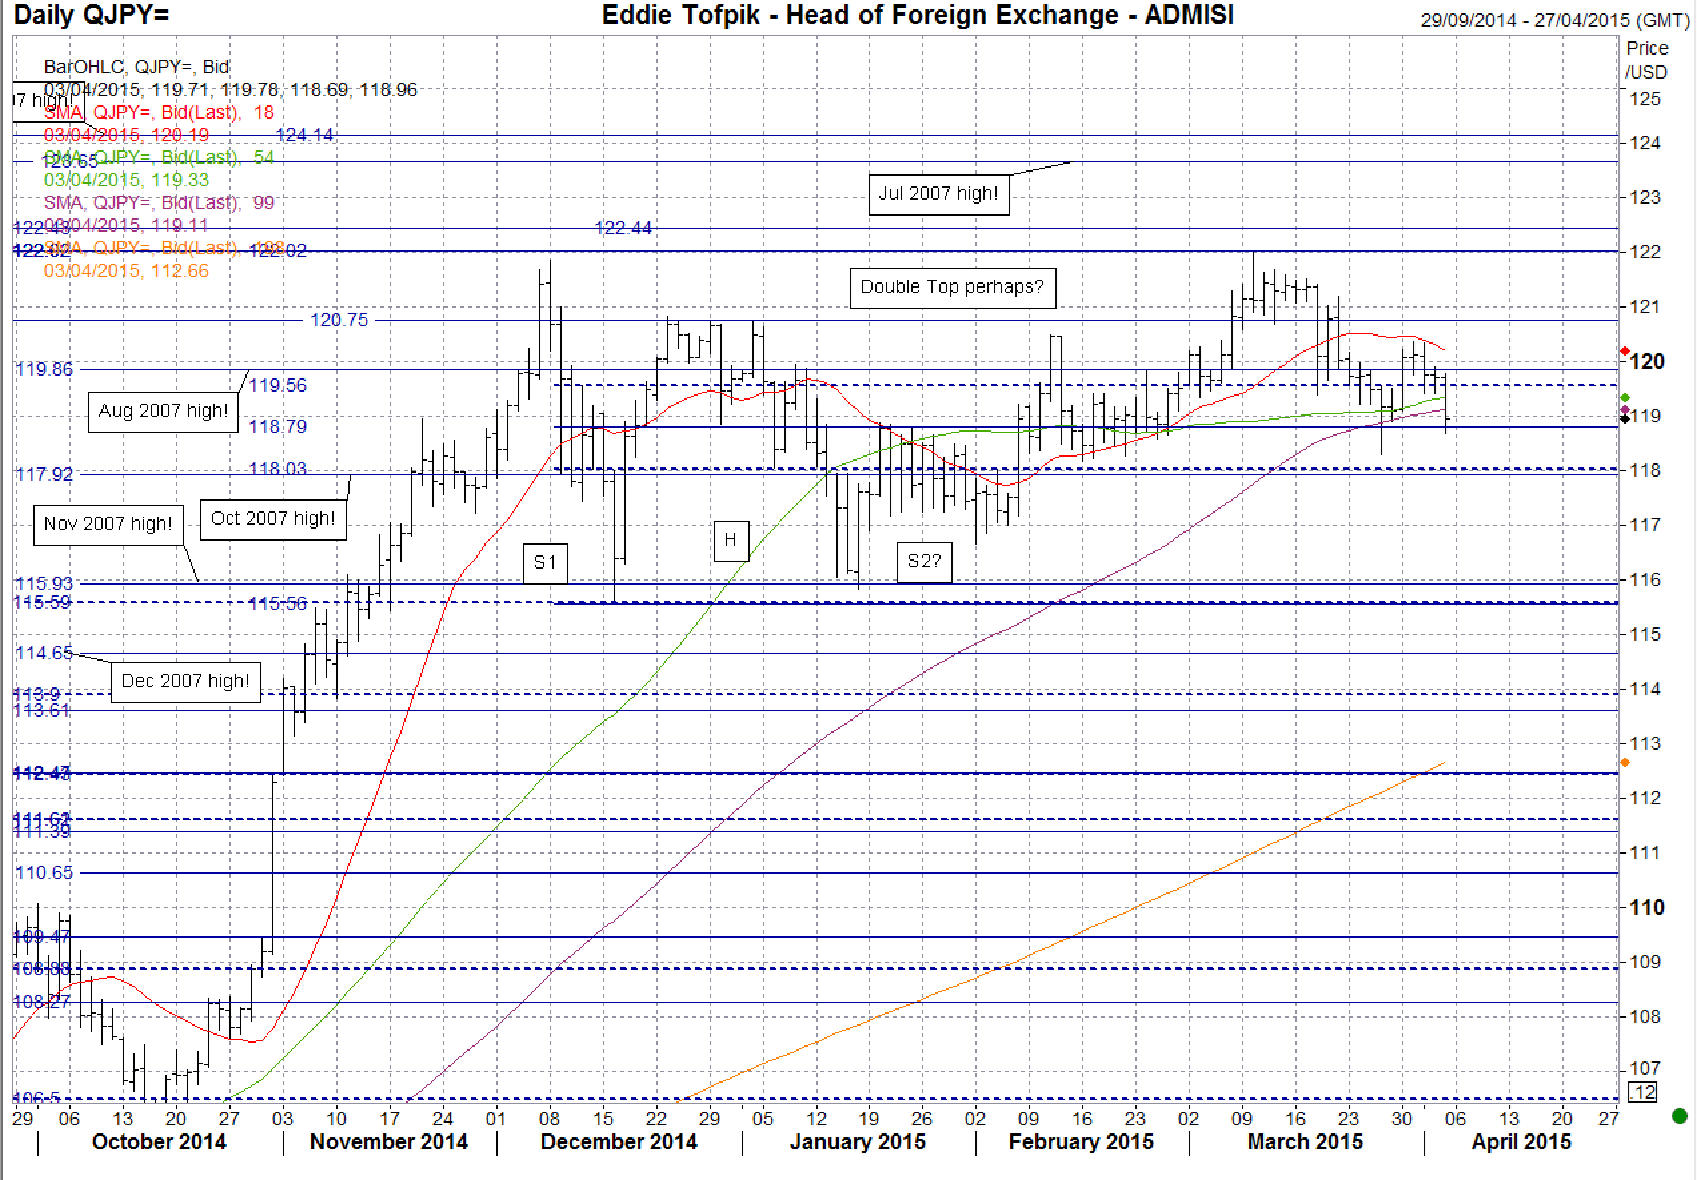
AUDUSD
Last month I wrote about the potential for a Bearish Halfway Hesitation and the threat of a Double Bottom. As a consequence I had a question mark on the bullet point above. This time I have taken it off and unfortunately can’t show it well on the Daily Chart above but there was a Bearish Shooting Star Pattern on the Weekly Chart during the week of the 23rd while on the Monthly Chart we had to put it simply – a Key Reversal Down! These plus all the downward pointing MAs have pushed the bullet point into a more bearish outlook. However, on the Daily Chart above we can also note some things – the recent action has left us with a key 50% Fib at 0.7734! Any consecutive closes over that and it would be time to reassess. Therefore support is at 0.7588, 0.7558 & 0.7531 near term. Beyond that it is at 0.7449, 0.735 & 0.7104 (dynamic). Resistance is at 0.7686, 0.77, 0.7734(key), 0.7782, 0.7823, 0.7913 & 0.7938.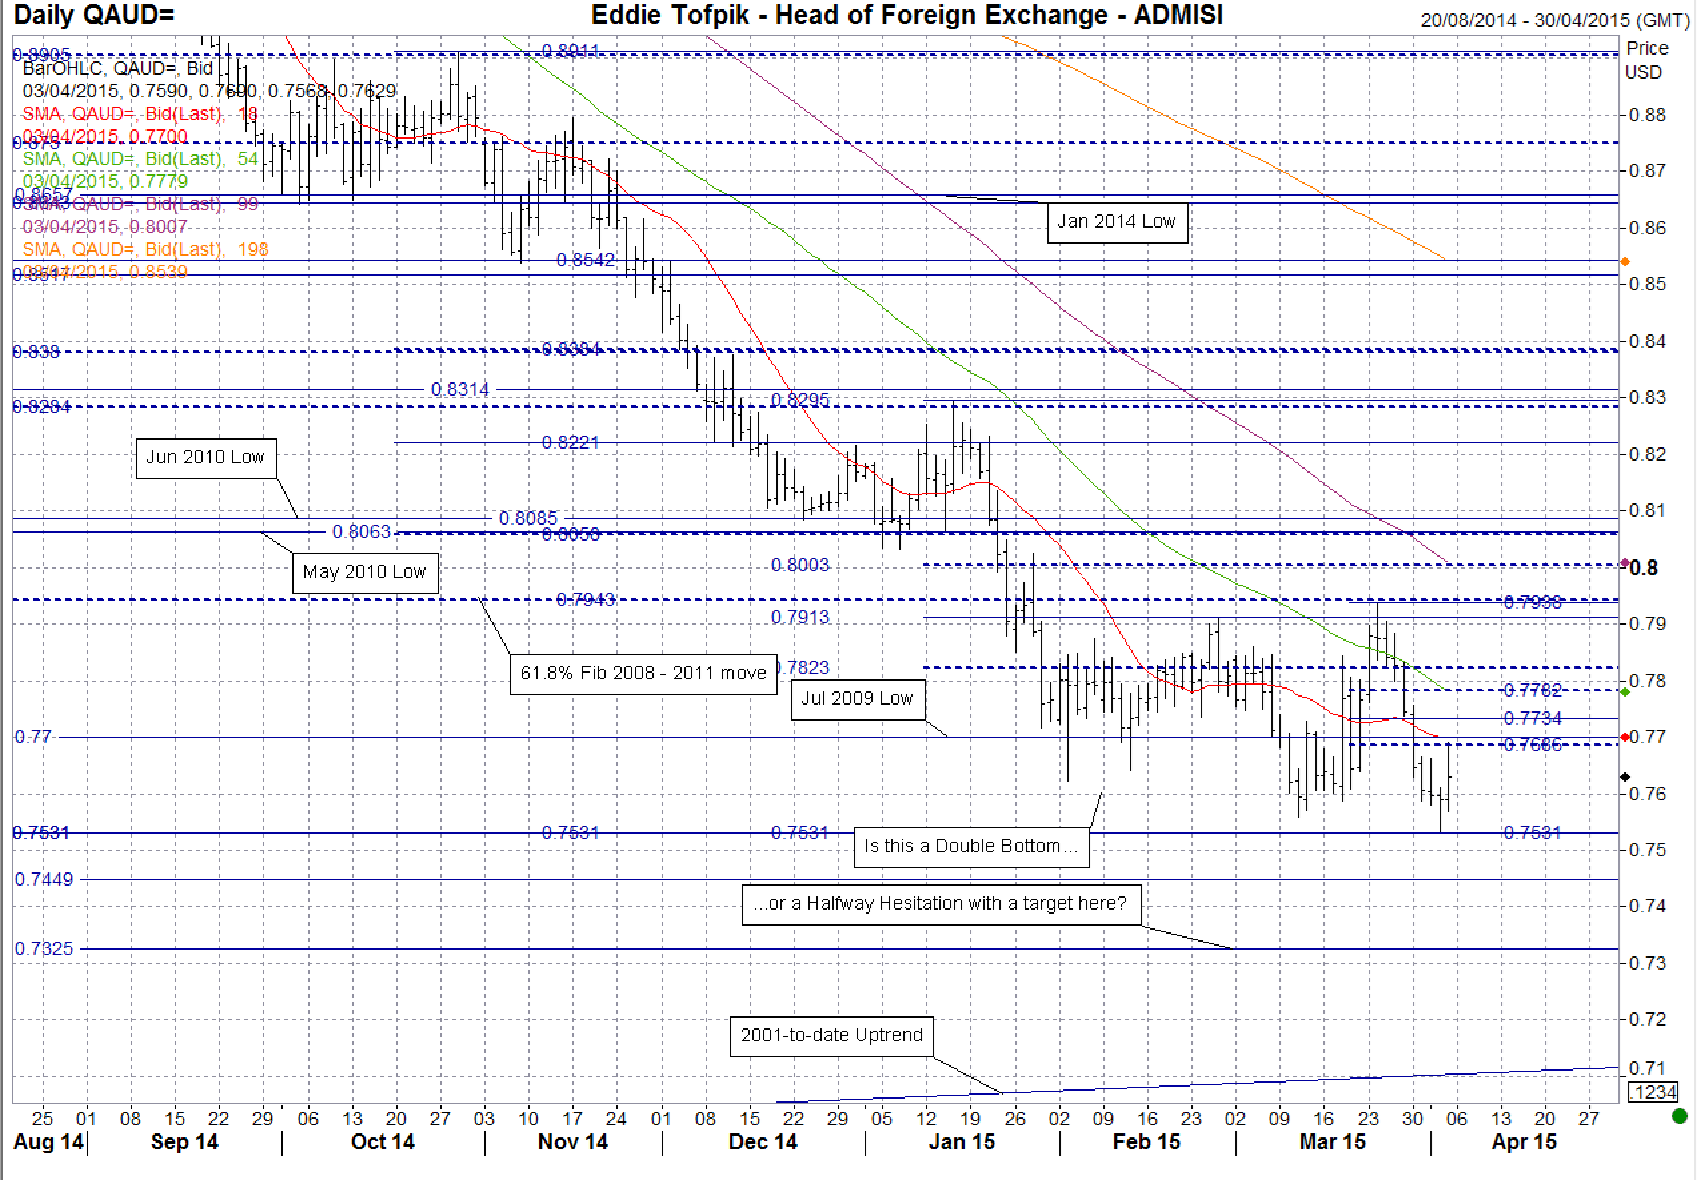
USDZAR
Last month I wrote about 11.8580, the 2008 high and how it was a crucial level on any move higher. Well lo & behold we tested it again, initially very tentatively but then punched through to the upside on NFP Friday the 6th of Mar and had the consecutive close the following Monday. We really only started to slow as we neared the 2002 high at 12.5996. Prices then tipped over just before mid-month, bounced (Dead Cat?) up off the now wide band of support 11.8035/11.7387 down to 11.3629 & have most recently fallen again to test the support. This has allowed me to draw my first bearish Andrews & Schiff Pitchforks on recent action for quite a while (crossover dates of interest nearby 10th Apr & 14th of Apr) and has also on longer term charts provided the following, on the Weekly Chart. We had on consecutive weeks until recently a Bearish Engulfing Pattern followed by an indecisive Doji Cross followed by almost a Key Reversal Down! On the Monthly Chart we have a clear Bearish Shooting Star Pattern! All-in-all, it does look as if we may have had enough of any rise in this pair and we are possibly looking to test support – though that support may be quite good & wide! Support is currently at 11.7489, 11.7387, 11.6730, 11.6242 (key combination including the Medium MA), 11.5303 (dynamic), 11.4721 & finally a band 11.3629 – 11.3581 ahead of the Long MA (currently 11.2511). Resistance 11.8035, 11.8245 (dynamic) 11.8580 – 11.8886, 11.9411 – 11.9453, 12.0386 – 12.0452, 12.0787 & 12.1178 – 12.1367 (this last one is a key 50% Fib on the recent action). With this in mind I have changed the bullet point above into a more neutral stance!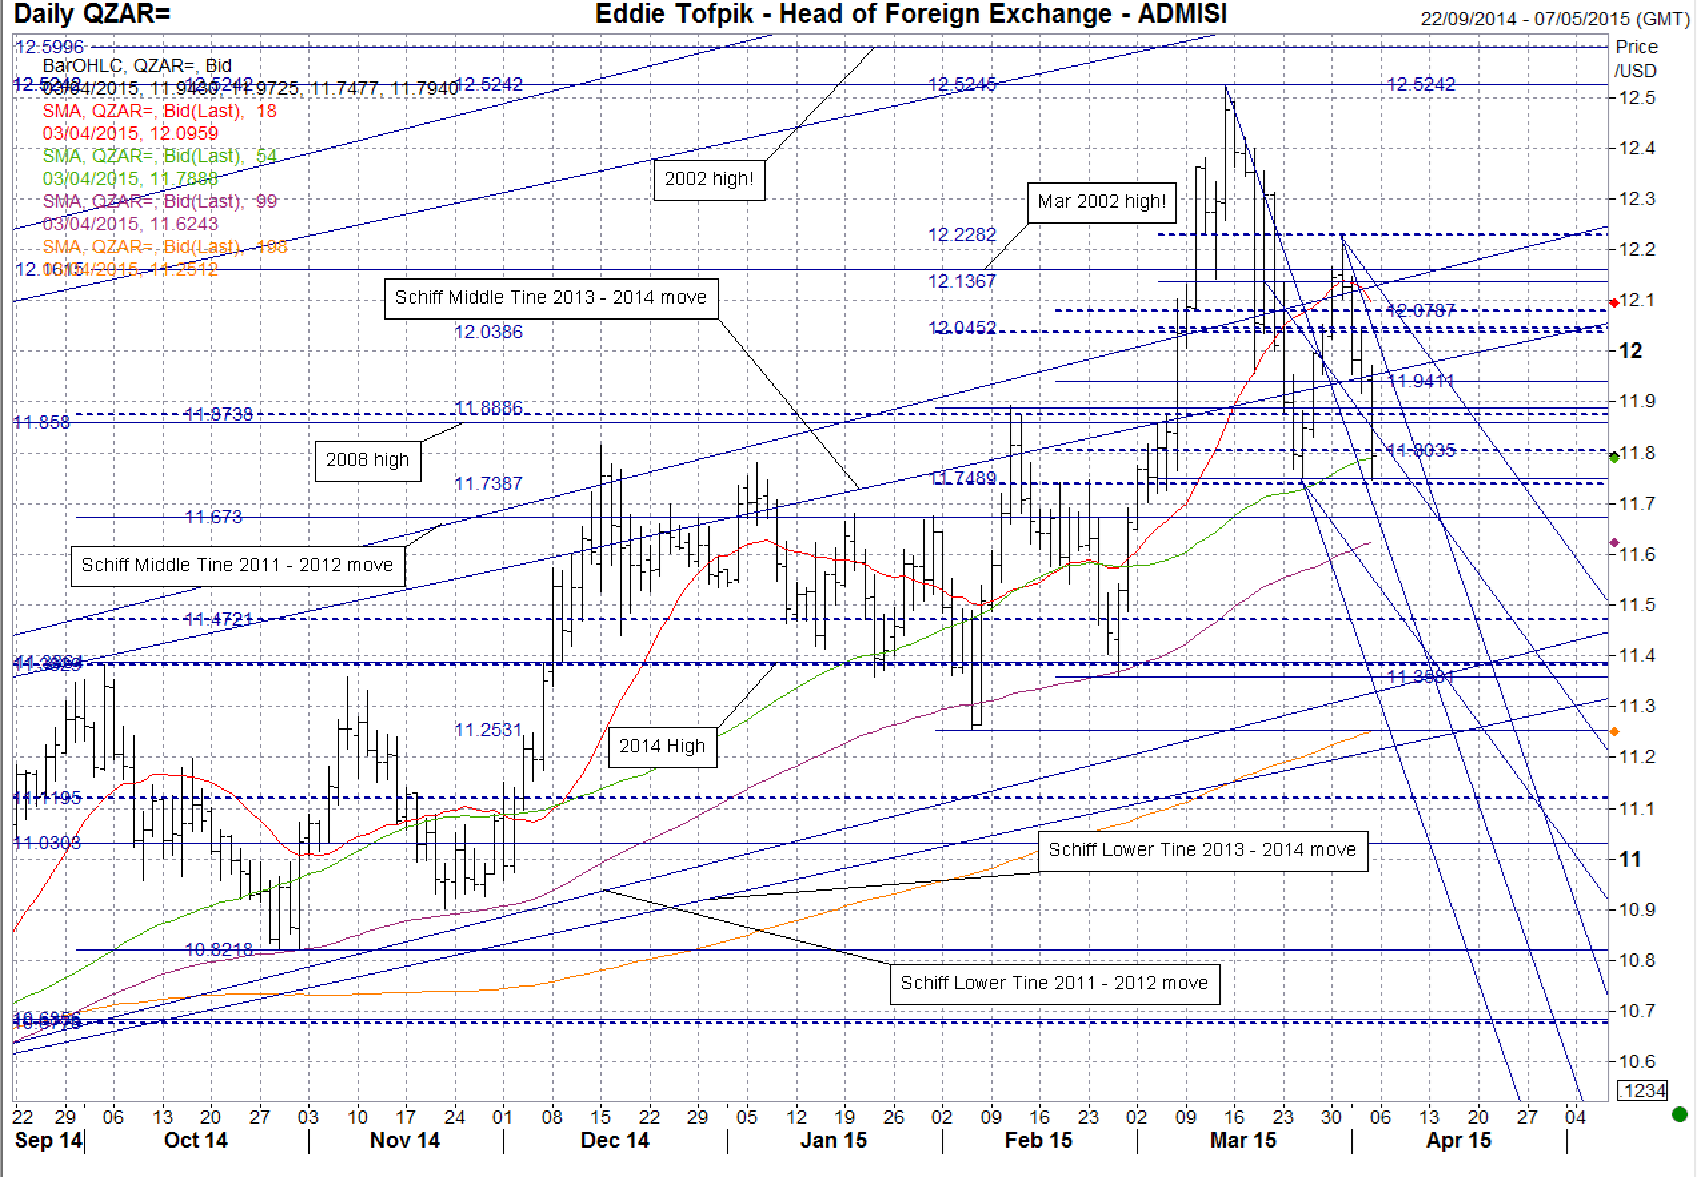
USDBRL
I have tidied up my Daily Chart above because it was just getting tooooo messy! It has allowed me to look at the rise the following Monday after my report and how it started the move higher through even the 3.0771 Aug 2004 high and only a minor high at 3.3420 finally seemed to stop the current rise! The bullet point above was correct at the time of last writing but I was just very cautious and did not anticipate such a quick move, even if it was in the right direction! The 3.3167 on the 20th of Mar marked the high-water mark for this pair as we have not only a Bearish Harami but also an Outside Day Down move – both on the Daily Chart plus an Indecisive Spinning Top on the Weekly Chart though there was also a Bullish Opening White Marubozo on the Monthly Chart. We have since tested back towards the Aug 2004 high at 3.0771, bounced back up and currently are trying back down as well as testing the 2015 Uptrend (currently 3.1369). In the short term there is an opportunity for the market to handle itself sideways and possibly lower to retest the 3.0771 level – the failure to retest the 3.3167 on the upside early last week is a symptom of that view. However, if we do try lower I imagine it must be soon – within the next few days, otherwise the Uptrend will likely reassert itself, even perhaps at a shallower angle. We have gone through a short period of indecision and perhaps it is time to find out which way the market wishes to go. I am very, very tempted to put this pair into neutral on the bullet point above but adhering to the rules means I will let it pass just one more month (I think). Support 3.0915, 3.0771, 3.0366 (dynamic), 3.0235, 3.0041, 2.9496 & if you wish to get bearish then consecutive closes below 2.9330! Resistance 3.1369 (dynamic), 3.0366 (dynamic) 3.2327, 3.2875 & 3.3167!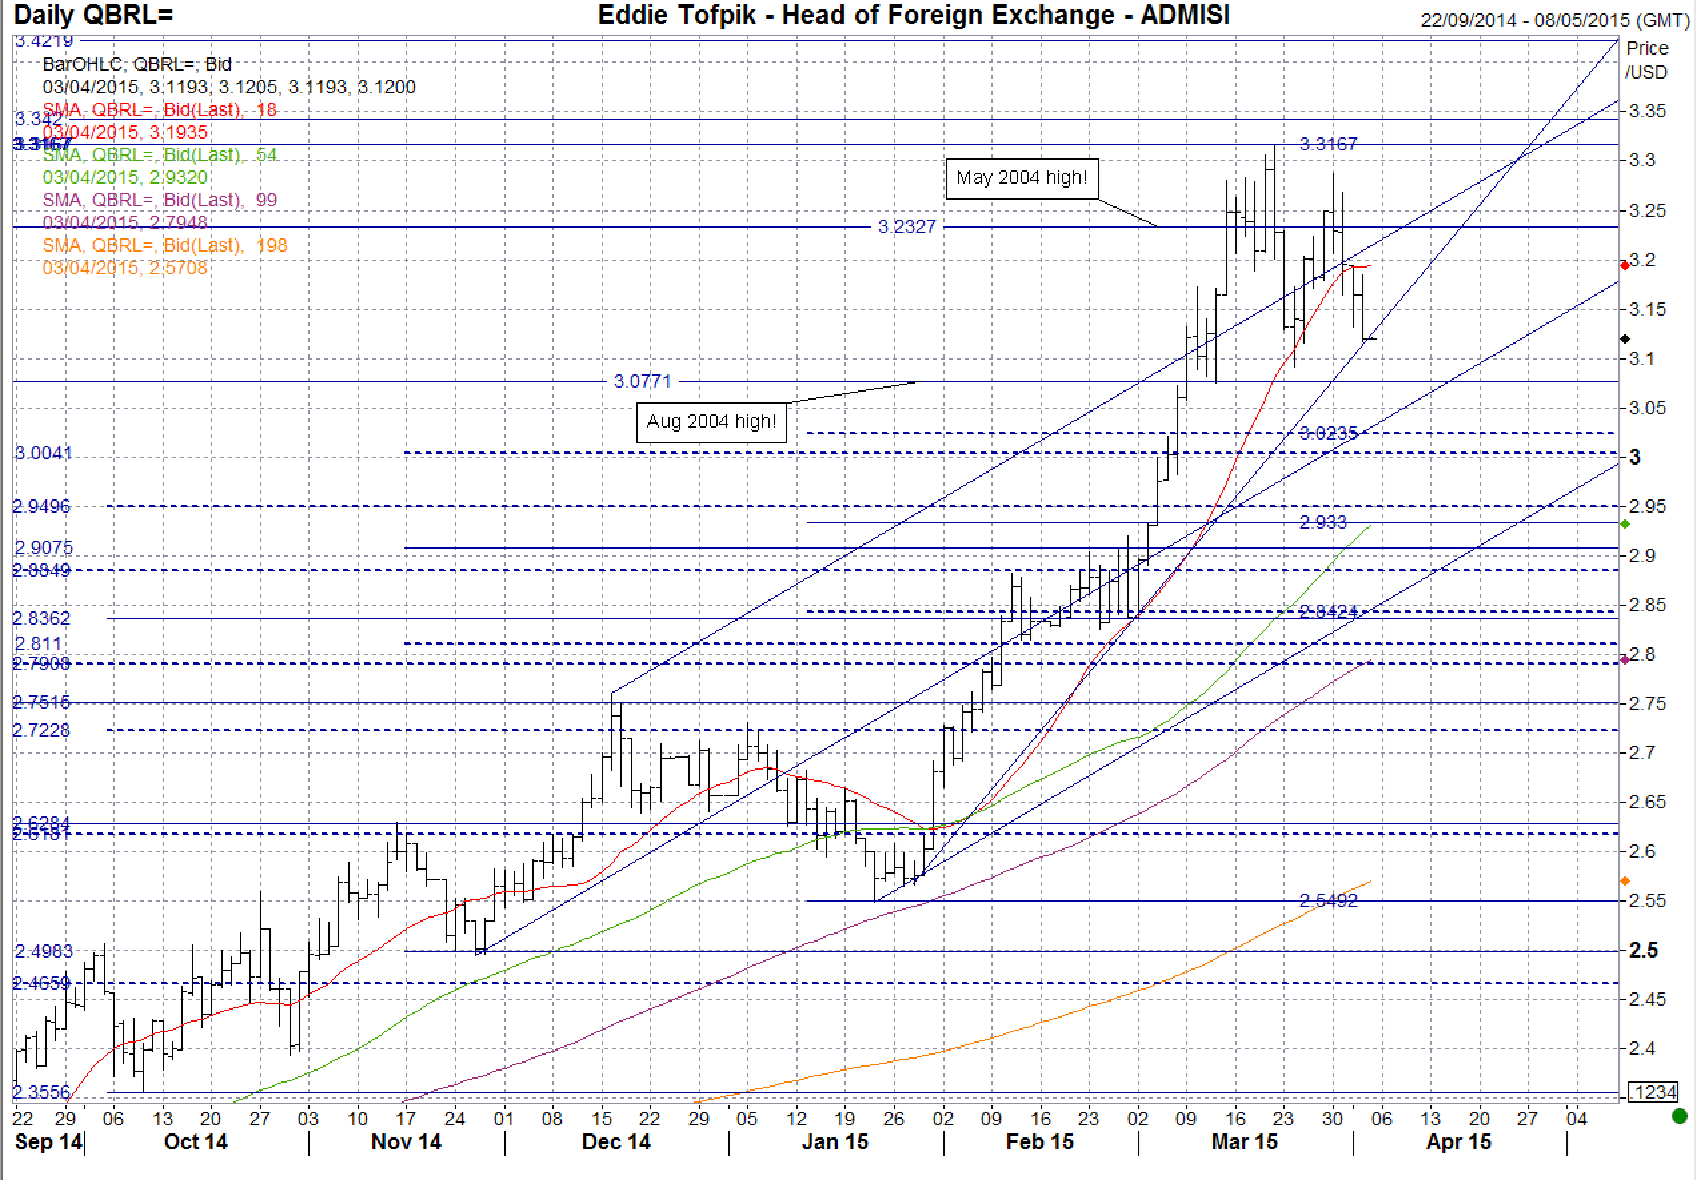
USDINR
The Key Reversal UP on the 4th of Mar set up the main move for Mar, a move that expended a lot of energy seeing prices go higher but which has ended with prices within a day’s range of this same period last month! Ultimately that is the test of the bullet point above and though we had a big range on the upside we still ended back down from the highs. Now the bearish Andrews & Schiff Pitchforks I drew last time have had to be expanded as prices have risen, they nevertheless are still seemingly valid so we have support at 61.83 (dynamic), 61.73 (combined), 61.65 and the rapidly ascending Long MA (currently 61.58). The Long MA will be the key event on any test lower, consecutive closes below that and we are talking a change to a bearish bullet point above! Topside, we have resistance at 62.15, a band 62.26 – 62.31 (including the Medium MA) & combined resistance at 62.57. Ideally, consecutive closes over 62.57 as a key 50% Fib line there ought to move you to a mildly bullish stance at least but we have seen that this past month so that would not be enough, you’d have to have consecutive closes over the 61.8% Fib of the same move at 62.88 to even look at that again! With all the confusion of the nearest three MAs, I’ve decided to keep it neutral above for this month!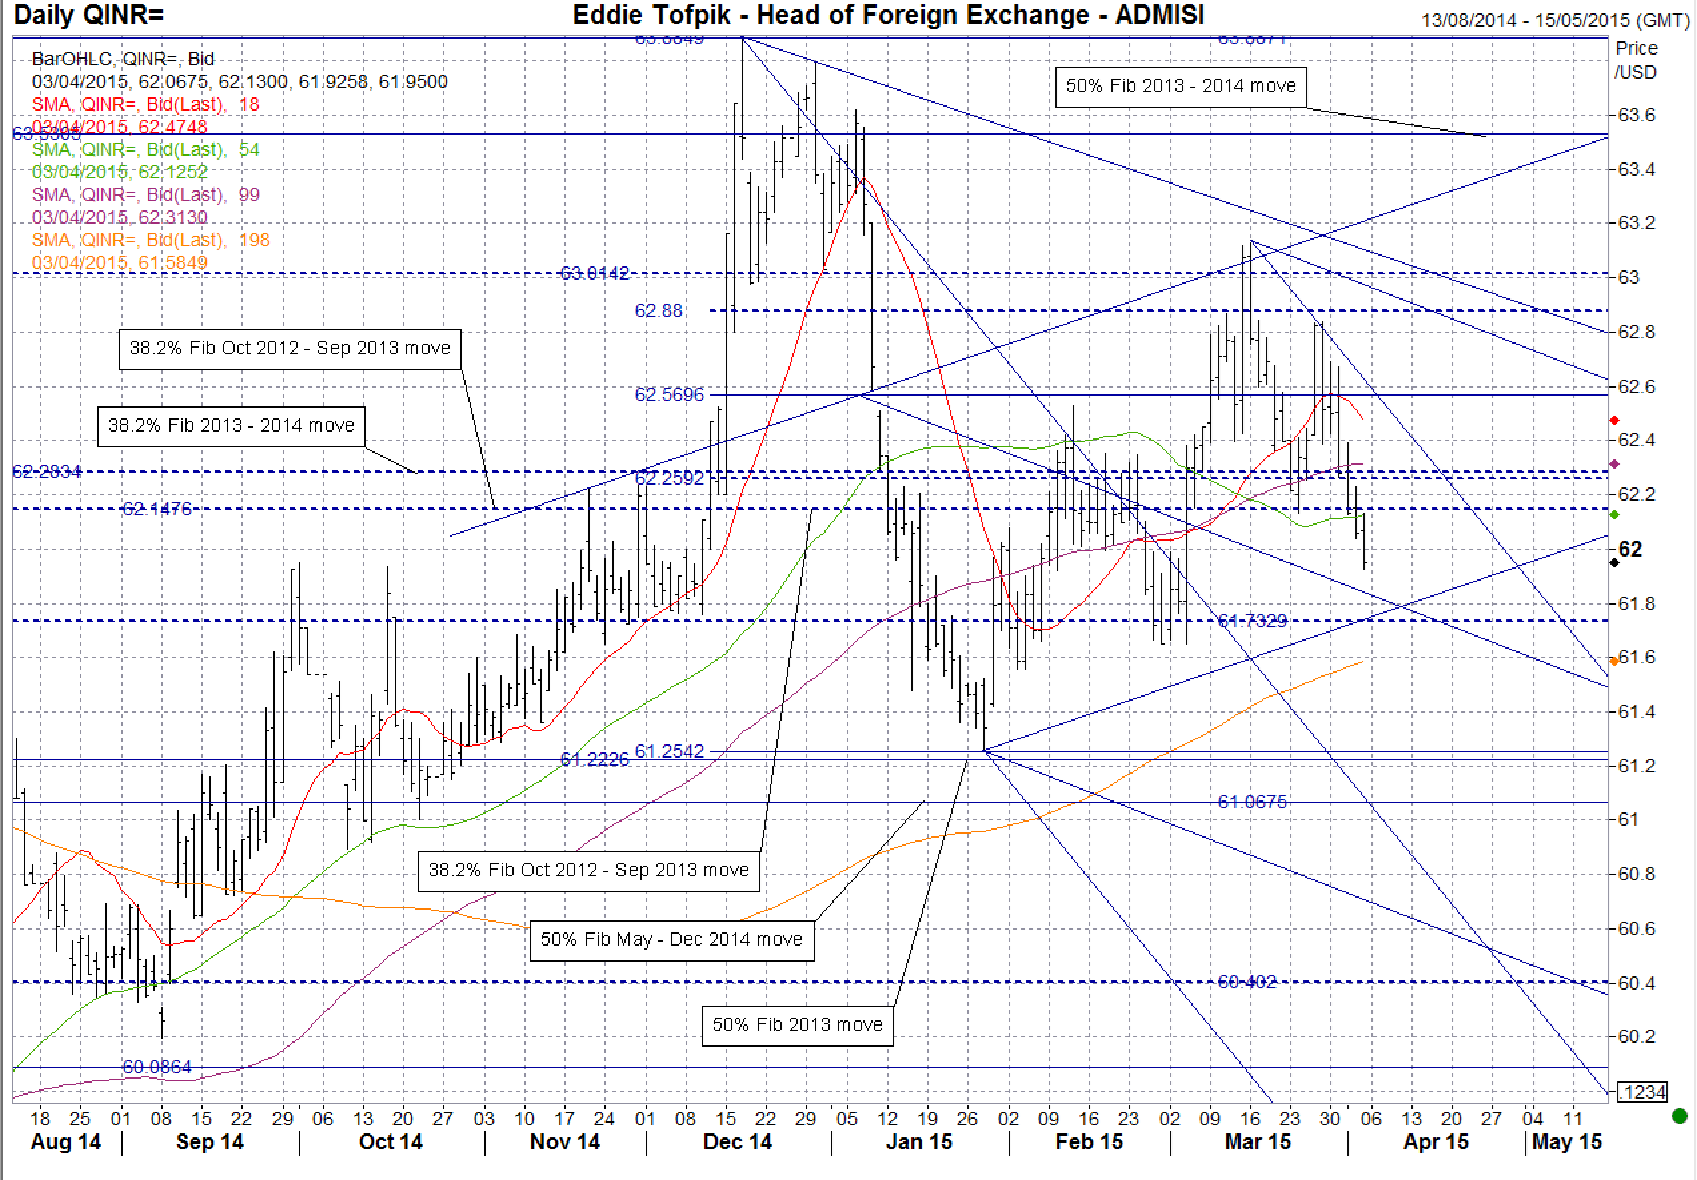
BTCUSD
What a boring month compared to previous months and also to other currencies! We tried higher punching up through the Medium MA resistance (currently 256.63) only to fail just ahead of key 50% Fib of the Nov 2014 – Jan 2015 move at 303.16 – thereby causing a Bearing Engulfing Pattern mid-month on the Weekly Chart and cementing the move back down. Though we formed on the Monthly Chart an ‘almost’ Bearish Shooting Star Pattern, we failed also to go lower as prices dipped twice towards the end of the month to the recent key 50% Fib support at 231.01 and have so far rejected that as well! So where now? Well, 1st thing is to put the bullet point above into neutral! Next is to look at the conjunction of so many MAs between 253 & 257! We have a rare pattern known as a Bow Tie Pattern in the MAs where three (or more) MAs come together and separate making the impression of their crossover as if it were a bow tie! This rare pattern has some rules and tends to be effective (from my past recollection) between 66% - 75% of the time! What happens is that approximately 15 – 20 working days after the crossover point the market moves in the direction of the way the Bow Tie points! In this particular case the crossover is happening now and (because BTCUSD trades ALL days then the move ought to happen between the 18th – 23rd of Apr (assuming we actually get the Bow Tie – we need to ascertain that in the next few days!). So far, it seems the direction is mildly bearish so let’s see how this works out for the pair! Support 249.56, 236.40, 231.01, 212.46 – 210.40 (dynamic), 208.48 & 207.61. Resistance 256.62 (dynamic), 267.51, 272.00, 280.46, 294.26, 296.79 – 297.95 & 303.16!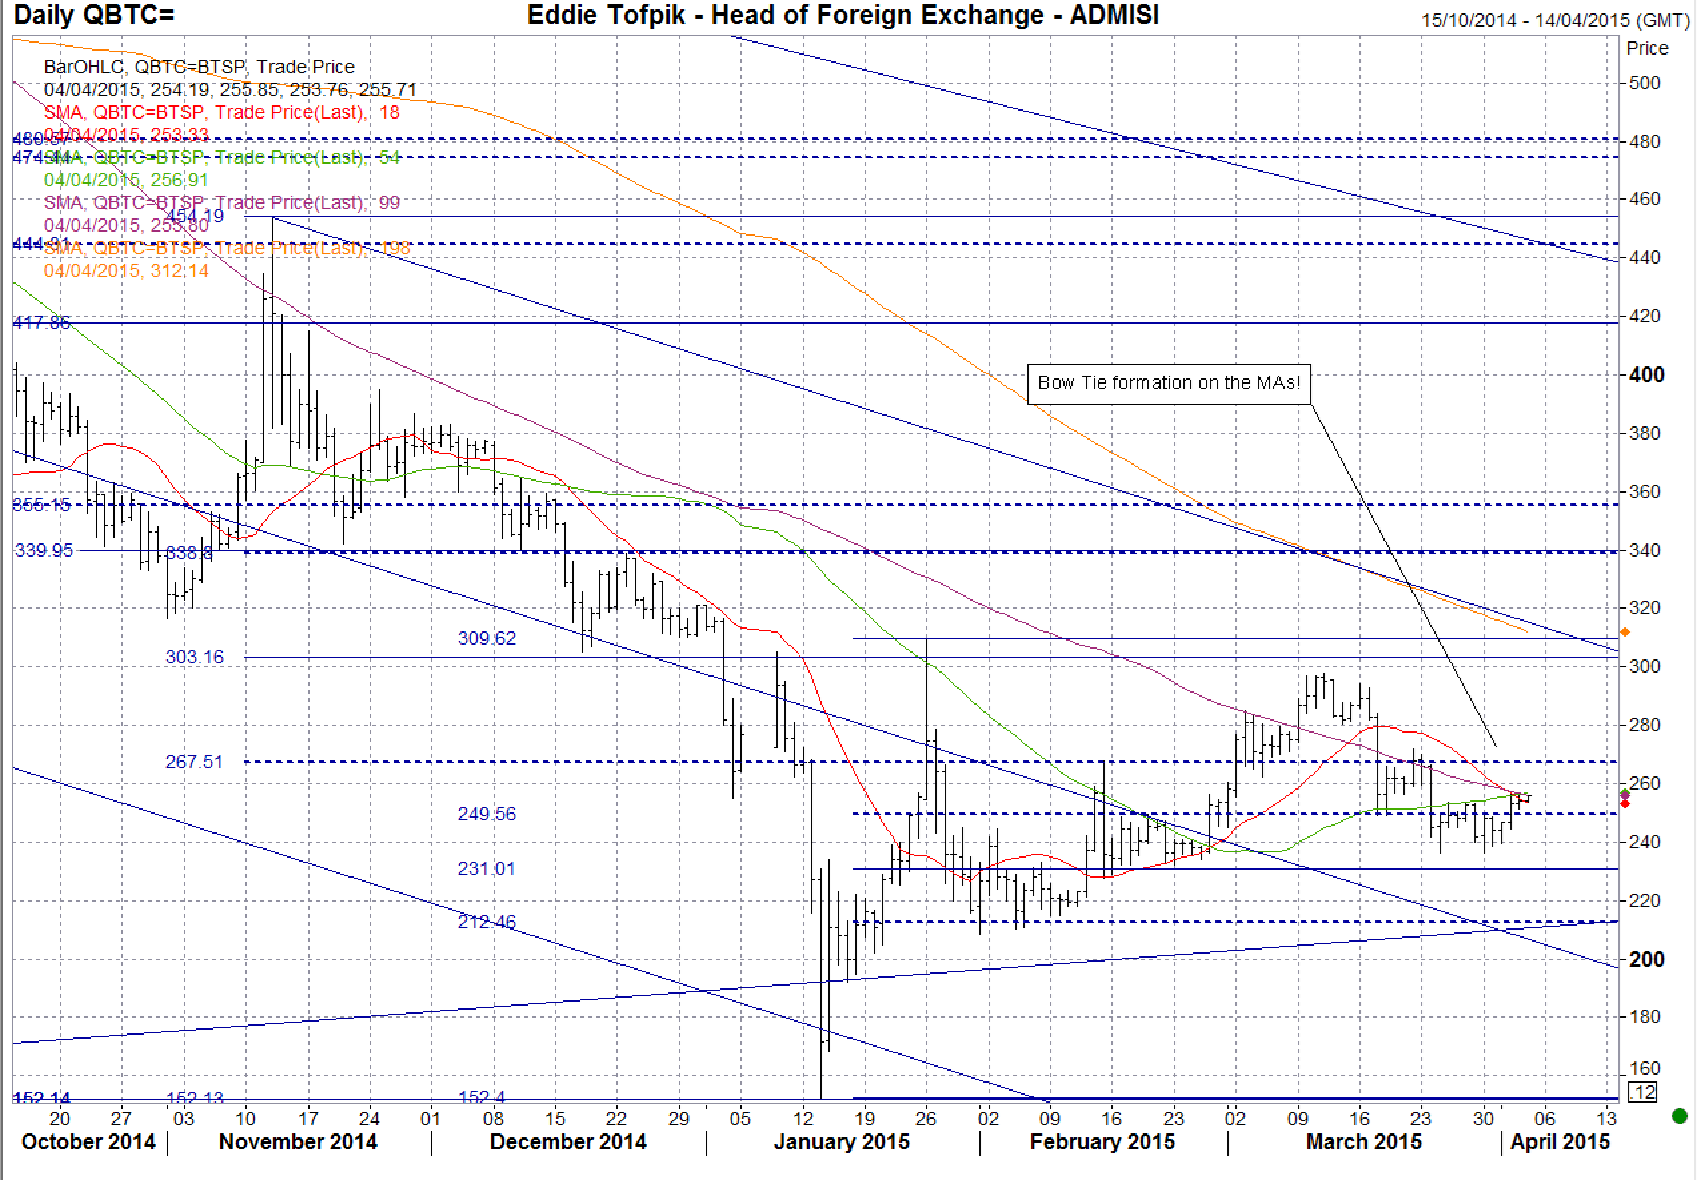
Recommended Content
Editors’ Picks
EUR/USD holds above 1.0650 after US data

EUR/USD retreats from session highs but manages to hold above 1.0650 in the early American session. Upbeat macroeconomic data releases from the US helps the US Dollar find a foothold and limits the pair's upside.
GBP/USD retreats toward 1.2450 on modest USD rebound

GBP/USD edges lower in the second half of the day and trades at around 1.2450. Better-than-expected Jobless Claims and Philadelphia Fed Manufacturing Index data from the US provides a support to the USD and forces the pair to stay on the back foot.
Gold clings to strong daily gains above $2,380

Gold trades in positive territory above $2,380 on Thursday. Although the benchmark 10-year US Treasury bond yield holds steady following upbeat US data, XAU/USD continues to stretch higher on growing fears over a deepening conflict in the Middle East.
Ripple faces significant correction as former SEC litigator says lawsuit could make it to Supreme Court

Ripple (XRP) price hovers below the key $0.50 level on Thursday after failing at another attempt to break and close above the resistance for the fourth day in a row.
Have we seen the extent of the Fed rate repricing?

Markets have been mostly consolidating recent moves into Thursday. We’ve seen some profit taking on Dollar longs and renewed demand for US equities into the dip. Whether or not this holds up is a completely different story.