![]() HY Markets Research Team
HY Markets Research Team
HY Markets
EUR/USD
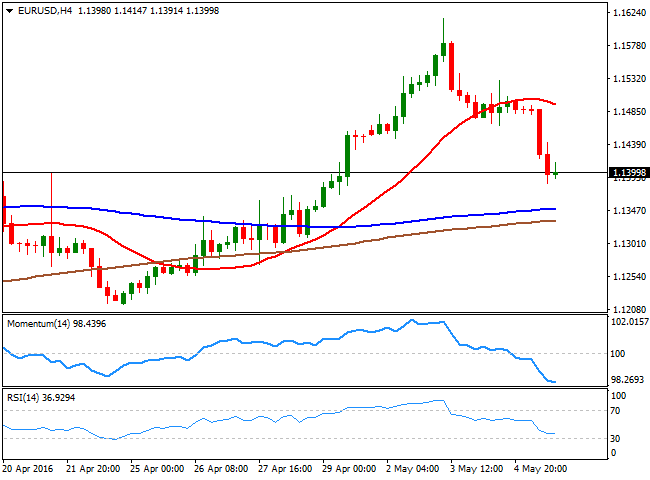
The EUR/USD pair edged sharply lower for the third consecutive day, falling down to 1.1385 before settling around the 1.1400 figure. Stocks opened generally higher in the region, although volumes were closed as France and German markets were close on holidays. The USD extended its advance during the US session, despite US initial jobless claims climbed 17,000 to 274,000 in the week ended Apr 29, the Labor Department said Thursday, above the 260,000 expected. However, claims remained near historically low levels, which is consistent with a strengthening job market. Japan will resume activity after a threeday holiday, although the reaction may be limited ahead of the release of the US Nonfarm Payroll report early Friday. Data has been quite mixed in the US, with some positive notes in jobs creation, but limited wages' growth, this last, probably the subcomponent that will define how the greenback will end the week. A solid job's report, with wages posting some interesting advances can spark nearterm dollar's gains, yet if they can be sustainable in time is yet to be seen. From a technical point of view, the pair moved from extremely overbought to extremely oversold in three days, according to the 4 hours chart technical readings, with the price now well below its 20 SMA, and nearing the 100 and 200 SMAs, posting limited advances in the 1.1300/30 region. The main support for the upcoming session is the 1.1380 level, which if it's broken with the report, can see the decline extending. The pair needs to regain the 1.1460 level on the other hand, to be able to resume its bullish trend, and end the week above the 1.1500 figure.
Support levels: 1.1380 1.1330 1.1290
Resistance levels: 1.1420 1.1460 1.1500
GBP/USD
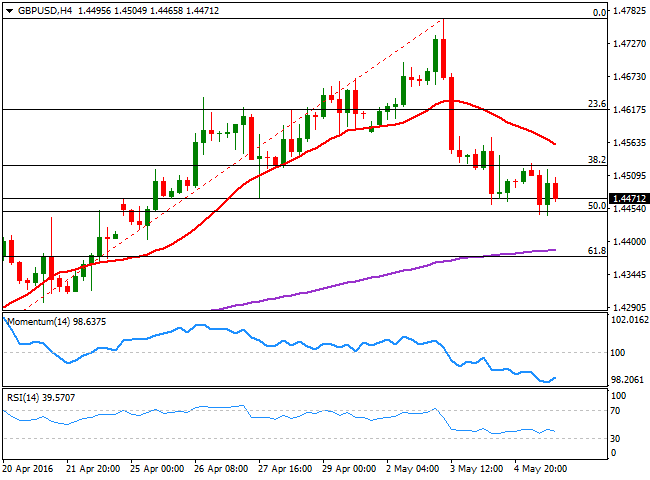
The GBP/USD pair extended its decline down to 1.4443 this Thursday, finding short term buying interest around the 50% retracement of its bullish run between 1.4171 and 1.4769. In fact, the pair traded well limited by Fibonacci levels, as sellers contained intraday rallies around 1.4515, the 38.2% retracement of the same rally. Data from the UK kept disappointing as the final reading of April Markit services PMI came in at 52.3, in line with market's belief of a low start of Q2 growth, and near a three year low. Ahead of the release of the US Nonfarm Payroll report, the technical picture favors additional declines in the pair, as in the 4 hours chart, the 20 SMA extended its decline above the current level, and stands now around 1.4560, while the RSI indicator has turned south around 39, and the Momentum indicator turned slightly higher near oversold levels, all of which maintains the risk towards the downside. The next bearish target on a break below the mentioned daily low is the 1.4370 region the 61.8% retracement of the mentioned rally.
Support levels: 1.4450 1.4410 1.4370
Resistance levels: 1.4520 1.4560 1.4610
USD/JPY
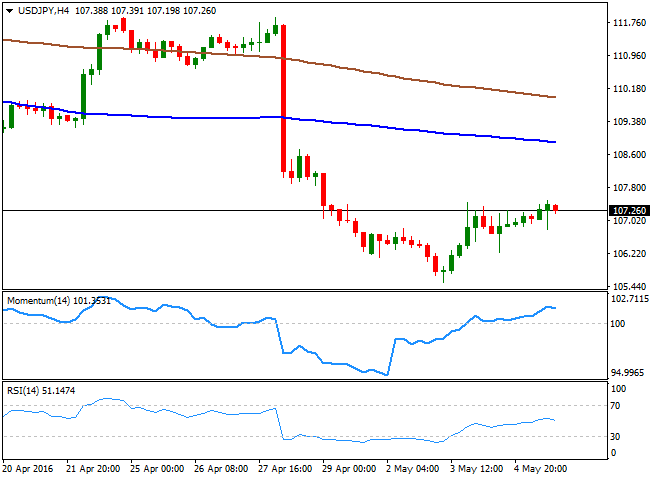
The USD/JPY pair ends the day near a fresh weekly high established in the American afternoon at 107.49, as dollar's demand prevailed for third day inarow. Nevertheless, investors remained away from the pair, as Japan holidays generate uncertainty over local policies, and ahead of the US employment report. The pair bottomed at 105.54 this week, its lowest since October 2014, but the level can be revisited with a disappointing US report. Also, the pair can suffer a downward knee jerk with the upcoming Tokyo opening, as worldwide stocks fell during the three day holiday in Japan, suggesting local shares may gap lower to later stabilize. Technically, the 4 hours chart shows that the price remains far below its moving averages, whilst the technical indicators are losing upward strength within positive territory, indicating the absence of buying interest at this time of the day, but not enough to support a downward move. A break below 106.60 is what it takes to confirm additional declines this Friday, back towards the mentioned multiyear low.
Support levels: 106.95 106.60 106.20
Resistance levels: 107.45 107.90 108.30
GOLD
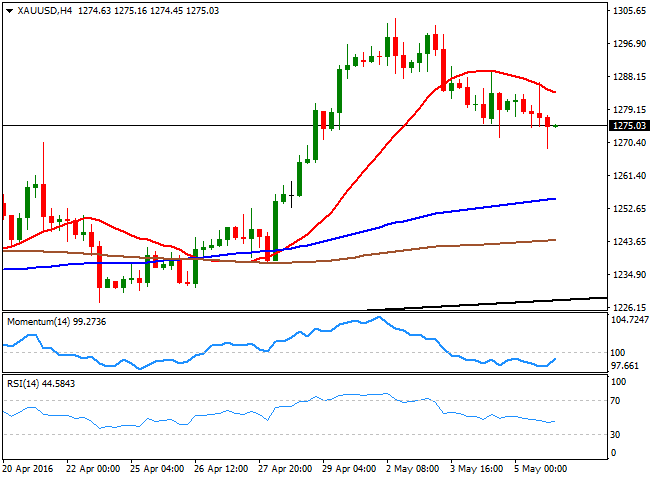
Gold prices started the day with a positive tone, with spot advancing up to $1,286.40 a troy ounce amid surging trading in China. The China Gold Association reported that trading turnover on the Shanghai Gold Exchange rose 45% in the first 3 months of 2016 from the same period last year, while gold contract trading on the Shanghai Futures Exchange rose 79%. The commodity, however, retreated from the mentioned high and plunged to a fresh weekly low of 1,268.80 to settle around 1,276.00 by the US close. The daily chart presents an increasing bearish potential as the price fell for a fourth day inarow, sending technical indicators further lower within positive territory and towards their midlines. In the same chart, the 20 SMA has lost its bullish strength and now stands flat well below the current level, while a daily ascendant trend line coming from February 10th daily low comes at 1,230.20, far below the current level and the level to break to confirm a steeper decline. In the 4 hours chart, the 20 SMA has contained the rally and currently offers a dynamic resistance at 1,284.65, while the technical indicators have turned slightly higher, but remain below their midlines, maintaining the risk towards the downside.
Support levels: 1,268.80 1,258.90 1,250.10
Resistance levels: 1,284.65 1292.30 1,297.10
WTI CRUDE
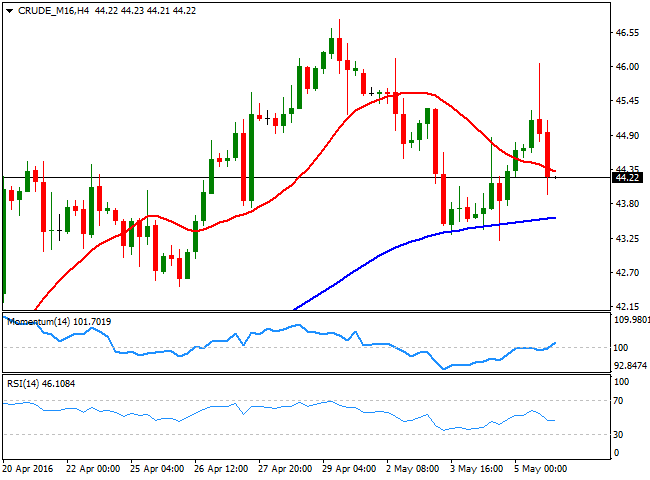
Crude oil prices rallied at the beginning of the day, with WTI futures posting a daily high of $46.05 a barrel, on the back of the huge wildfire going on in the oil sands' region in Canada, forcing the close of many pipelines, and escalating tensions in Libya. Prospects of diminishing supply supported the early rally, although the commodity trimmed almost all of its daily gains to close the day pretty much flat around 44.30, on dollar's strength. From a technical point of view, the daily chart shows that the price holds above a horizontal 20 SMA, whilst the technical indicator lack clear directional strength, but hold within positive territory. In the 4 hours chart, the price is hovering around a bearish 20 SMA, while the technical indicators head modestly higher around their midlines, not enough to confirm an upward continuation. The key support stands at 43.20, the weekly low, with a break below it opening doors for a test of the 40.00 level ahead of the weekend.
Support levels: 43.90 43.20 42.50
Resistance levels: 44.60 45.10 45.80
DAX
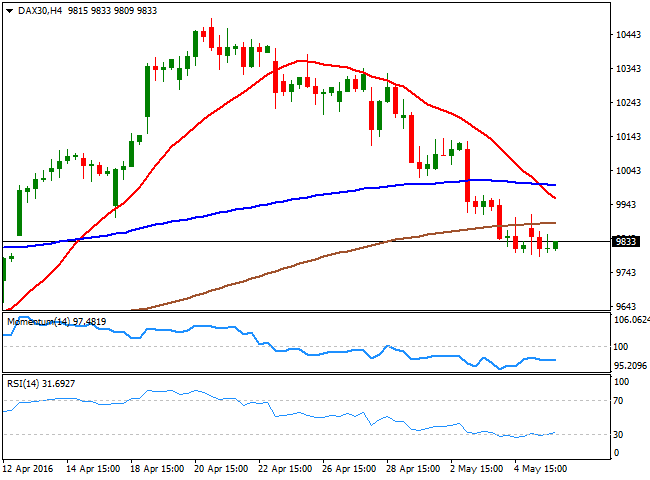
European stocks were buoyed on oil's advance, although a holiday in Germany kept action around the DAX limited. The index ended the day 23 points higher at 9.851.86, after posting a fresh weekly low of 9,790, but the absence of local macro data and corporate news added to the diminished volume. The index retreated in after hours trading, and the daily chart shows that it was unable to recover above a bearish 100 DMA, currently at 9,873, whilst the technical indicators remain within negative territory, but losing previous bearish strength. In the shorter term, the 4 hours chart, shows that the index has been consolidating near its recent lows, capped by the 200 SMA and with the 20 SMA heading sharply lower above it, increasing chances of further declines. The technical indicators in the mentioned time frame have lost directional strength well below their midlines, also in line with new slides particularly on a break below the mentioned daily low.
Support levels: 9,790 9,741 9,685
Resistance levels: 9,867 9,914 10,000
DOW JONES
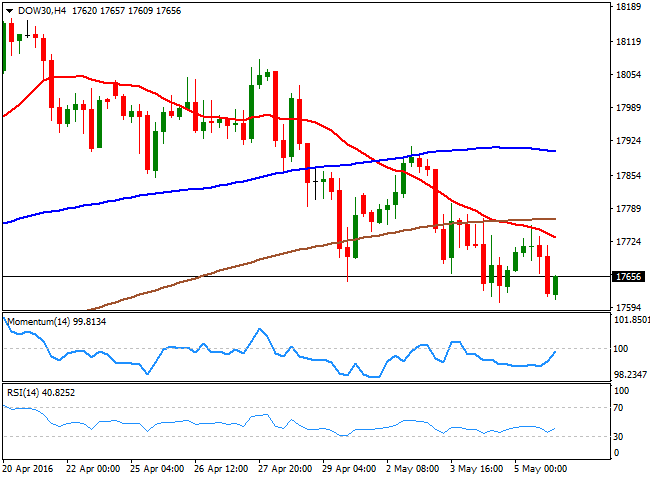
US stocks failed to sustain intraday gains and closed little changed on Thursday, as the rally in oil and energy related equities lost momentum during afternoon trade. The Dow Jones Industrial Average rose 9 points, or 0.05%, to close at 17,661. The SandP 500 Index lost 0.5 point, or 0.02%, to 2,051. The Nasdaq Composite Index fell 8 points, or 0.18%, to close at 4,717. Disappointing jobless claims data weighed on sentiment as investors await the key US nonfarm payrolls report due on Friday. The bearish momentum continues in the index, and the daily chart shows that the price is currently below its 20 SMA, whilst the technical indicators maintain their downward slopes below their midlines. In the 4 hours chart, the technical indicators have turned north from near oversold levels, but remain below their midlines, whilst the 20 SMA acts as dynamic resistance now around 17,731, having accelerated its decline below the 100 and 200 SMAs.
Support levels: 17,609 17,530 17,440
Resistance levels: 17,692 17,731 17,812
FTSE 100
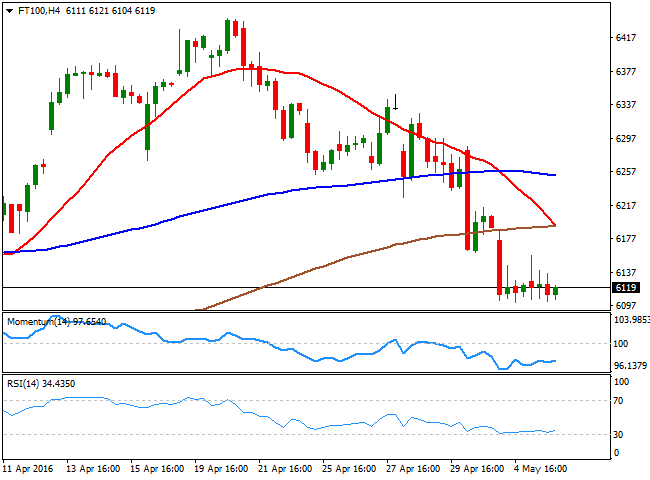
The FTSE 100 posted a modest recovery this Thursday, helped by a strong rally in oil prices that the market reverted later on the day. The Footsie closed the day up 0.09% or 5 points at 6,117.25, with energy related shares leading the advance. Tullow Oil advanced 6.1% and Royal Dutch Shell 1.31%, filtering the 9.78% slide of Centrica, after the energy supplier said it plans to place shares for around £750 million in the light of mounting pressure on its credit rating. The daily chart shows that the index has made little progress after plummeting to a fresh 1 month low, as it remains near 6,100, with the technical indicators having flattened near oversold levels. In the 4 hours chart, the benchmark has been trading in a well limited range for most of the day, leaving technical indicators flat near oversold levels. In this last time frame, the index is far below its moving averages, with the 20 SMA about to cross below the 200 SMA after already breaking below the 100 SMA, also indicating that the risk is towards the downside.
Support levels: 6,101 6,062 6,006
Resistance levels: 6,155 6,214 6,256
The information set forth herein was obtained from sources which we believe to be reliable, but its accuracy cannot be guaranteed. It is not intended to be an offer, or the solicitation of any offer, to buy or sell the products or instruments referred herein. Any person placing reliance on this commentary to undertake trading does so entirely at their own risk.
Recommended Content
Editors’ Picks
AUD/USD could extend the recovery to 0.6500 and above

The enhanced risk appetite and the weakening of the Greenback enabled AUD/USD to build on the promising start to the week and trade closer to the key barrier at 0.6500 the figure ahead of key inflation figures in Australia.
EUR/USD now refocuses on the 200-day SMA

EUR/USD extended its positive momentum and rose above the 1.0700 yardstick, driven by the intense PMI-led retracement in the US Dollar as well as a prevailing risk-friendly environment in the FX universe.
Gold struggles around $2,325 despite broad US Dollar’s weakness

Gold reversed its direction and rose to the $2,320 area, erasing a large portion of its daily losses in the process. The benchmark 10-year US Treasury bond yield stays in the red below 4.6% following the weak US PMI data and supports XAU/USD.
Bitcoin price makes run for previous cycle highs as Morgan Stanley pushes BTC ETF exposure

Bitcoin (BTC) price strength continues to grow, three days after the fourth halving. Optimism continues to abound in the market as Bitcoiners envision a reclamation of previous cycle highs.
US versus the Eurozone: Inflation divergence causes monetary desynchronization

Historically there is a very close correlation between changes in US Treasury yields and German Bund yields. This is relevant at the current juncture, considering that the recent hawkish twist in the tone of the Federal Reserve might continue to push US long-term interest rates higher and put upward pressure on bond yields in the Eurozone.