![]() HY Markets Research Team
HY Markets Research Team
HY Markets
EUR/USD
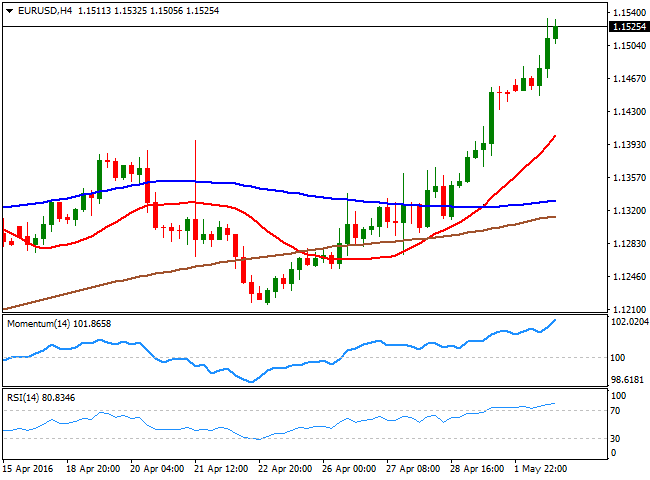
The dollar's bearish trend extended to fresh lows at the beginning of May, down against all of its major rivals. The EUR/USD pair advanced up to 1.1534, level last seen in August 2015 when Chinese Black Monday sent the dollar sharply hundred of pips lower across the board. In the macroeconomic front, data coming from Europe showed that the manufacturing sector in the region grew modestly in April, as the final revisions of the Markit manufacturing PMIs came in mixed, with German reading up to 51.8, from March's 50.7, but below expectations, whilst the EU figure resulted at 51.7 and French one plummeted to 48.0. Things in the US were not better, as the ISM manufacturing declined to 50.8 in April from 51.8 in March, whilst the Markit manufacturing PMI also printed 50.8. Also released this Monday, US construction spending advanced in March to its highest level in more than eight years, up 0.3% from the previous month, giving hopes the first quarter slowdown receded, at least in the housing sector. The pair stands firmly above the 1.1500 figure, with scope to reach 1.1713, the high reached last August, and well above the 1.1460 region, now a major support level. As long as retracements towards the level attract buying interest, the pair has scope to test such high. Intraday charts show that the bullish tone persists, despite indicators stand in extreme overbought territory. Some consolidation could be expected ahead of the Nikkei opening, yet additional advances beyond 1.1545, now the immediate resistance, should support an upward continuation for this Tuesday.
Support levels: 1.1460 1.1420 1.1380
Resistance levels: 1.1545 1.1590 1.1630
GBP/USD
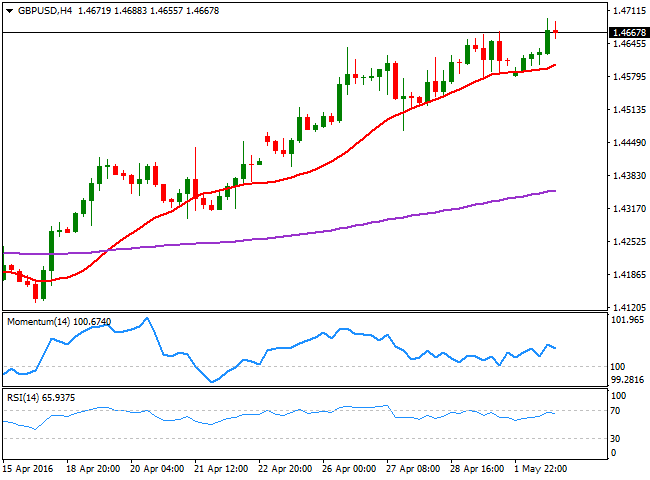
The GBP/USD pair advanced up to 1.4695, its highest in four months, and holds nearby at the end of the day, with no certain catalyst behind the mode beyond dollar's own weakness. Relief over the possibility of a Brexit has kept the Pound surging during the previous weeks, but the rally stalled amid poor UK macroeconomic data, pointing for a continued slowdown in the local economy. The kingdom will release its manufacturing figures this Tuesday, and given the releases of this Monday, the figure will likely disappoint, weighing on the GBP. From a technical point of view, and despite the rally extended, the upside is looking slightly exhausted, as in the 4 hours chart, the technical indicators lack clear directional strength, having turned modestly lower within positive territory. In the mentioned time frame, however, the 20 SMA keeps heading higher and acting as dynamic support, now around 1.4605, the level to break to confirm a downward move for the upcoming sessions.
Support levels:1.4655 1.4605 1.4570
Resistance levels: 1.4710 1.4750 1.4790
USD/JPY
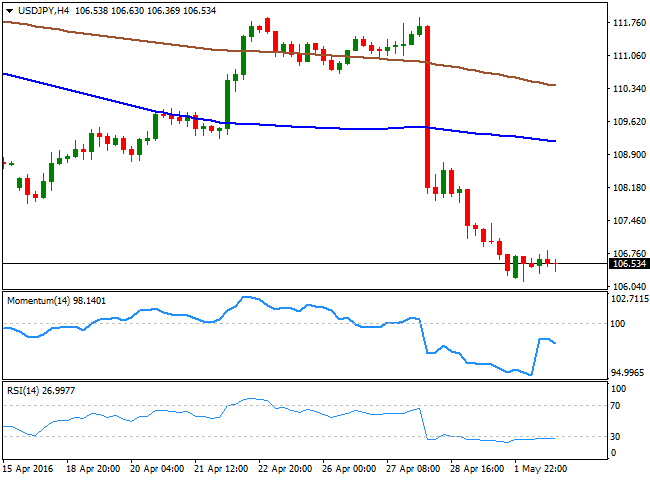
The USD/JPY plunged to a fresh 18month low of 106.13 early Asia before posting a shallow bounce, still trading below the 107.00 figure. Data coming from Japan indicated that April manufacturing PMI declined to 48.2, against an initial estimate of 48.0 and March final reading of 49.1, below the 50 threshold and with manufacturing conditions deteriorating at the sharpest rate in over three years. The pair is expected to trade rangebound ahead of Friday's US Nonfarm Payroll report, moreover as Japanese markets will be closed until then, due to the Golden Week holidays. In the meantime, the pair retains the bearish tone seen on previous updates, with the technical indicators having corrected extreme oversold conditions in the 1 hour chart, but lacking directional strength, and the 4 hours chart showing that the Momentum indicator resumed its decline below the 100 level and the RSI consolidates around 26. Should the decline extend beyond 106.10, the immediate support, the pair will likely extend down to 105.00, as investors seem determinate to test BOJ's line in the sand.
Support levels: 106.10 101.75 101.40
Resistance levels: 106.90 107.35 107.80
GOLD
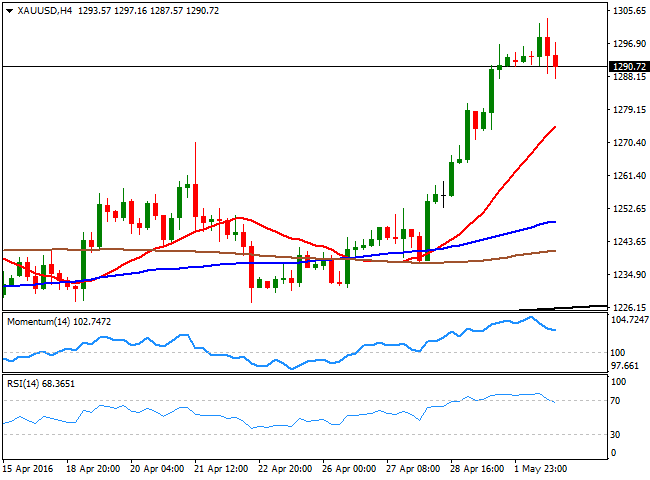
Spot gold reached $1300.00 a troy ounce for the first time in 15 months, up over 22% ever since the year started. Gains in the commodity have been supported by well different reasons as during the first quarter, gold ran on a flight to safety due to fears of a global economic slowdown. But as conditions, and therefore sentiment improved, the bright metal continued gaining, underpinned by a weaker dollar and the FED delaying a rate hike. Now trading around $ 1,290.70, spot gave back all of its daily gains, but remains above March high of 1,283.50, the level to break to see a deeper downward corrective movement beyond some intraday profit taking. From a technical point of view, the daily chart shows that the price remains well above its moving averages, and the daily ascendant trend line that led the advance since early February. The technical indicators in the mentioned time frame are retreating partially from near overbought readings, but are still far from suggesting a stronger downward move. Shorter term and according to the 4 hours chart, the corrective movement can extend towards the mentioned support, as the technical indicators turned south in extreme overbought levels and maintain their bearish slopes, whilst the price also develops well above its moving averages, indicating limited scope for declines.
Support levels: 1,283.50 1,271.10 1,262.30
Resistance levels: 1,297.10 1,308.40 1,319.25
WTI CRUDE
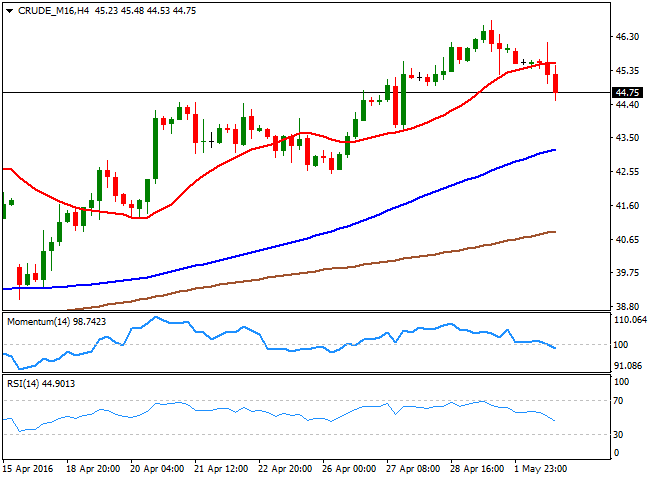
In spite of dollar's weakness, crude oil prices fell at the beginning of the week, with US WTI futures back below $ 45.00 a barrel, on speculation OPEC output surged in April to near all time peaks. According to a Reuters survey, the OPEC pumped 32.64 million barrels a day in April, up 170,000 barrels from its March output. Following the news, speculative interest ran to take profits out from the latest rally, sending US oil to a daily low of 44.53. The black gold eased around 3%, after adding roughly 20% in April, and the daily chart shows that the price continues developing well below a bullish 20 SMA, currently around 43.25, whilst the RSI indicator retreated from overbought levels and heads lower around 61, and the Momentum indicator remains flat above 100, not enough at this point to confirm further falls. In the 4 hours chart, however, the risk is of further slides, as the technical indicators head lower below their midlines, whilst the price broke below its 20 SMA, currently around 45.60. A break below the mentioned daily low should open doors for a continued decline this Tuesday, towards the 43.00/30 region.
Support levels: 44.50 43.80 43.20
Resistance levels: 45.60 46.10 46.75
DAX
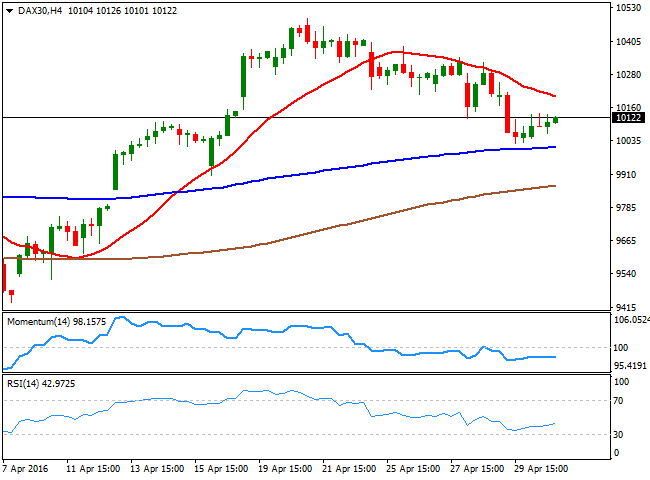
European stocks closed generally lower this Monday pressured by sliding oil prices, although the German DAX managed to add 85 points to end at 10,123.27, underpinned by a betterthanexpected April manufacturing PMI in the country, up to 51.8 from 50.7, as new orders increased at the fastest pace in three months. Auto makers edged higher, with Volkswagen adding 0.16%, and Daimler surging by 0.66%, although the banking sector remained under pressure. Mario Draghi spoke at the Asian Development Bank's 49th Annual Meeting, in Frankfurt, and responded to the latest German criticism, saying low borrowing costs were symptomatic of a glut in global savings for which Germany was partly to blame. Besides that, he added nothing new in regards of future economic policies to be applied by the ECB. It´s quite significant that the index has held above the 10,000 level, and bulls will likely remain encouraged. In the daily chart, the index bounced from a bullish 20 SMA, whilst the Momentum indicator keeps heading south within positive territory, but the RSI turned higher around 52. In the 4 hours chart, the index is developing below a bearish 20 SMA, currently at 10,200, whilst the technical indicators aim slightly higher within bearish territory. The index needs to extend beyond this last, to be able to recover the bullish momentum seen mid April.
Support levels: 10,062 10,000 9,948
Resistance levels: 10,132 10,200 10,290
DOW JONES
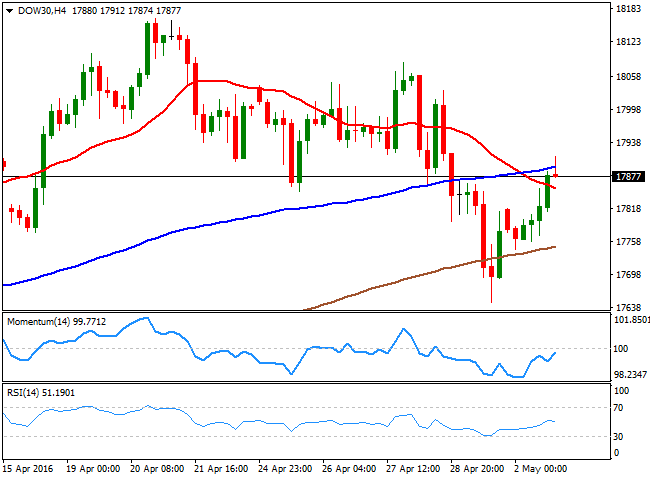
US stocks closed higher on Monday with the recovery led by tech stocks that bounced after last week’s heavy losses. However, Apple’s stocks ended 0.1% lower, posting the eighth straight loss in a row, the longest losing streak since July 1998. The DJIA rose 117points, or 0.66%, to close at 17,891.16. The SandP 500 gained 16 points, or 0.78%, to 2,081.43. The Nasdaq advanced 42 points, or 0.88%, to end at 4,817.59. The Dow's daily recovery stalled right below the 20 DMA, while in the same chart, the technical indicators have turned slightly higher within bearish territory, presenting for the most a neutral stance. Shorter term, the 4 hours chart shows that the index is now above a still bearish 20 SMA, while the technical indicators bounced from oversold levels but remain below their midlines, suggesting the risk is still towards the downside, particularly if the benchmark is unable to advance beyond Monday's intraday high of 17,912.
Support levels: 17,849 17,791 17,752
Resistance levels: 17,912 17,993 18,068
FTSE 100
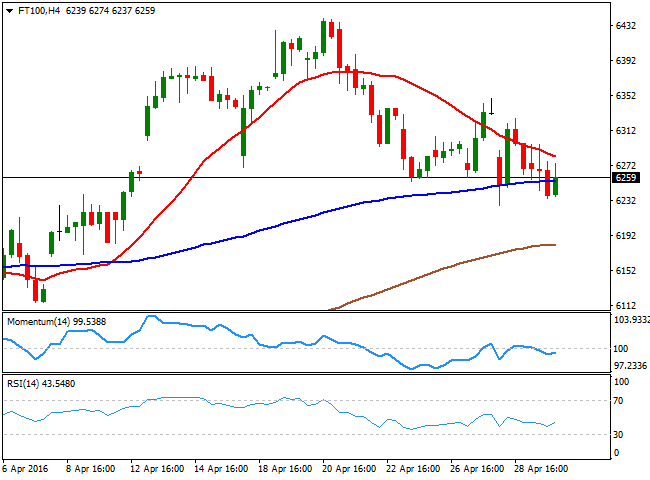
UK stock market remained closed this Monday in observance of a local holiday, the May Day. The latest registered close of the Footsie was last Friday at 6,241.89, and currently stands a few points above it, as futures trading saw little action during a lackluster European session. As commented on the previous update, the daily chart shows that the index is trading below the 20 DMA, but above the 200 DMA, this last a strong dynamic support at 6,209, while the technical indicators remain flat around their midlines with no clear directional strength, suggesting further declines are yet to be confirmed. In the 4 hours chart, a mild bearish tone prevails, as the index has been capped by a bearish 20 SMA, while the technical indicators hover within bearish territory. The decline can extend down to the 6,100 region this Tuesday, particularly if oil continues sliding.
Support levels: 6,209 6,157 6,101
Resistance levels: 6,310 6,368 6,440
The information set forth herein was obtained from sources which we believe to be reliable, but its accuracy cannot be guaranteed. It is not intended to be an offer, or the solicitation of any offer, to buy or sell the products or instruments referred herein. Any person placing reliance on this commentary to undertake trading does so entirely at their own risk.
Recommended Content
Editors’ Picks
EUR/USD clings to daily gains above 1.0650

EUR/USD gained traction and turned positive on the day above 1.0650. The improvement seen in risk mood following the earlier flight to safety weighs on the US Dollar ahead of the weekend and helps the pair push higher.
GBP/USD recovers toward 1.2450 after UK Retail Sales data

GBP/USD reversed its direction and advanced to the 1.2450 area after touching a fresh multi-month low below 1.2400 in the Asian session. The positive shift seen in risk mood on easing fears over a deepening Iran-Israel conflict supports the pair.
Gold holds steady at around $2,380 following earlier spike

Gold stabilized near $2,380 after spiking above $2,400 with the immediate reaction to reports of Israel striking Iran. Meanwhile, the pullback seen in the US Treasury bond yields helps XAU/USD hold its ground.
Bitcoin Weekly Forecast: BTC post-halving rally could be partially priced in Premium

Bitcoin price shows no signs of directional bias while it holds above $60,000. The fourth BTC halving is partially priced in, according to Deutsche Bank’s research.
Week ahead – US GDP and BoJ decision on top of next week’s agenda

US GDP, core PCE and PMIs the next tests for the Dollar. Investors await BoJ for guidance about next rate hike. EU and UK PMIs, as well as Australian CPIs also on tap.