![]() HY Markets Research Team
HY Markets Research Team
HY Markets
EUR/USD
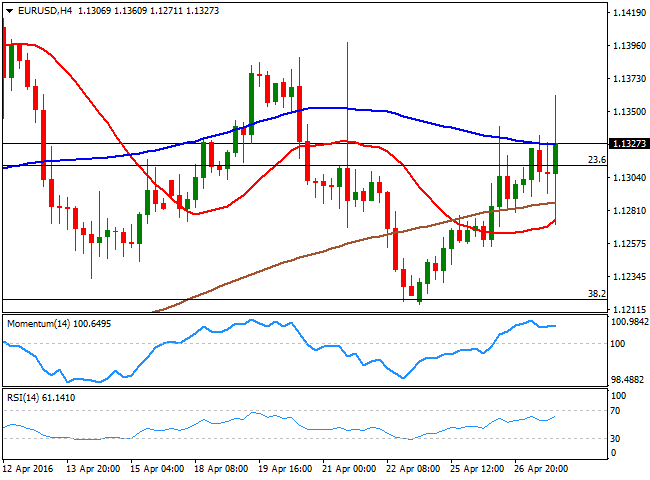
Majors traded within limited ranges during the first half of the day, as markets awaited the US Federal Reserve latest economic policy decision that anyway resulted a disappointment, as the Central Bank failed to clarify the date of an upcoming rate hike. The dollar initially rallied across the board, on a headline announcing that the FED is no longer concerned over the economic slowdown, by omitting to say that “global economic and financial developments continue to pose risks,” whilst once again, they seem comfortable over the developments of the job's sector. Finally, the committee reiterated that it will probably raise rates at a “gradual” pace. Anyway, the statement failed to clearly hint an upcoming rate hike, and chances have diminished for a move during the June meeting. After investors digested the news, the dollar is modestly lower across the board, with all eyes now on the Bank of Japan' decision, to be announced some time during the upcoming Asian session.The EUR/USD pair traded between 1.1271 and 1.1360 right after the event, settling finally above 1.1315, the 23.6% retracement of the March/April bullish run, and presents a mild positive tone in the 4 hours chart, as the low converges with the 20 SMA, whilst the technical indicators head modestly higher within bullish territory. Overall, the upside remains favor, yet the pair needs to advance beyond the immediate resistance formed by the 1.1380/90 region to be able to continue rallying towards the 1.1460 region. Bulls will maintain the lead as long as the price holds above 1.1270.
Support levels: 1.1270 1.1230 1.1200
Resistance levels: 1.1385 1.1420 1.1460
GBP/USD
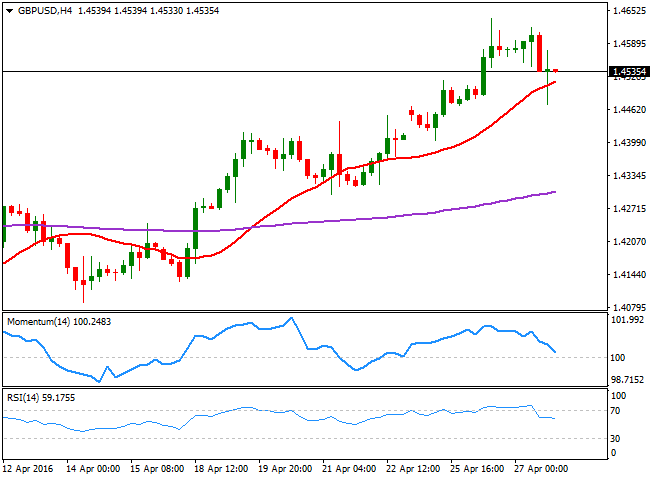
The GBP/USD pair fell this Wednesday, down after FED's decision to 1.4472, before settling around the 1.4530 level. The Sterling failed to advance, despite earlier in the day, the release of the UK GDP figures for the first quarter was modestly positive, as the economy grew 0.4% during the first three months of the year, matching expectations, whilst the yearonyear reading came in at 2.1%, above the 2.0% expected. The pair, however, was unable to held above the 1.4600 level afterwards, accelerating its decline as the bullish strength seen at the beginning of the week lost momentum. So far, the intraday decline seems corrective, although further declines below the 1.4470 support should open doors for additional slides on Thursday. From a technical point of view, the 4 hours chart shows that the price is still holding above a bullish 20 SMA, despite a short lived slide below it postFED, while the Momentum indicator keeps heading south and approaching the 100 level, and the RSI indicator stands flat around 58, limiting chances of an upward move during the upcoming sessions.
Support levels: 1.4510 1.4470 1.4425
Resistance levels: 1.4665 1.4610 1.4650
USD/JPY
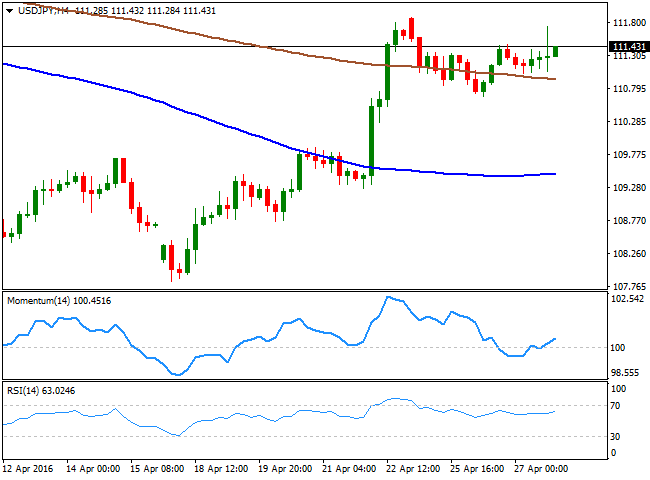
The USD/JPY pair trades modestly higher after the FED, still contained within a tight range as the Bank of Japan will announce its latest economic policy decision during the upcoming Asian session. The pair has spiked up to 111.74, a few pips below the key resistance at 111.90, this week high. The BOJ is largely expected to maintain rates and facilities unchanged, as earlier this week, rumors made the rounds over some action coming next June. In the meantime, the short term picture for the pair is neutral, given the tight intraday range, but with the upside favored amid improved market sentiment after the US Central Bank dropped concerns over worldwide economic developments. In the 4 hours chart, the price has advanced some above a still bearish 200 SMA, whilst the technical indicators aim higher above their midlines, supporting some additional gains for the upcoming hours. Still, the pair needs to advance beyond the mentioned high at 111.90 to confirm an upward continuation for this Thursday.
Support levels: 110.90 110.65 110.30
Resistance levels: 111.90 112.30 112.80
GOLD
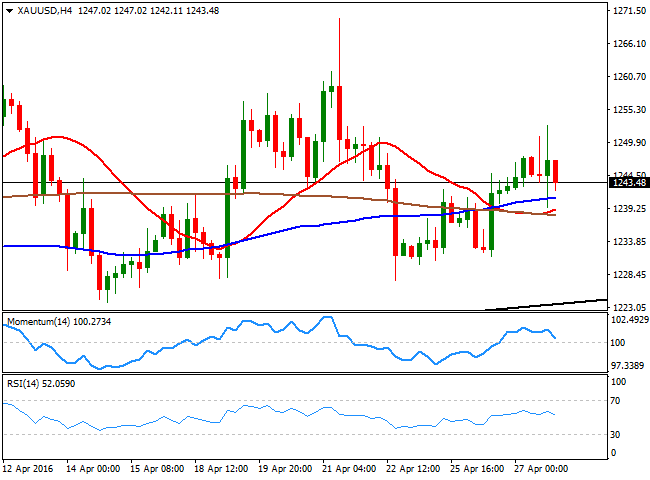
Gold prices advanced heading into the Fed’ decision, with spot reaching a fresh weekly high of $1,252.71 a troy ounce before turning south after the announcement to finally close pretty much flat around 1,243.90.The early rally in the commodity was supported by a softer greenback, whilst the late decline is being blamed on risk appetite, as speculation that the US Central Bank will remain onhold for longer, is fueling demand for stocks. The base metal maintains therefore, the neutral stance seen on previous updates, and in the daily chart, the price is standing barely above its 20 SMA, whilst the technical indicators head slightly lower around their midlines, lacking clear directional conviction. In the shorter term, the 4 hours chart shows that the technical indicators have turned lower, but remain above their midlines, whilst the price is above its moving averages that anyway remain all together in a tight range right below the current level, a clear indication of the ongoing absence of trend.
Support levels: 1,236.30 1,222.30 1,214.80
Resistance levels: 1,252.70 1,262.60 1,271.80
WTI CRUDE
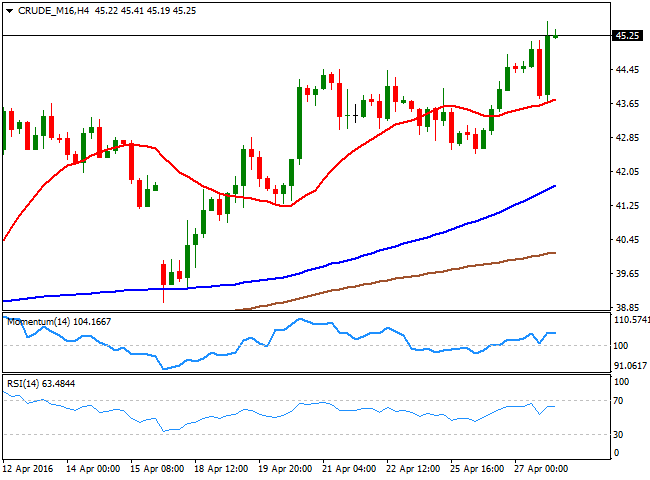
US crude oil settled at a fresh 2016 high on news that output slipped to 8.94 million barrels a day, the least since October 2014. WTI futures surged to $45.59 a barrel on Wednesday, to finally settled around 45.30. Late Tuesday, the American Petroleum Institute reported an inventory draw of 1.1M barrels in the past week, pushing crude higher at the beginning of the day. The EIA report, on the contrary, reported an increase of almost 2M for the week ended April 22nd, but beyond the headline and the initial downward reaction, market cheered the decrease in production and sent the price back higher. Technically, the daily chart shows that the Momentum indicator has recovered its bullish slope within positive territory, whilst the RSI indicator aims higher around 66 and the price advances further above its moving averages, all of which supports further gains ahead. In the 4 hours chart, the intraday decline met buying interest around a bullish 20 SMA, currently around 43.75, while the technical indicators hold within positive territory, with no clear directional strength.
Support levels: 44.60 43.75 43.20
Resistance levels: 45.80 46.40 47.10
DAX
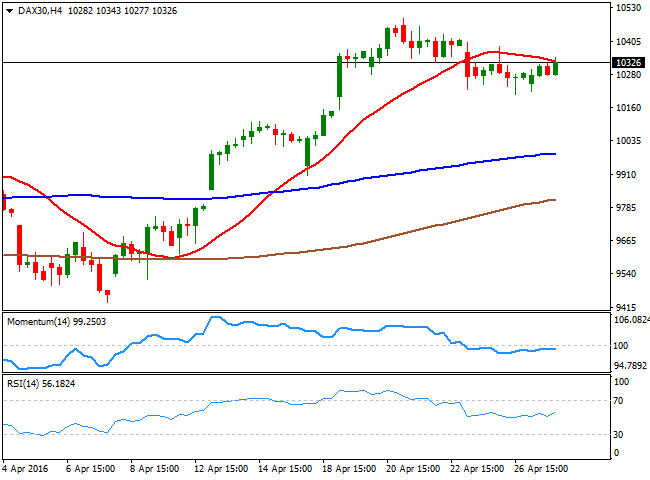
European equities closed slightly higher, as investors remained cautious ahead of the US Central Bank announcement, with the German DAX adding 40 points or 0.39% to close at 10,299.83, after Adidas reported a 38% rise in net income while increasing its 2016 financial outlook. The company closed up roughly 6.0%. Technically, the daily chart shows that the index is still near its 200 DMA and below the monthly high, unable to confirm a more sustainable rally in term. The indicators in the mentioned time frame, however, present clear upward slopes near overbought territory, confirming bulls are dominating the benchmark. In the 4 hours chart, however, the index is unable to advance above a mild bearish 20 SMA, now a few points above the current 10,326 level, whilst the technical indicators lack directional strength within neutral territory, suggesting some gains beyond 10,385 are required to confirm a new leg north.
Support levels: 10,264 10,201 10,151
Resistance levels: 10,385 10,430 10,491
DOW JONES
US stocks posted modest gains on Wednesday after the Federal Reserve left interest rates unchanged and removed from their statement, references to the global and financial developments posing risks to domestic outlook. Even though the Fed sounded slightly hawkish, it gave no clear signs of an imminent rate hike at next meeting, fueling risk appetite by the end of the day. The Dow Jones Industrial Average rose 51 points, or 0.28%, to 18,041.55. The SandP 500 gained 3 points, or 0.16%, to 2,095.15. However, the Nasdaq lost 25 points, or 0.51%, to close at 4,863.14 as Apple Inc. equities plummeted after secondquarter earnings missed expectations. The DJIA surged to a weekly high of 18,084 before closing at the mentioned level, and the daily chart presents a modest bullish tone, as the index continues consolidating within last week´s range and above a mild bullish 20 SMA, whilst the technical indicators are slowly gaining upward strength, but continue to lack momentum. Shorter term, the 4 hours chart shows that the index advanced above a still flat 20 SMA, whilst the Momentum indicator heads sharply higher within positive territory, and the RSI turned flat around 58, favoring the upside, particularly on an advance beyond the mentioned daily high.
Support levels: 17,982 17,919 17,826
Resistance levels: 18,084 18,165 18,220

FTSE 100
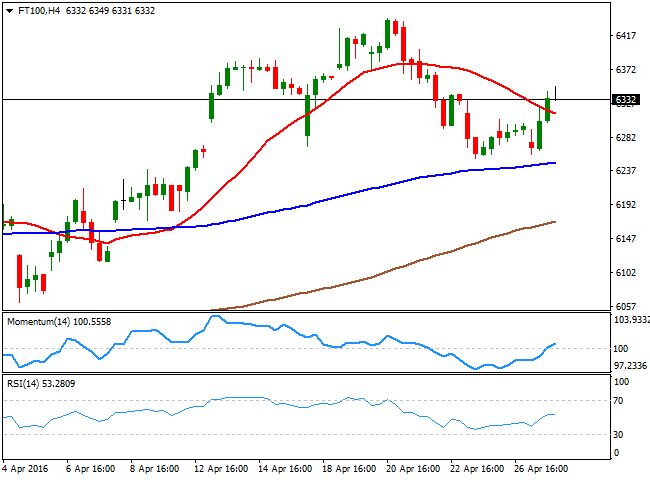
The FTSE 100 edged higher after a threeday decline, surging 0.56% or 35 points to end the day at 6,319.91, helped by crude oil that surged to fresh 2016 highs. The Footsie failed to rally further as earnings reports continued to dent markets' sentiment, after Barclay reported a 25% drop in pretax profits to £ 793M in the first three months of the year. Mining shares underperformed, as commodities, particularly metals, traded generally lower during the first half of the day. Now trading a few points above the mentioned close, the daily chart shows that the index bounced from a bullish 20 SMA, whilst the technical indicators have turned slightly higher, but lack enough strength to confirm a continued advance for the upcoming sessions. In the 4 hours chart, the index is currently above a bearish 20 SMA, while the technical indicators have lost upward momentum after crossing their midlines towards the upside, suggesting a limited upward potential at the time being.
Support levels: 6,305 6,266 6,206
Resistance levels: 6,368 6,440 6,496
The information set forth herein was obtained from sources which we believe to be reliable, but its accuracy cannot be guaranteed. It is not intended to be an offer, or the solicitation of any offer, to buy or sell the products or instruments referred herein. Any person placing reliance on this commentary to undertake trading does so entirely at their own risk.
Recommended Content
Editors’ Picks
EUR/USD retreats toward 1.0650 after PMI-inspired rebound

EUR/USD loses traction and retreats to the 1.0650 area after rising toward 1.0700 with the immediate reaction to the upbeat PMI reports from the Eurozone and Germany. The cautious market stance helps the USD hold its ground ahead of US PMI data.
GBP/USD fluctuates near 1.2350 after UK PMIs

GBP/USD clings to small daily gains near 1.2350 in the European session on Tuesday. The data from the UK showed that the private sector continued to grow at an accelerating pace in April, helping Pound Sterling stay resilient against its rivals.
Gold price flirts with $2,300 amid receding safe-haven demand, reduced Fed rate cut bets

Gold price (XAU/USD) remains under heavy selling pressure for the second straight day on Tuesday and languishes near its lowest level in over two weeks, around the $2,300 mark heading into the European session.
Here’s why Ondo price hit new ATH amid bearish market outlook Premium

Ondo price shows no signs of slowing down after setting up an all-time high (ATH) at $1.05 on March 31. This development is likely to be followed by a correction and ATH but not necessarily in that order.
US S&P Global PMIs Preview: Economic expansion set to keep momentum in April

S&P Global Manufacturing PMI and Services PMI are both expected to come in at 52 in April’s flash estimate, highlighting an ongoing expansion in the private sector’s economic activity.