![]() HY Markets Research Team
HY Markets Research Team
HY Markets
EUR/USD
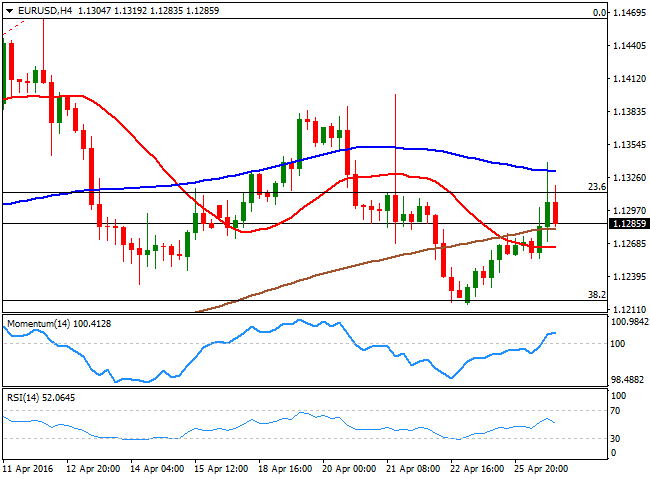
Major currencies' pairs have been mostly stable in Asia, partially ahead of the upcoming Central Bank's events and partially due to an empty macroeconomic calendar. London opening brought some USD selling interest, with the American currency weakening against most of its major rivals, and accelerating its decline after the release of March US Durable Goods orders, which rose 0.8% compared to February, less than expected as demand for capital equipment remained weak. The core reading fell by 0.2% in the same period, indicating the economy is still struggling to recover. Also, Consumer confidence fell 1.9 points in April, down to 94.2, while the Markit services PMI rose to 52.1, missing expectations of 52.3.The EUR/USD pair advanced up to 1.1339 before turning south to trim most of its daily gains, and closed the day in the 1.1280 region, as investors are not willing to risk much ahead of the FOMC decision. The US Central Bank is expected to remain maintain the statusquo, with focus then on the wording of the statement. Should the FED announce that it sees the risks to the outlook for both economic activity and the labour market as “balanced” or "nearly balanced," it will be understood as a sign that the FED is one step closer to raise rates and therefore give the greenback some support. The 4 hours chart posts a mild positive tone, yet the upcoming direction will solely depend on how the market reacts to the FED. The mentioned daily high is the immediate resistance, followed by the 1.1380/90 region, where the pair presents multiple daily highs from these past months. Gains beyond this last should lead to a test of the critical 1.1460 region, whilst beyond this last, the rally can extend up to 1.1500 in the short term, but leave then doors opened for a rally up to 1.1713, August 2015 monthly high. The immediate short term support comes at 1.1270, followed by the mentioned 1.1220 Fibonacci level. It seems unlikely that the pair can break below this last, unless the FED makes it clear that it will actually raise rates in June, with the next bearish target then at 1.1160.
Support levels: 1.1270 1.1230 1.1200
Resistance levels: 1.1315 1.1340 1.1385
GBP/USD
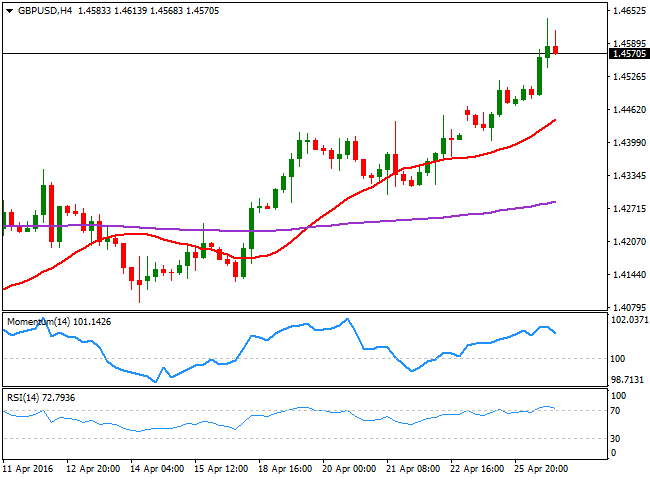
The GBP/USD pair advanced to a fresh 2month high of 1.4637 this Tuesday, with the Pound still being the best performer across the board. The pair caught a bid early Europe, despite slight downbeat UK money data, showing that mortgage approvals were 20% higher from a year ago, but down to 45.01K from previous 45.65K, the lowest since December. Dollar's recovery during US trading hours have helped the pair to correct lower, but it holds on to gains daily basis, now finding some short term buying interest in the 1.4560/70 region, where the pair has stalled its advance early February. Technically, the 4 hours chart shows that the price remains far above a bullish 20 SMA, but also that the technical indicators have turned slightly lower within overbought territory, suggesting some consolidation ahead of the next directional move. Nevertheless, is clear that bulls are in control of the pair, and things will remain that way as long as the price holds above the 1.4520 region, a strong static support.
Support levels: 1.4550 1.4520 1.4470
Resistance levels: 1.4610 1.4660 1.4700
USD/JPY
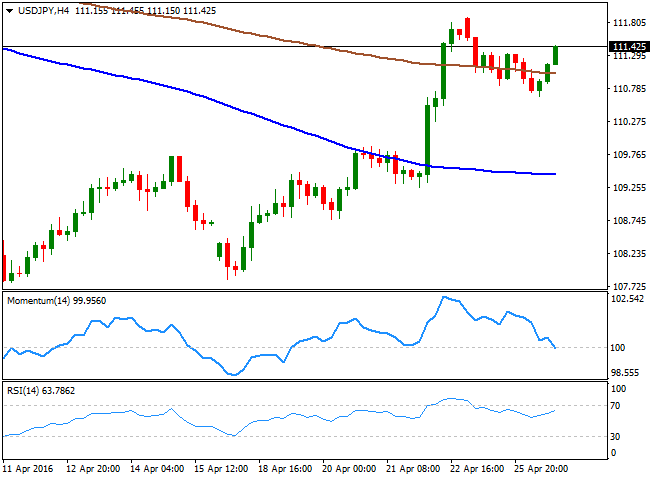
The USD/JPY pair started the day with a negative bias, falling down to 110.66 a major static support. Buying interest, however surged around the critical level, despite US disappointing data, and sent the pair back higher ahead of Wall Street's close as investors are pricing in a generally hawkish FED and an on hold BOJ. Now trading around 111.40, the 1 hour chart shows that the pair has held well above a bullish 100 SMA, currently approaching the mentioned support, whilst the technical indicators consolidate well above their midlines, lacking clear directional strength, but suggesting the downward potential will remain limited. In the 4 hours chart, the price has kept struggling around a mild bearish 200 SMA, unable to clearly detach from it, whilst the Momentum indicator diverges from price action, heading south below its 100 level, and the RSI goes nowhere around 63. The pair will likely remain range bound ahead of the US Central Bank decision, limited below 111.90, this week high, and the mentioned 110.66 level. Should the FED signal a more confident stance over the economic situation, the pair can break higher, and extend its rally up to 113.79, Mach 29th high during the following sessions.
Support levels: 111.00 110.65 110.30
Resistance levels: 111.90 112.30 112.80
GOLD
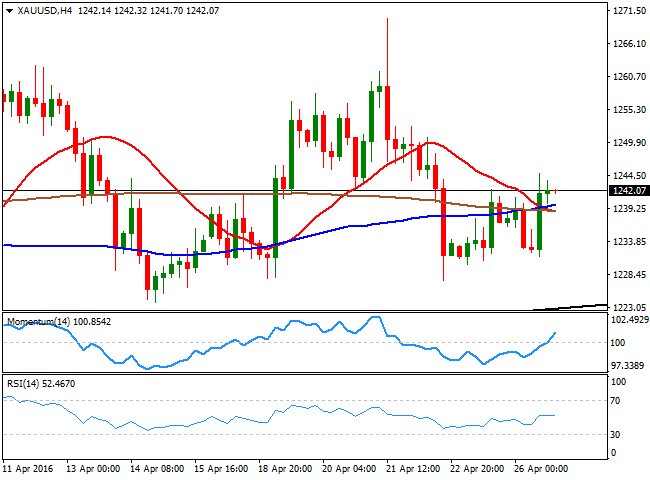
Gold prices recovered some further ground this Tuesday, with spot surpassing by a few cents Monday's high and ending the day around $1,242.00 a troy ounce. The commodity has been unable to attract speculative interest so far this week, as investors remain sidelined ahead of the upcoming US FED's decision this Wednesday, as gold has been largely correlated with the Central Bank's announcements. Trading within Friday's range ever since the week started, the daily chart maintains the neutral stance seen on previous updates, with the price still moving back and forth around a horizontal 20 SMA, and the technical indicators lacking directional strength within neutral territory. In the 4 hours chart, a slightly positive tone prevails given that the Momentum indicator heads north above its 100 level, whilst the RSI consolidates around 52. In this last time frame, the price is above its moving averages, but all of them are quite close and within a $5 range, a clear sign of the ongoing lack of directional strength.
Support levels: 1,236.30 1,222.30 1,214.80
Resistance levels: 1,242.80 1,251.70 1,262.60
WTI CRUDE
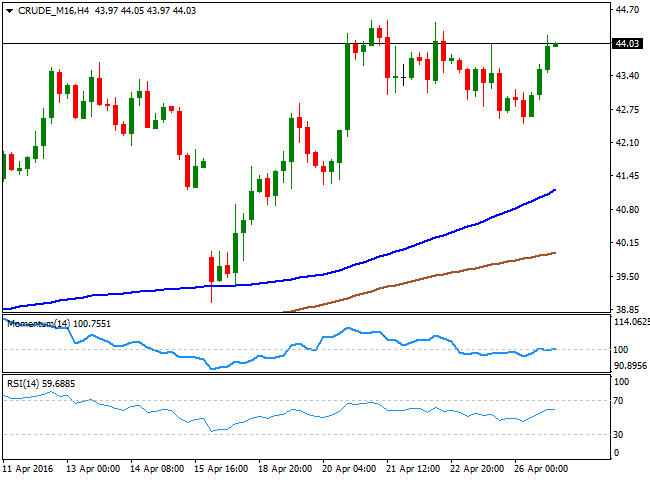
Crude oil gained more than 3% on Tuesday amid a weaker US dollar, while investors await API inventories data later on the day ahead of the US Government oil stockpiles report due on Thursday. West Texas Intermediate crude for June delivery rose $1.40, or 3.3%, to settle at $44.04 a barrel on NYMEX, marking the highest settlement so far this year. The daily chart for the commodity shows that the price is close to the yearly highs posted earlier this month at $44.47, and that remains well above its 100 and 200 SMAs, with the shortest slowly turning higher, but still far from signaling a steeper recovery in prices. In the mentioned time frame, the Momentum indicator continues heading south towards its 100 level, but the RSI resumed its advance and heads north around 62, limiting the downside. In the 4 hours chart, the technical stance is bullish, as the price is well above its moving averages that maintain strong bullish slopes, whilst the RSI indicator hovers around 59.
Support levels: 43.40 42.60 41.90
Resistance levels: 44.50 45.10 45.80
DAX
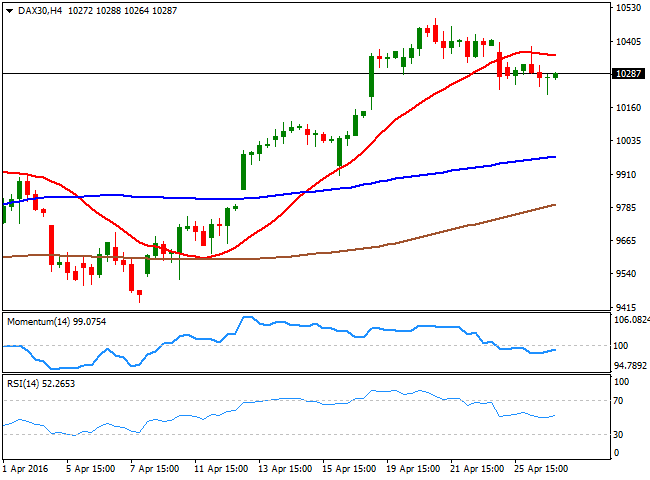
European equities closed the day mixed, with the German DAX down by 0.34%, to end the day at 10,259.59, as the main focus across the region was on earnings reports, although most of them coming from non German companies, the main reason of the lack of action across the benchmark. Overall, banks outperformed fellow sectors after the Standard Chartered ground reported a pretax profit of $589 million. The index has retreated further from its recent yearly high, and the daily chart shows that it stands a few points above its 200 SMA, but also that the benchmark has posted a lower low and a lower high, whilst the technical indicators are currently retreating from oversold levels, indicating an increasing downward potential. In the 4 hours chart, the index is below a horizontal 20 SMA, whilst the technical indicators have lost their downward strength, but remain within negative territory, indicating that further technical confirmations are required to see a bearish extension this Wednesday.
Support levels: 10,264 10,201 10,151
Resistance levels: 10,320 10,385 10,430
DOW JONES
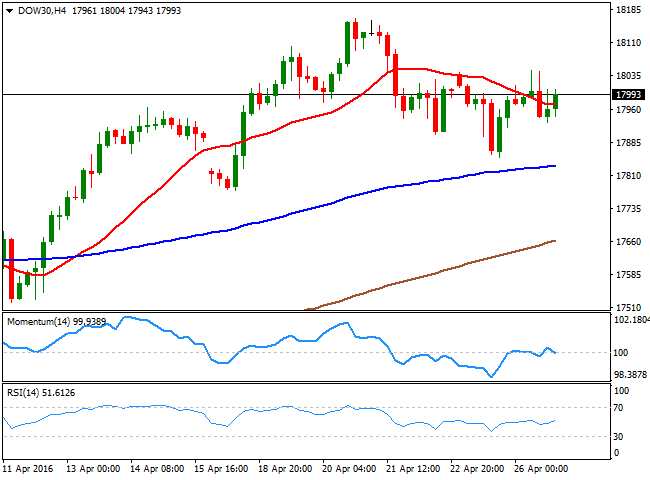
Worldwide stocks had a lackluster Tuesday, closing mixed, but not far from their daily openings, as uncertainty ruled ahead of three Central Bank's announcements in less than 12 hours between Wednesday's US afternoon and Thursday's Asian morning. The FED the RBNZ and the BOJ will announce its latest economic policy decisions, and market definitions will likely wait until the last in done. The DJIA added 13 points to close at 17,990.32, the Nasdaq lost 0.15% and ended at 4,888.31, while the S and P advanced 4 points to 2,091.70. The DJIA daily chart shows that the index closed practically with a doji, having, however, extended its weekly advance up to 18,048 intraday. The technical picture is neutral, as the indicators stand flat, but within positive territory, whilst the benchmark holds well above a slightly bullish 20 SMA, all of which maintains the risk towards the upside. In the 4 hours chart, the index lacks clear definitions, as it has been all day hovering around a mild bearish 20 SMA, whilst the technical indicators diverge from each other within neutral territory, reflecting the ongoing uncertainty among investors.
Support levels: 17,919 17,826 17,748
Resistance levels: 18,048 18,094 18,165
FTSE 100
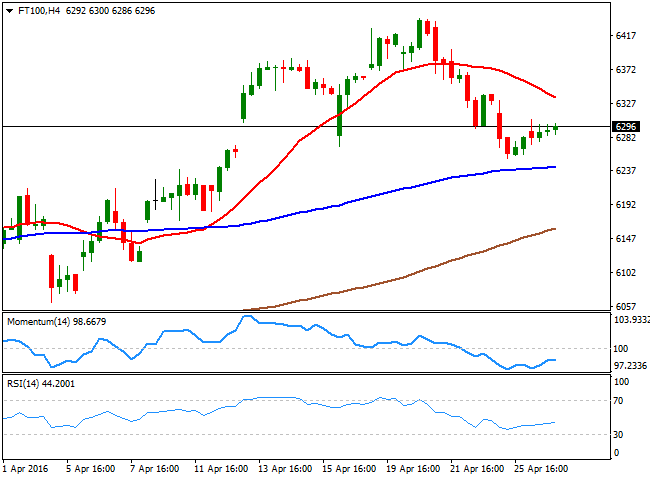
The Footsie added 23 points by the end of the day, closing at 6284.52. Standard Chartered was the biggest winner, adding 9.6% after reporting better than expected results for the first quarter of this year. Oil major BP reported a pretax loss of $865 million during the same period, as low oil prices continue to affect the company. Shares, however, jumped 4.3% as results beat expectations. The FTSE 100 remained confined to a tight range above Monday's low, and in the daily chart shows that the 20 SMA once again provided an intraday support, now around 6,266. In the same chart, however, the technical indicators continued to grind lower within positive territory, indicating diminishing buying interest at current levels. In the 4 hours chart, the technical bias favors the downside, given that the 20 SMA has accelerated its decline above the current level, whilst the technical indicators have barely bounced from oversold readings, before losing upward strength well below their midlines.
Support levels: 6,266 6,206 6,152
Resistance levels: 6,331 6,368 6,440
The information set forth herein was obtained from sources which we believe to be reliable, but its accuracy cannot be guaranteed. It is not intended to be an offer, or the solicitation of any offer, to buy or sell the products or instruments referred herein. Any person placing reliance on this commentary to undertake trading does so entirely at their own risk.
Recommended Content
Editors’ Picks
AUD/USD hovers around 0.6500 amid light trading, ahead of US GDP

AUD/USD is trading close to 0.6500 in Asian trading on Thursday, lacking a clear directional impetus amid an Anzac Day holiday in Australia. Meanwhile, traders stay cautious due ti risk-aversion and ahead of the key US Q1 GDP release.
USD/JPY finds its highest bids since 1990, near 155.50

USD/JPY keeps breaking into its highest chart territory since June of 1990 early Thursday, testing 155.50 for the first time in 34 years as the Japanese Yen remains vulnerable, despite looming Japanese intervention risks. Focus shifts to Thursday's US GDP report and the BoJ decision on Friday.
Gold price lacks firm intraday direction, holds steady above $2,300 ahead of US data

Gold price remains confined in a narrow band for the second straight day on Thursday. Reduced Fed rate cut bets and a positive risk tone cap the upside for the commodity. Traders now await key US macro data before positioning for the near-term trajectory.
Injective price weakness persists despite over 5.9 million INJ tokens burned
Injective price is trading with a bearish bias, stuck in the lower section of the market range. The bearish outlook abounds despite the network's deflationary efforts to pump the price. Coupled with broader market gloom, INJ token’s doomed days may not be over yet.
Meta Platforms Earnings: META sinks 10% on lower Q2 revenue guidance Premium

This must be "opposites" week. While Doppelganger Tesla rode horrible misses on Tuesday to a double-digit rally, Meta Platforms produced impressive beats above Wall Street consensus after the close on Wednesday, only to watch the share price collapse by nearly 10%.