EUR/USD
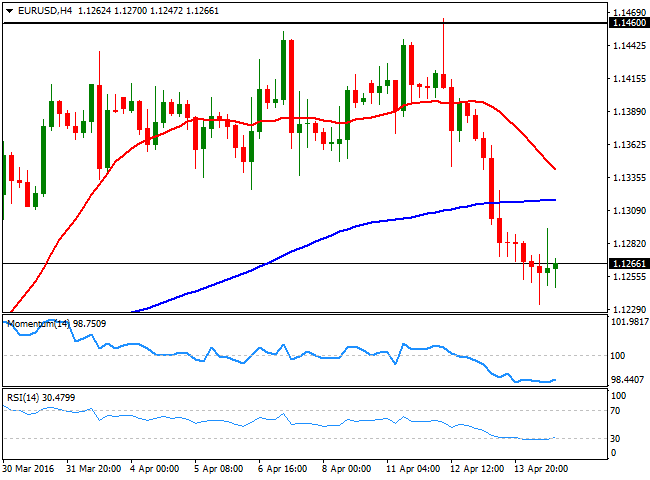
The greenback maintained its positive tone particularly against its European rivals, although the strong momentum of the currency seen on Wednesday receded. Asian share markets edged higher, but concerns over global growth returned after Singapore cut interest rates by surprise as growth stalled, leading to a poor performance in European and American indexes. In Europe, attention focused in the final EU CPI for March, with the headline figure revised a notch higher to 0.0% year on year, the monthly reading unchanged at 1.2%, and core inflation left un revised at 1.0%. In the US, weekly unemployment claims fell to its lowest since 1978, printing 258K in the week ended April 8th, but inflation rose less than expected in March, up by 0.1% monthly basis and by 0.9% compared to a year before. Soft inflation readings will keep the FED on hold for longer, when it comes to raising rates.The EUR/USD pair fell to a fresh 2week low of 1.1233 early Europe, with the following bounce failing to extend beyond the 1.1300 level. The pair has been consolidating in a tight range for most of the American session, and holds around 1.1260. Technically, the 4 hours chart shows that the 20 SMA has accelerated its decline and now stands around 1.1340, whilst the technical indicators lack directional strength within oversold levels, far from supporting some additional gains for this Friday. Nevertheless, the pair needs to actually break below the 1.1200 to accelerate its decline, with scope now to extend down to 1.1120, a major static support zone.
Support levels: 1.1235 1.1200 1.1160
Resistance levels: 1.1280 1.1330 1.1380
GBP/USD
The GBP/USD pair closed in the red for a second day inarow, although the pair trimmed most of its daily losses ahead of the close. Nevertheless, Pound´s negative tone prevails, and the BOE did little for the local currency. The Bank of England had its monthly meeting, in where it left its monetary policy unchanged, as widely expected. The bank rate was maintained at record lows of 0.5% and the size of the Asset Purchase Facility was kept at £375bn, with all of the nine MPC members voting for this. The Minutes showed that policy makers are concerned over the Brexit referendum, as is possible that “referendum related uncertainty would have a more pronounced effect on household sentiment and behavior as the vote drew nearer.” From a technical point of view, the intraday recovery was not enough to revert the negative tone of the pair, given that in the 4 hours chart, the price remains well below its 20 SMA and 200 EMA, while the Momentum indicator keeps heading lower within negative territory. In the same chart, the RSI indicator has partially recovered, but remains around 46. The pair can gather some additional upward momentum if the recovery extends beyond 1.4240, while a decline below 1.4090 exposes the pair to test the 1.4000 critical figure.
Support levels: 1.4130 1.4090 1.4050
Resistance levels: 1..4185 1.4240 1.4285
USD/JPY
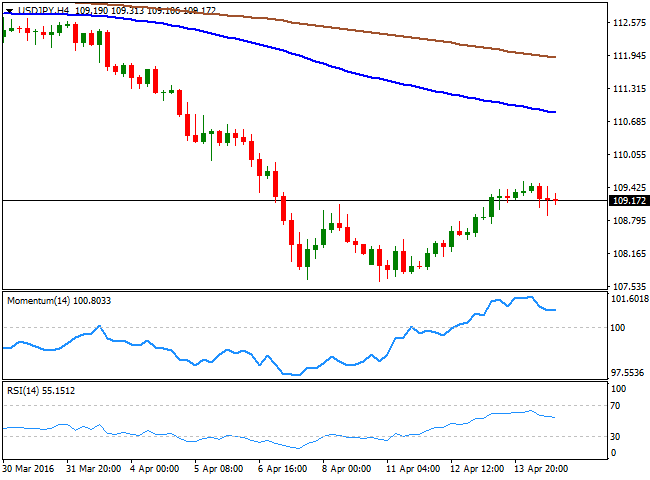
The USD/JPY pair traded uneventfully this Thursday, briefly falling below the 109.00 level in the American afternoon, but it bounced back to the current 109.20 region, where it stood for most of the day. Poor US inflation data was behind that short lived slide, but given the lack of reaction in stocks markets, the pair was unable to catch a firmer directional tone. The weekly recovery extended up to 109.54 during the past Asian session, as the JPY traded inversely to local share market, and the Nikkei was the largest daily winner among worldwide indexes. Anyway, and technically speaking the long term outlook for the pair is still bearish, as it will take at least a recovery above the 110.60 region to confirm an interim bottom took place in the 107.60 lows posted this month. Short term, the 1 hour chart presents a neutral tone, as the technical indicators head higher right below their midlines, but the price remains stuck around a bearish 200 SMA. In the 4 hours chart, the technical indicators head higher within positive territory and after correcting overbought readings. Still, the 100 and 200 SMA head lower far above the current level, indicating advances will continue to be corrective.
Support levels: 108.90 108.40 107.95
Resistance levels: 109.50 110.00 110.45
GOLD
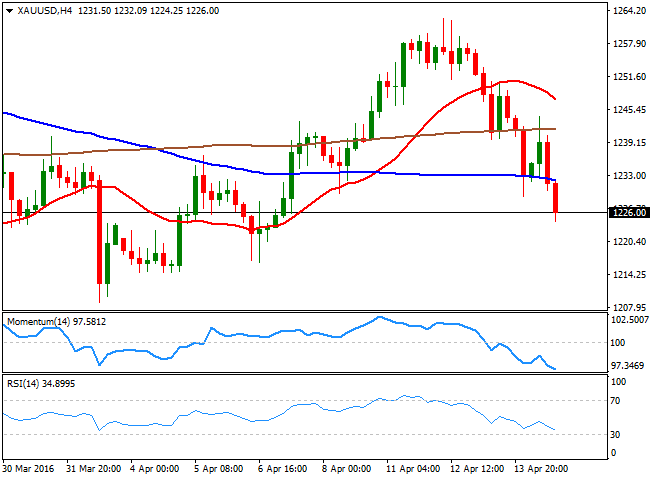
Gold prices turned south this Thursday as the dollar extended its latest gains. Spot gold fell down to $1,224.25 a troy ounce and trades around $1,225.90 by the end of the US session. The bright metal reached a 3week high of 1,262.62 this Tuesday, from where it started to retreat to enter negative territory weekly basis, as an increase in risk appetite led investors to trim positions in low yielding assets. Holding near its daily low, the daily chart shows that the commodity ended the day below its 20 SMA, whilst the technical indicators turned sharply lower and entered negative territory, indicating an increasing bearish potential. In the shorter term, and according to the 4 hours chart, the technical indicators have partially lost bearish strength near oversold levels, but by no means suggest an upward upcoming move, whilst the price has fallen below all of its moving averages, also implying a downward continuation for this Friday.
Support levels: 1,223.05 1,214.60 1,206.40
Resistance levels: 1,229.70 1,240.60 1,250.50
WTI CRUDE
Crude oil prices retained the negative tone during the past Asian session, weighed by the large increase in US stockpiles. US West Texas Intermediate futures fell to $40.82, but bounced back during London trading hours, only to resume its decline in the US session, to end the day a few cents above $41.00 a barrel. Hopes that the Doha meeting next Sunday to freeze oil output, will come to fruition have diminished somehow, and still any probable effect it has on the commodity will likely be short lived, as long as the imbalance between supply and demand persists. Technically, the daily chart shows that, despite turning lower, the price is still well above its 200 DMA, currently in the 38.90 region. In the same chart, the Momentum indicator heads north above its 100 level, while the RSI indicator retreated partially from near overbought level, and heads south around 63. In the 4 hours chart, the price is currently pressuring a bullish 20 SMA, while the Momentum indicator turned sharply lower and is about to cross its 100 level towards the downside, indicating a continued decline, particularly on a break below 40.80 the immediate support.
Support levels: 40.80 40.20 39.60
Resistance levels: 42.30 42.90 43.60
DAX
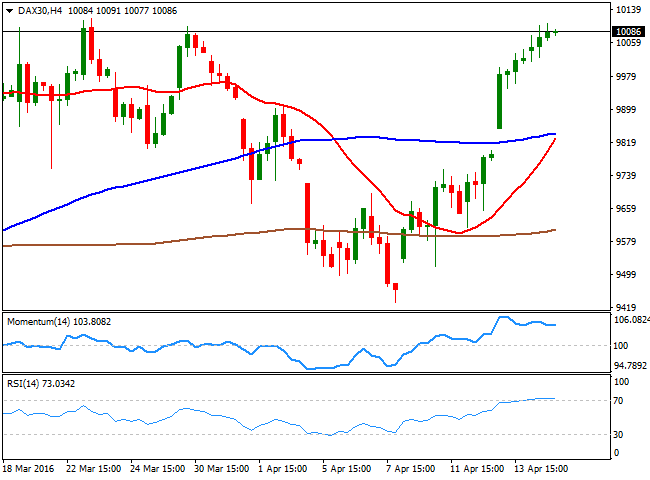
European equities managed to post some modest gains this Thursday, with the German DAX up 0.67% or 68 points, to end the day at 10,093.65, as the retreat in oil prices sent investors to the sidelines, ahead of the Doha meeting this Sunday. The index holds on to gains ahead of the Asian opening, barely below Jan 13th high of 10,108 a major static resistance level, given that the index has retreated on approaches to it multiple times during last March. Daily basis, the index is above its 100 DMA for the first time since January 4th, whilst the technical indicators have crossed above their midlines, but without enough momentum to confirm additional gains. In the 4 hours chart, the technical indicators have turned horizontal within overbought territory, whilst the 20 SMA heads sharply higher below the current level, and is above to cross the 100 SMA. Should the rally extend beyond the mentioned 10,108 level, the upward momentum will look firmer, with scope then to advance up to 10,522, this year high.
Support levels: 10,042 9,996 9,918
Resistance levels: 10,108 10,171 10,250
DOW JONES
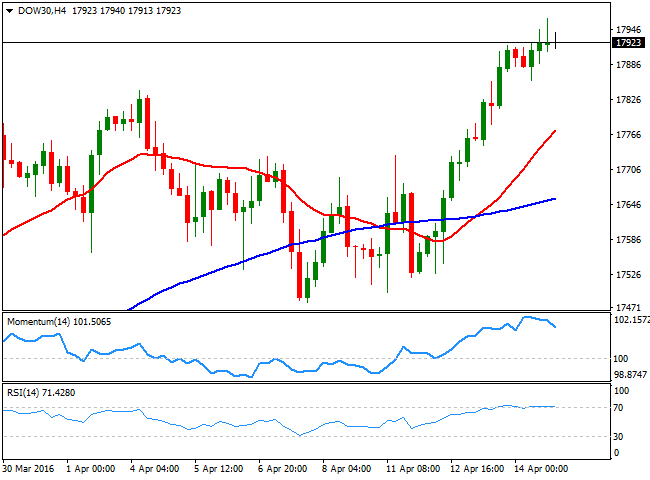
US stocks erased early gains and finished Thursday little changed as disappointing earnings reports from the banking sector weighed on sentiment. The Dow Jones Industrial Average rose 18.15 points, or 0.10%, to finish at 17,926.43. The S and P 500 advanced only marginally by less than a point, or 0.02% to close at 2,082.78. The Nasdaq lost 1.53 points, or 0.03%, to close at 4,945.89. Investors looked past a mixed bag of US data, which showed consumer inflation in the twelve months to March rose by only 0.9%, while initial jobless claims dropped to a 43year low of 253K in the week ended Apr 8. Trading at fresh year to date highs, the DJIA daily chart shows that the index recovered above its 20 SMA, but that the technical indicators lack upward strength, having turned flat within positive territory. In the 4 hours chart, the Momentum indicator has turned lower within extreme overbought levels, whilst the RSI remains flat around 71 and the index develops far above a bullish 20 SMA, all of which maintains the risk towards the downside, and supports an advance beyond the 18,000 figure for early next week.
Support levels: 17,874 17,814 17,723
Resistance levels: 17,974 18,045 18,105
FTSE 100
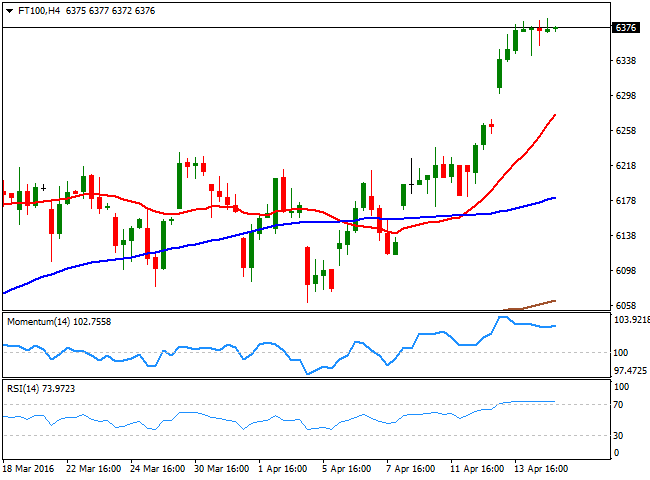
The FTSE 100 advanced 2 points or 0.03% to close at 6,365.10, holding within this year high, but unable to extend beyond it. The benchmark trimmed early losses after the BOE decided to maintain its economic policy unchanged, in line with market's expectations. But the upside remained limited on renewed concerns over the effects of a possible Brexit over the local economy. The commodity related block edged lower as oil's prices retreated, with Anglo American down by 2.7% and Rand gold shedding 3.03%. The daily chart shows that the index remained above its moving averages, but also that the technical indicators have lost bullish strength within positive territory, rather reflecting the latest consolidation than suggesting an upcoming downward move. In the 4 hours chart, the technical picture is quite similar, with the Momentum indicator horizontal within positive territory and the RSI consolidating at 72, with no signs of turning lower any time soon.
Support levels: 6,346 6,301 6,243
Resistance levels: 6,390 6,447 6,488
The information set forth herein was obtained from sources which we believe to be reliable, but its accuracy cannot be guaranteed. It is not intended to be an offer, or the solicitation of any offer, to buy or sell the products or instruments referred herein. Any person placing reliance on this commentary to undertake trading does so entirely at their own risk.
Recommended Content
Editors’ Picks
AUD/USD rises to two-day high ahead of Aussie CPI

The Aussie Dollar recorded back-to-back positive days against the US Dollar and climbed more than 0.59% on Tuesday, as the US April S&P PMIs were weaker than expected. That spurred speculations that the Federal Reserve could put rate cuts back on the table. The AUD/USD trades at 0.6488 as Wednesday’s Asian session begins.
EUR/USD now refocuses on the 200-day SMA

EUR/USD extended its positive momentum and rose above the 1.0700 yardstick, driven by the intense PMI-led retracement in the US Dollar as well as a prevailing risk-friendly environment in the FX universe.
Gold price on the defensive, amid soft US Dollar

Gold retreats modestly after failing to sustain gains despite fall in US Treasury yields, weaker US Dollar. XAU/USD struggles to capitalize following release of weaker-than-expected S&P Global PMIs, fueling speculation about potential Fed rate cuts.
Ethereum continues hinting at rally following reduced long liquidations

Ethereum has continued showing signs of a potential rally on Tuesday as most coins in the crypto market are also posting gains. This comes amid speculation of a potential decline following FTX ETH sales and normalizing ETH risk reversals.
Australia CPI Preview: Inflation set to remain above target as hopes of early interest-rate cuts fade

An Australian inflation update takes the spotlight this week ahead of critical United States macroeconomic data. The Australian Bureau of Statistics will release two different inflation gauges on Wednesday.
