![]() HY Markets Research Team
HY Markets Research Team
HY Markets
EUR/USD
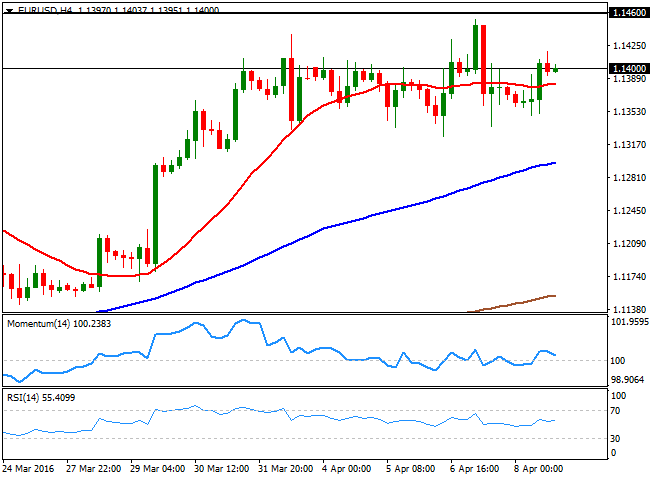
Choppy trading has prevailed in the EUR/USD pair this past week, although the weak tone of the greenback maintains the pair near a fresh year high set at 1.1453. While plenty of data, including the minutes of both Central Banks, were released during these last few days, markets were subject of risk related sentiment trading. Sentiment is expected to continue leading the FX board during the upcoming days, but there are a couple of US macroeconomic releases that can determinate dollar's fate, those are March inflation and Retail Sales. The first is expected to have surged partly due to higher gasoline prices, whilst the second will likely disappoint, by showing a modest rise, in line with the previous months readings.The EUR/USD pair closed the week flat at 1.1400, and from a technical point of view, further gains in the pair will depend on a clear break above the 1.1460 price zone, as with just one short lived exception, strong selling interest has contained price's advances around it since January 2015. Should the price extend beyond it, it would likely trigger stops and result in a strong rally up to 1.1714, 2015 yearly high. Daily basis, the bias is higher, as the technical indicators keep heading north within positive territory, whilst the 20 DMA maintains a strong bullish slope below the current level. Furthermore, the 100 DMA has extended its rally and is about to cross above the 200 DMA, something that should support a longer term advance. Shorter term, and due to this past week limited range, the pair maintains a neutral stance, with intraday buying interest aligned around 1.1330.
Support levels: 1.1330 1.1280 1.1245
Resistance levels: 1.1420 1.1460 1.1500
GBP/USD
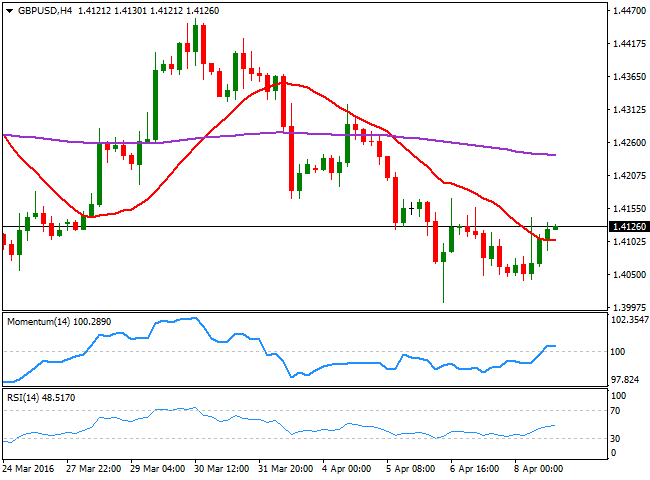
The GBP/USD pair edged higher on Friday, but closed the week in the red, with the Pound being weighed by poor UK data and continued fears over a Brexit. Production in the manufacturing sector fell by 1.1% in February, well beyond market's expectations, whilst industrial production fell by 0.3% monthly basis, also missing forecast. The offered tone in the greenback, however, alongside with an uptick in the UK's NIESR GDP Estimate up to 0.3% for March against February’s 0.2% advance, were behind Friday's gains in the pair. The recovery was not enough to confirm an interim bottom, as it will take a solid recovery beyond the 1.4500 figure to suggest a stepper recovery, something quite unlikely before the UK referendum, scheduled for late June. In the daily chart, the technical indicators have recovered partially from negative territory, but is still not enough to confirm additional gains for this Monday, as the price is developing well below its 20 DMA around 1.4250. In the shorter term, the 4 hours chart presents a limited upward potential, as the price is currently a handful of pips above a mild bearish 20 SMA, whilst the technical indicators have turned flat after entering positive territory, lacking directional strength.
Support levels: 1.4090 1.4050 1.4005
Resistance levels: 1.4145 1.4185 1.4250
USD/JPY
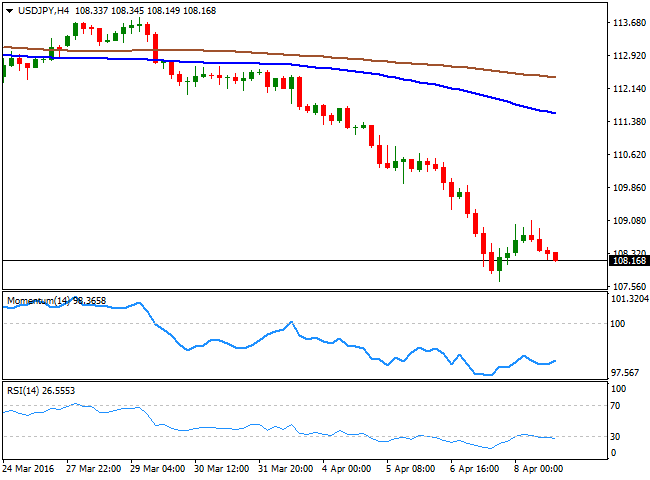
The Japanese yen retreated early Friday, partially due to a recovery in oil and stocks, which diminished risk aversion and pushed investors away from the safe haven asset, but also after Japanese Finance Minister Taro Aso warned about the rapid appreciation of the currency being undesirable, a clear sign that the government is getting ready to intervene, should the rally in the JPY continues. On the data front, Japan’s current account surplus rose by 2.43 trillion yen (versus 2.3 trillion yen median forecast) from 520 billion yen in January. Anyway, the latest yen's strength will likely result in a lessimpressive surplus during the past two months, neutralizing the effect of the positive figure. The pair remains biased lower according to technical readings, given that in the daily chart, the price has extended further below its 100 and 200 DMAs that maintain strong bearish slopes, whilst the technical indicators continue heading lower, despite being in extreme oversold territory. In the 4 hours chart, the RSI indicator has turned back south within oversold territory after correcting extreme readings, whilst the Momentum indicator remains flat well below its 100 level, also supporting additional declines, particularly if the 108.00 level gives up.
Support levels: 108.00 107.65 107.30
Resistance levels: 108.45 108.90 109.35
GOLD
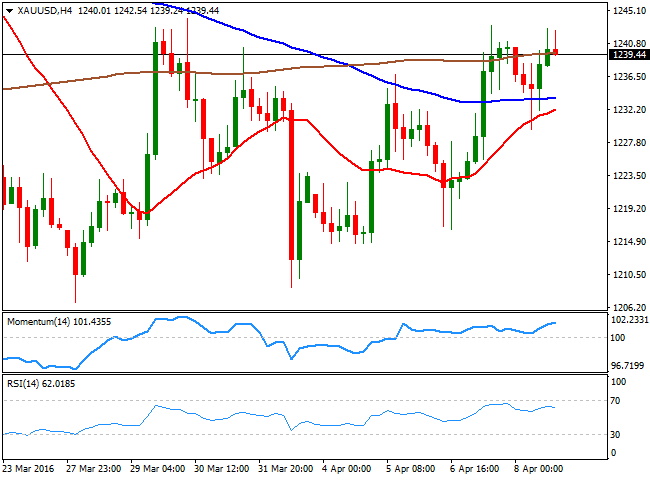
Gold prices closed flat on Friday, but sharply higher on the week, with spot ending around $1240.00 a troy ounce. The commodity recovered ground after the FOMC Minutes showed the US Central Bank is in no rush to raise rates, while weaker stocks prompted demand for the safehaven asset. Friday's improved market mood, sent the commodity lower at the beginning of the day, but it later trimmed daily losses and closed near the 2week high set at 1,244.05, now the immediate resistance. Despite trading barely $35.00 below its year high and the positive weekly close, the technical picture is still not confirming a steeper recovery, given that in the daily chart, the price has been moving back and forth around a horizontal 20 SMA for the past two days, while the technical indicators are unable to regain positive territory, now holding within neutral territory. In the 4 hours chart, the upward potential also seems limited, as the technical indicators have lost bullish strength within positive territory, whilst the price remains around a horizontal 200 SMA, with all of the moving averages lacking directional strength.
Support levels: 1,234.90 1,225.10 1,216.40
Resistance levels: 1,244.05 1,251.90 1,262.60
WTI CRUDE
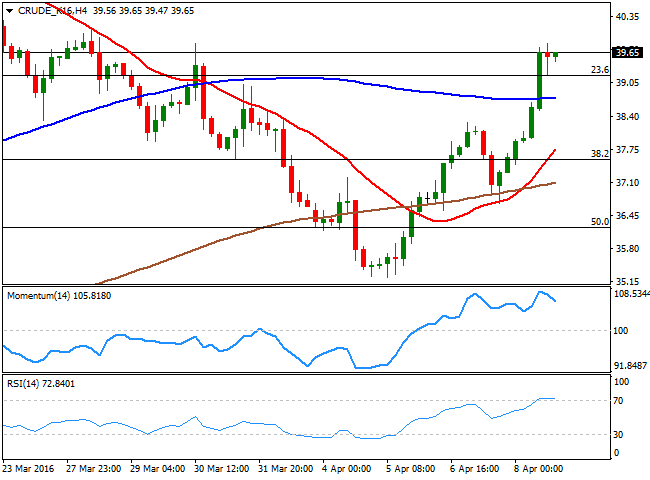
Crude oil prices rallied on Friday on mounting hopes the worldwide glut will start to recede sooner than expected, following a large drawdown in US stockpiles. Additionally, the US Baker Hughes report released on Friday showed that the country's rig count fell to 354 last week, the lowest since early November 2009. Light, sweet crude for May delivery gained over 6.5% a barrel on the New York Mercantile Exchange, to close the week at $39.65 a barrel, posting its largest weekly gain in over a month. Technically, the daily chart shows that the price stalled right at its 200 DMA, but above the 20 and 100 DMAs, whilst the technical indicators have reversed their negative tone and head sharply higher, but still below their midlines. In the 4 hours chart, the technical indicators are giving some signs of upward exhaustion but remain within overbought territory, while the price has extended well above a bullish 20 SMA, and also recovered above the 23.6% retracement of its latest bullish run, all of which suggests the black gold may continue advancing this week.
Support levels: 39.10 38.45 37.80
Resistance levels: 40.10 40.80 41.50
DAX
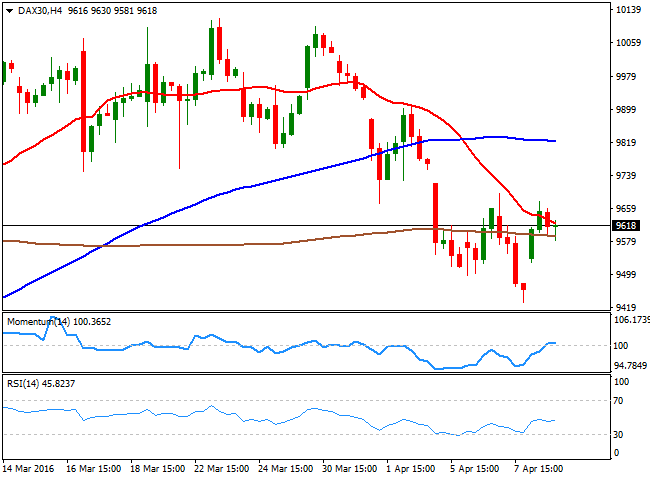
European equities edged higher on Friday, underpinned by a recovery in oil prices which boosted energy related shares. The German DAX added 92 points or 0.96% to close the week at 9,622.26, gaining steadily throughout the day before giving back some before the close. The index ended in the red weekly basis, retreating further below the 10,000 level, and maintaining an overall negative tone from a technical point of view. Daily basis, the benchmark developed well below its moving averages, with the 20 DMA being around 9,840 and the 10 and 200 DMAs well below this latest. In the same chart, the technical indicators have lost their bearish strength and turned higher, but are still well below their midlines, suggesting limited buying interest around current levels. In the 4 hours chart, the index is stuck around a bearish 20 SMA, whilst the technical indicators have erased oversold readings, but lost upward strength around their midlines, turning neutral, in line with the longer term perspective.
Support levels: 9,581 9,526 9,432
Resistance levels: 9,581 9,526 9,432
DOW JONES
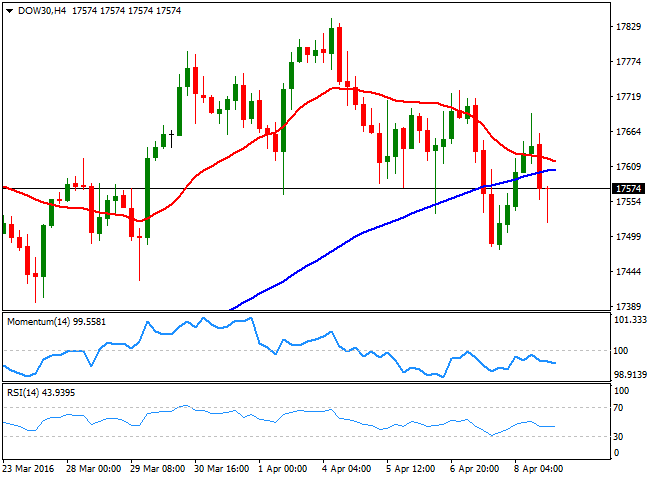
US indexes posted limited gains on Friday, with the DJIA adding 35 points to close at 17,679.96, the Nasdaq adding 2 points to 4,850.69 and the SandP advancing 0.28% to end at 2,047.60. Gains, however, were not enough to claw stocks back into positive territory for the week, and if fact, the Dow posted its largest weekly lose in over two months. Friday's recovery was supported by a strong comeback in oil prices, but US equities were unable to sustain early gains, and retreated ahead of the close. From a technical point of view, the daily chart for the DJIA shows that the index closed the day below a bullish 20 SMA, whilst the technical indicators have stalled their declines and turned flat around their midlines. In the 4 hours chart, the index ended the week below its 20 and 100 SMAs, both around 17,610, while the technical indicators head lower within negative territory, after failing to recover above their midlines, indicating the risk remains towards the downside.
Support levels: 17,530 17,479 17,396
Resistance levels: 17,530 17,479 17,396
FTSE 100
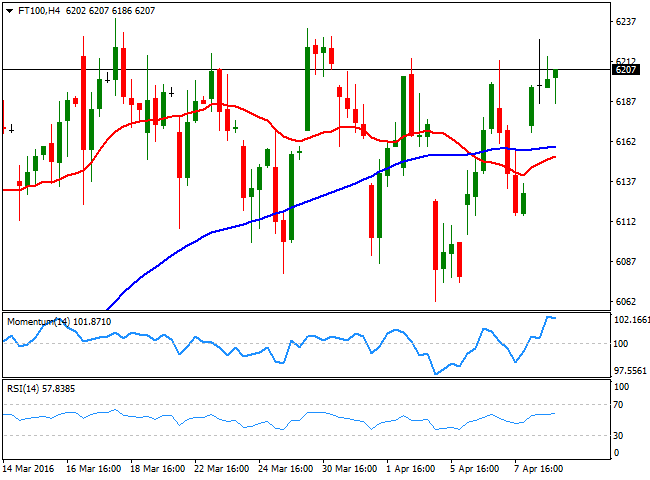
The FTSE 100 surged 1.10% on Friday, ending the day at 6,204.41, its highest close for this 2016, with commodity related equities leading the sharp advance. Anglo American was the biggest winner up by 8.1%, while Royal Dutch Shell added 3.9%, as oil erased all of its previous losses and closed the week with solid gains in the $40.00 a barrel region. The index held around the close in after hours trading, and currently pressures the top of the range that has contained it since late February, still far from confirming a steeper advance, as in the daily chart, the benchmark remains below its 200 DMA, the immediate resistance at 6,232, whilst the technical indicators have barely turned higher within neutral territory. In the 4 hours chart, the index presents a limited upward potential, as it stands above its moving averages that anyway continue to lack directional strength, whilst the technical indicators have lost upward potential after regaining their midlines.
Support levels: 6,159 6,104 6,062
Resistance levels: 6,232 6,285 6,340
The information set forth herein was obtained from sources which we believe to be reliable, but its accuracy cannot be guaranteed. It is not intended to be an offer, or the solicitation of any offer, to buy or sell the products or instruments referred herein. Any person placing reliance on this commentary to undertake trading does so entirely at their own risk.
Recommended Content
Editors’ Picks
How will US Dollar react to Q1 GDP data? – LIVE

The US' GDP is forecast to grow at an annual rate of 2.5% in the first quarter of the year. The US Dollar struggles to find demand as investors stay on the sidelines, while waiting to assess the impact of the US economic performance on the Fed rate outlook.
EUR/USD holds gains above 1.0700, as key US data loom

EUR/USD holds gains above 1.0700 in the European session on Thursday. Renewed US Dollar weakness offsets the risk-off market environment, supporting the pair ahead of the key US GDP and PCE inflation data.
GBP/USD extends recovery above 1.2500, awaits US GDP data

GBP/USD is catching a fresh bid wave, rising above 1.2500 in European trading on Thursday. The US Dollar resumes its corrective downside, as traders resort to repositioning ahead of the high-impact US advance GDP data for the first quarter.
Gold price edges higher amid weaker USD and softer risk tone, focus remains on US GDP

Gold price (XAU/USD) attracts some dip-buying in the vicinity of the $2,300 mark on Thursday and for now, seems to have snapped a three-day losing streak, though the upside potential seems limited.
XRP extends its decline, crypto experts comment on Ripple stablecoin and benefits for XRP Ledger

Ripple extends decline to $0.52 on Thursday, wipes out weekly gains. Crypto expert asks Ripple CTO how the stablecoin will benefit the XRP Ledger and native token XRP.