![]() HY Markets Research Team
HY Markets Research Team
HY Markets
EUR/USD
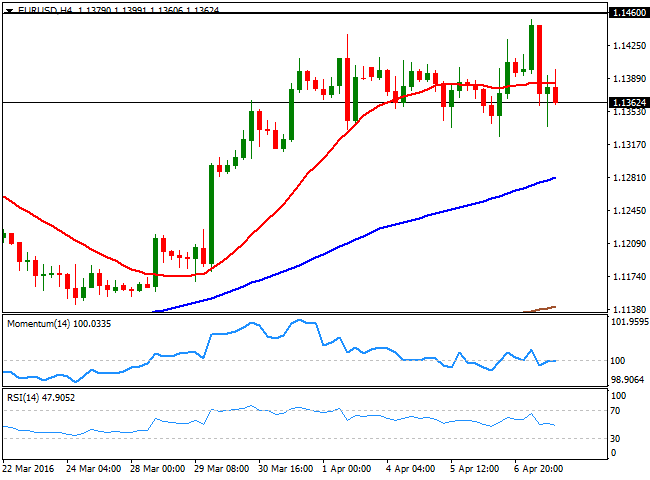
The EUR/USD pair closed the day slightly lower, but not far from the 1.1360/70 comfort zone, in where the pair has been stuck ever since the week started. Still, the common currency extended its rally up to 1.1453 against the greenback during the European morning, as dovish FOMC Minutes kept the American currency under pressure. The minutes of the ECB's March meeting showed that the governing council is committed to keep rates down at least until 2018, and while it's not willing to cut them further, will do if necessary. In the US, the release of weekly unemployment claims had no effect on the markets, despite initial claims declined by 9,000 to a seasonally adjusted 267,000 for the week ended April 1st, below market's expectations. FED's Yellen is due to participate in a panel discussion at the International House, in New York early Asia, although is unlikely she will offer something to work with. Technically, the EUR/USD pair has shown little progress so far this week, confined to a 150 pips range around the mentioned comfort zone, and despite the higher highs daily basis, unable to extend beyond a major static resistance level at 1.1460, the level that capped the upside ever since 2015 started. Now short term neutral, the risk remains towards the downside, as shallow pullbacks have steadily met buying interest. The pair has an immediate support around 1.1330, but it will take further declines, at least below 1.1280, to trigger some profit taking, and therefore a deeper decline for this Friday.
Support levels: 1.1330 1.1280 1.1245
Resistance levels: 1.1420 1.1460 1.1500
GBP/USD
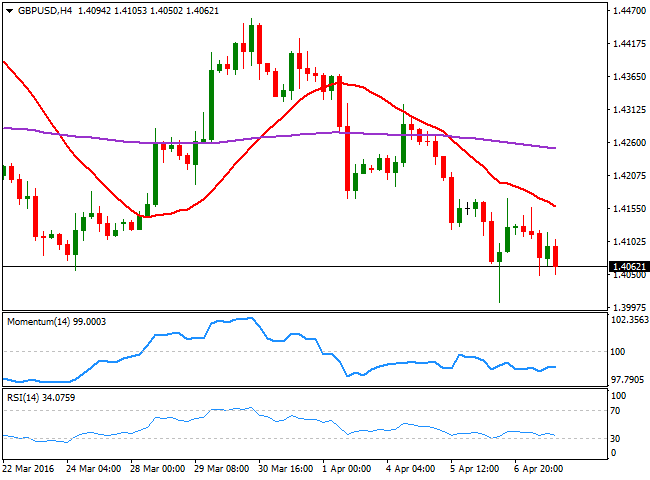
The GBP/USD pair fell for a third consecutive day, posting 1.4047 early Europe, and trades a handful of pips above it by the end of the day. Sterling persistent weakness has been largely blamed on fears over a Brexit, but soft oil's prices indeed had their share of guilt, alongside with disappointing growth data ever since the year started. The UK released the Halifax house price index earlier today, showing that prices jumped 2.6% monthly basis, and were 2.9% higher between January and March, compared to the preceding three months, but the news was not enough to affect the pair. This Friday, the UK will release manufacturing and industrial data for February, alongside with the trade balance for the same month, which will give a clearer picture of the economic health of the kingdom. In the meantime, the downward potential remains strong in the short term, as in the 1 hour chart, the price has been capped by a bearish 20 SMA, currently around 1.4100, while the technical indicators maintain tepid bearish slopes, below their midlines. In the 4 hours chart, the 20 SMA has extended its decline further below the 200 EMA, with the shortest now around 1.4145 whilst the technical indicators turned slightly lower near oversold territory.
Support levels: 1.4050 1.4004 1.3965
Resistance levels: 1.4100 1.4145 1.4175
USD/JPY
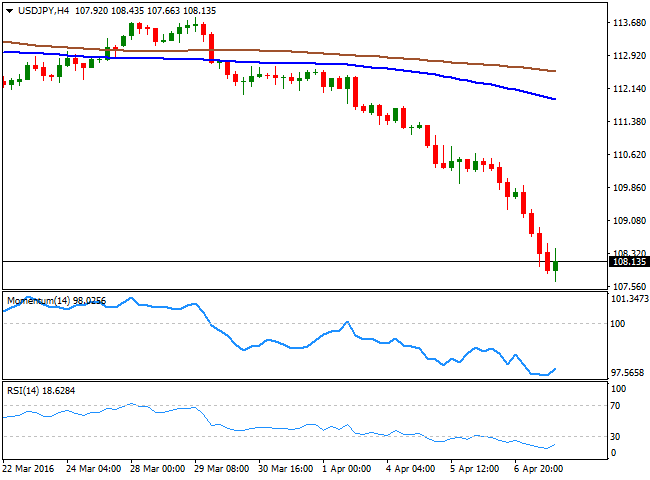
The USD/JPY tumbled to 107.66, its lowest since late October 2014, as yen's strength was fueled by continued uncertainty over the global economic future, and the inability of Central Banks to deal with deflationary pressures. The continued decline in the pair has triggered a limited reaction from Japanese policy makers, who once again came out to say that they are watching rates closely and will act if necessary. BOJ's Governor Kuroda is now expected to take additional easing steps, but seems that, beyond the initial shock it may cause, investors will likely keep ignoring it. After reaching the mentioned low, the pair bounced as high as 108.43, which helped technical indicators in the 1 hour chart, to erase extreme oversold readings, but is far from enough to confirm further short term advances. In the 4 hours chart, the technical indicators have turned slightly higher, but remain within extreme oversold territory, whilst the moving averages are too far above the current level to be relevant. Renewed selling pressure below the mentioned daily low, should lead to a steady decline towards 106.20, a major static support level.
Support levels: 108.00 107.65 107.30
Resistance levels: 108.75 109.10 106.50
GOLD
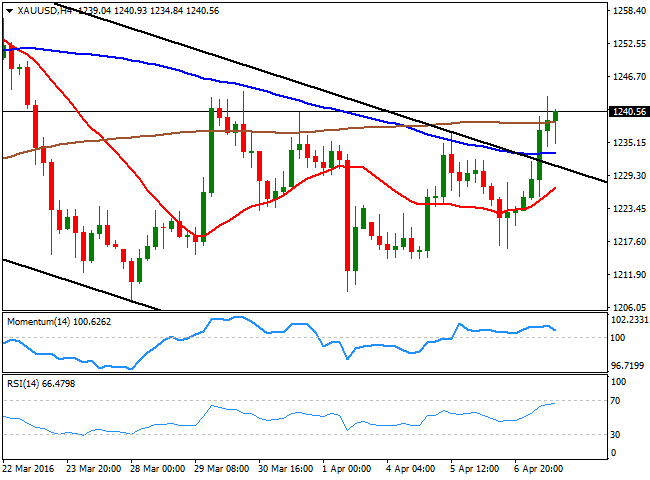
Gold prices soared amid a broader run to safety, with spot gold up to a fresh 6day high of $1,243.20 a troy ounce. The bright metal was fueled by a sharp decline in European and American indexes, while FOMC's minutes showing no urgency in rising rates also boosted speculative buying. Up by 1.3% on the Comex division of the New York Mercantile Exchange, the daily chart for the commodity shows that the price is above its 20 SMA for the first time in over two weeks, but more relevant that it has also broken above the roof of the daily descendant channel that capped the price since early March. In the same chart, the technical indicators are heading higher around their midlines, still not enough to confirm a stronger advance. Shorter term, the 4 hours chart shows that the technical indicators have lost upward momentum, but remain within bullish territory, whilst the 20 SMA has turned north well below the current level, supporting a continued advance on a break above the mentioned daily high, the immediate resistance.
Support levels: 1,234.90 1,225.10 1,216.40
Resistance levels: 1,243.20 1,251.90 1,262.60
WTI CRUDE
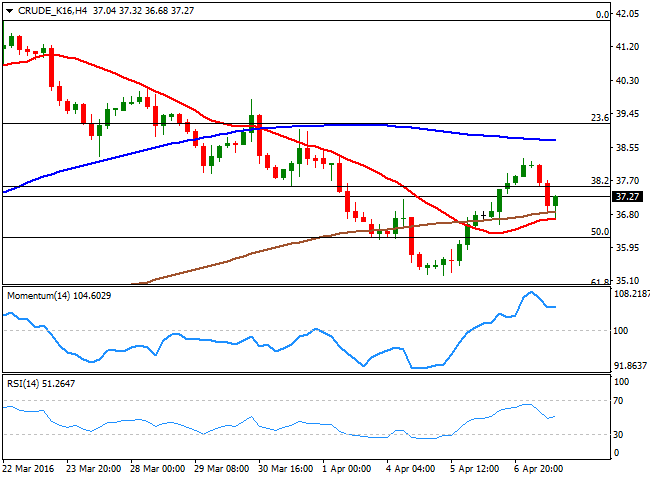
Crude oil prices stalled their advances after extending to fresh weekly highs at the beginning of the day, and finally turned south, as speculative interest took profits on mounting uncertainty over the upcoming Doha meeting's result. West Texas Intermediate crude oil futures traded as high as $38.27 a barrel before shedding a full dollar, and the daily chart suggests that the upward potential remains limited, as the latest rally stalled below its 20 SMA, whilst the technical indicators have resumed their declines after a failed attempt to break above their midlines. In the shorter term, however, a positive tone persists, as the commodity met buying interest on a decline down to its 20 SMA, whilst the technical indicators are currently heading north, having corrected overbought levels earlier in the day. At this point, oil needs to advance beyond 39.20, the 23.6% retracement of its latest bullish run, to confirm a firmer recovery towards 40.00 and beyond for the upcoming sessions.
Support levels: 36.90 36.20 35.50
Resistance levels: 38.30 39.20 40.10
DAX
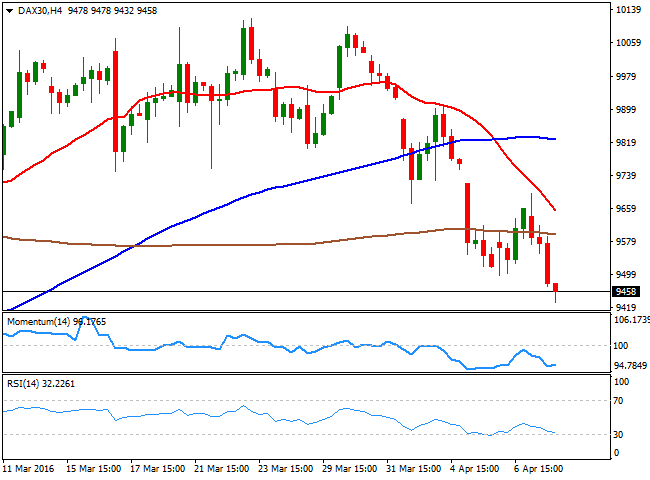
European markets opened higher following soft FOMC´s minutes released late Wednesday, but failed to maintain their gains and closed in the red, as risk aversion regained center stage. The German DAX fell 92 points to close at 9,530.62, extending further lower in electronic trading, tracking Wall Street's decline. The daily chart for the index presents a strong bearish bias, given that the technical indicators have resumed their declines within bearish territory, and stand at fresh 2month lows, whilst the 20 SMA is slowly turning south well above the current level. In the shorter term and for this Friday, the 4 hours chart is also supportive of a downward continuation, given that the index remains below its moving averages, whilst the technical indicators hover near oversold territory, having lost their bearish potential, but far from supporting an upward move. March low was set at 9,394, and a break below it should lead to a steady decline down towards the 9,000 figure.
Support levels: 9,439 9,394 9,331
Resistance levels: 9,497 9,566 9,616
DOW JONES
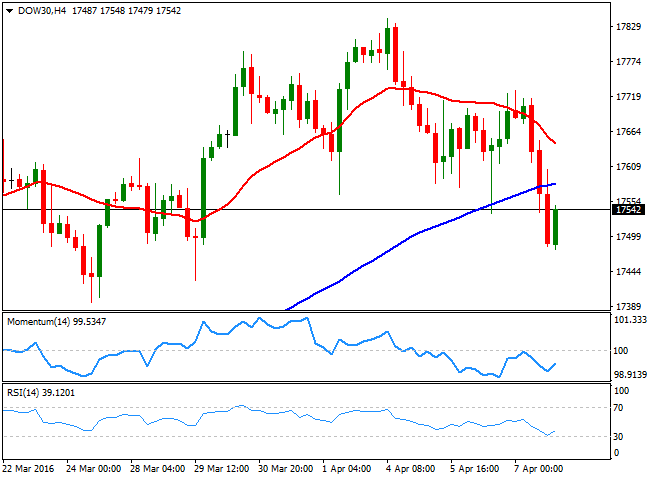
Wall Street plummeted as risk aversion dominated the financial world this Thursday, although major indexes closed off their lows. Nevertheless, the Dow Jones Industrial Average finished the day at 17,541.96, 174 points lower, while the Nasdaq shed 1.47% to end at 4,848.37 and the S and P lost 1.20% closing at 2,041.91. Falling oil prices and stronger safehavens gold and yen weighed on investors' mood, and remains unclear what triggered what. Anyway, the result is that the DJIA fell to its lowest for this April, printing 17,479 before recovering partially. From a technical point of view, the daily chart shows that the index closed the day below its 20 SMA for the first time since mid February whilst the technical indicators have crossed their midlines towards the downside, and maintain strong bearish slopes. In the 4 hours chart, the decline extended below the 100 SMA as the 20 SMA gains bearish strength above the largest, whilst the technical indicators have posted tepid bounces from oversold levels, but are far from signaling further recoveries.
Support levels: 17,479 17,396 17,345
Resistance levels: 17,590 17,653 17,717
FTSE 100
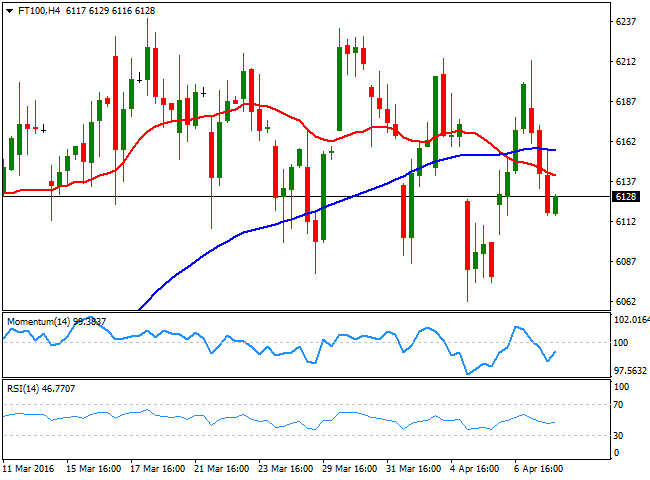
The Footsie erased most of its latest gains this Thursday, closing at 6,136.89, down by 24 points, but tumbling further in futures trading as investors sought for safety. An early rally was quickly reversed as oil prices turned south, sending Glencore down 5.71%. Gold's recovery however, underpinned the mining sector, with Rand gold Resources leading the advance by adding 3.22%. From a technical point of view, the index continues to show no progress, holding within a well defined range for almost a month. Daily basis, the technical stance is neutral to bearish given that the index kept hovering around a horizontal 20 DMA and between the 100 and 200 DMAs, whilst the technical indicators have turned slightly lower around their midlines. In the 4 hours chart, the technical indicators are recovering some ground after a limited downward move within negative territory, whilst the index is a handful of points below a slightly bearish 20 SMA.
Support levels: 6,104 6,062 6,006
Resistance levels: 6,158 6,239 6,285
The information set forth herein was obtained from sources which we believe to be reliable, but its accuracy cannot be guaranteed. It is not intended to be an offer, or the solicitation of any offer, to buy or sell the products or instruments referred herein. Any person placing reliance on this commentary to undertake trading does so entirely at their own risk.
Recommended Content
Editors’ Picks
EUR/USD clings to daily gains above 1.0650

EUR/USD gained traction and turned positive on the day above 1.0650. The improvement seen in risk mood following the earlier flight to safety weighs on the US Dollar ahead of the weekend and helps the pair push higher.
GBP/USD recovers toward 1.2450 after UK Retail Sales data

GBP/USD reversed its direction and advanced to the 1.2450 area after touching a fresh multi-month low below 1.2400 in the Asian session. The positive shift seen in risk mood on easing fears over a deepening Iran-Israel conflict supports the pair.
Gold holds steady at around $2,380 following earlier spike

Gold stabilized near $2,380 after spiking above $2,400 with the immediate reaction to reports of Israel striking Iran. Meanwhile, the pullback seen in the US Treasury bond yields helps XAU/USD hold its ground.
Bitcoin Weekly Forecast: BTC post-halving rally could be partially priced in Premium

Bitcoin price shows no signs of directional bias while it holds above $60,000. The fourth BTC halving is partially priced in, according to Deutsche Bank’s research.
Week ahead – US GDP and BoJ decision on top of next week’s agenda

US GDP, core PCE and PMIs the next tests for the Dollar. Investors await BoJ for guidance about next rate hike. EU and UK PMIs, as well as Australian CPIs also on tap.