![]() HY Markets Research Team
HY Markets Research Team
HY Markets
EUR/USD
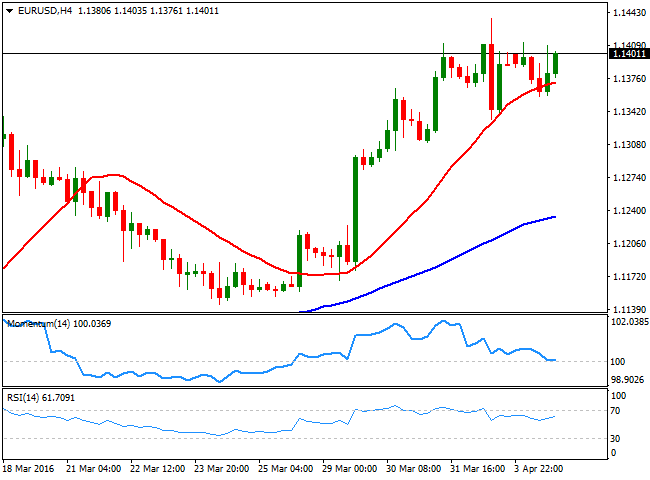
The American dollar retained its negative tone in a quiet Monday, in where most major pairs remained confined to tight ranges. The British Pound outperformed, while on contrary, commodity related currencies were among the weakest. Data in the EU was mixed, as the unemployment rate declined to 10.3% in February from an upwards revised 10.4% in January, but producer prices fell by 0.7% in February, compared to the previous month, and down by 4.2% compared to a year before, indicating deflationary pressures are still high. In the US, new orders for factory goods declined 1.7%, more than the 1.6% decline expected. This week, the FED will release the minutes of its latest meeting on Wednesday, while the ECB will do the same on Thursday, something that may lead to further range trading, but with a dollar still in risk of further declines.The EUR/USD pair managed to advance up to 1.1412 daily basis, but spent most of the American afternoon hovering around the 1.1400 level, unable to set to a clear directional bias. From a technical point of view, and despite the poor intraday performance, the EUR/USD pair remains near its yearly high of 1.1437, while daily basis, the pair has posted a lower low, indicating market is still willing to buy the dips. Technical readings in the 1 hour chart support some further advances, as the technical indicators continue heading north after crossing their midlines, while the price is currently above a flat 20 SMA. In the 4 hours chart, a brief decline below a bullish 20 SMA was quickly reverted, while the Momentum indicator has turned flat around its 100 level after correcting overbought readings, and the RSI indicator heads north around 61, all of which points for further gains towards the 1.1460 critical resistance, en route to 1.1500.
Support levels: 1.1360 1.1320 1.1280
Resistance levels: 1.1420 1.1460 1.1500
GBP/USD
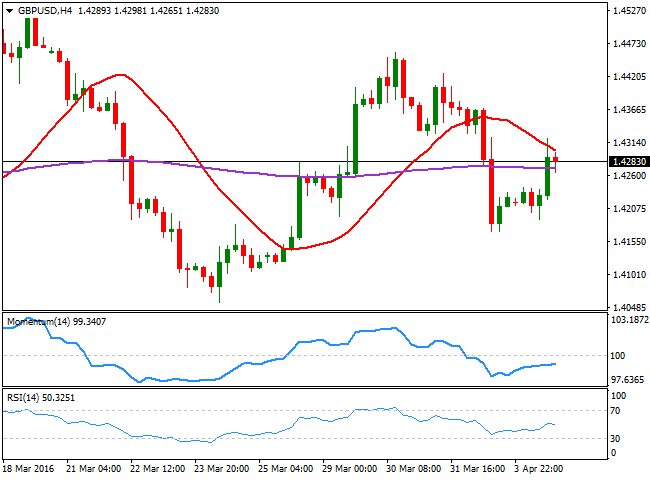
The GBP/USD pair rose early Europe, with no clear catalyst behind the move, as the only piece of data release in the UK was the construction PMI for March, which resulted at 54.2, unchanged from February. The pair however, recovered up to 1.4321, from where it slowly retreated in a quiet US session, back below the 1.4300 figure. The kingdom will release its latest Services PMI on Tuesday, expected at 53.9 from a previous 52.7. The services sector has been showing steady growth ever since the year started, unlikely to other sectors of the economy, so a positive reading should not come as a surprise. Nevertheless, a better than expected number may help the Pound to recover further, as it has been lately underperforming. Short term, technical readings in the 1 hour chart hold in positive ground, but lack directional momentum, anticipating some further range ahead. In the 4 hours chart, the price was capped by a strongly bearish 20 SMA, currently around 1.4315, whilst the technical indicators remain within negative territory. Overall, there's no technical confirmation that the pair may keep rallying during the upcoming hours, and it will take some follow through above the mentioned high to confirm additional gains, while it will take a clear acceleration below 1.4260 to see the pair resuming its bearish trend.
Support levels: 1.4260 1.4210 1.4170
Resistance levels: 1.4315 1.4360 1.4410
USD/JPY
The Japanese yen kept rallying against the greenback, leaving the USD/JPY pair near the critical 111.00 level ahead of the Asian opening, and with the focus still on the downside. The JPY appreciated as stocks struggled for direction this Monday, while US Treasury yields edged lower, with the 10y benchmark down 1.28% to 1.77%. Earlier in the day, Japanese PM Shinzo Abe said the government will give details of its plan to front load the 2016 fiscal budget at the cabinet meeting this Tuesday, which may result if a downward move of the local currency, should the budget include additional easing, although the movement could be short lived. In the meantime, the short term picture is clearly bearish, given that in the 1 hour chart, the price pressures its lows and stands below its 100 and 200 SMAs, with the shortest now around 112.10, whilst the technical indicators head lower within negative territory. In the 4 hours chart, the technical indicators present a strong bearish momentum, with the RSI indicator approaching oversold levels, and the price well below its 100 and 200 SMAs, all of which supports a continued decline down to the 110.00 figure.
Support levels: 111.00 110.65 110.30
Resistance levels: 111.60 112.10 112.60
GOLD
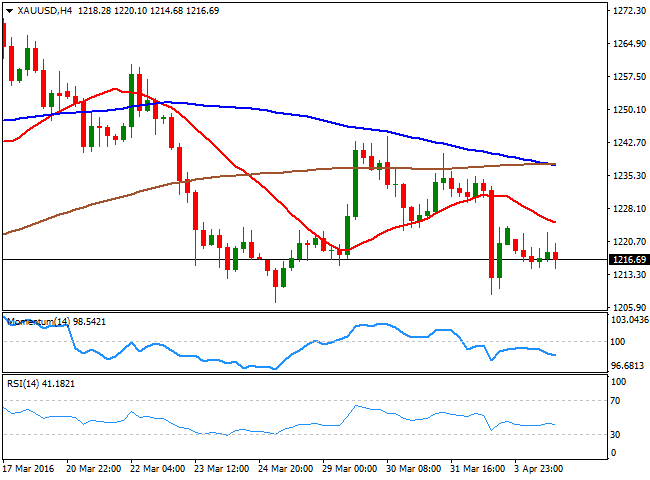
Gold prices remained under pressure at the beginning of the week, with spot down to $ 1,1216.70 a troy ounce. The daily decline was modest, as investors were unable to shrug off the increasing uncertainty over the US broader economy, as a solid employment report followed an ultra dovish stance coming from policy makers. Nevertheless, recent US positive data has weighed on buyers mood, not yet ready to give up, but reluctant to add at current levels. Having traded within Friday's lower range, the daily chart shows that the price continues to develop below a bearish 20 SMA that contained advances since mid March, while the technical indicators present limited bearish strength, but remain within negative territory. In the 4 hours chart, the price extended further below its moving averages, with the 20 SMA now heading sharply lower around 1,225.00, and the technical indicators accelerating lower below their midlines, favoring some further declines, particularly on a break below 1,208.90, Friday's low.
Support levels: 1,214.70 1.208.90 1,200.00
Resistance levels: 1,222.70 1.231.90 1,240.30

WTI CRUDE
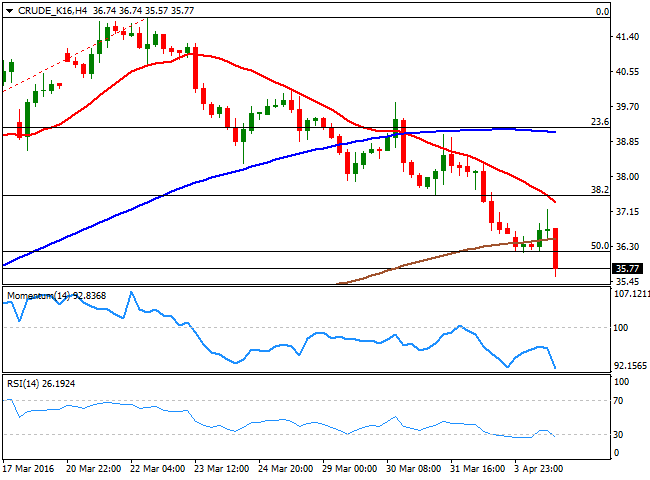
Crude oil prices came under renewed selling pressure on news that Iran would continue to increase its oil production to reach the market position it enjoyed before the sanctions, diminishing hopes of an output freeze deal amongst OPEC and non OPEC producers. WTI crude oil futures fell to its lowest in 4 weeks, down to $35.57 a barrel in the US afternoon, and closing the day a few cents above this last. Technically, the commodity has fallen six out of the last seven days, and is currently below the 50% retracement of the February/March rally at 36.20, the immediate resistance. In the daily chart, the price is well below a bearish 20 SMA, whilst the technical indicators head sharply lower within negative territory, indicating some further declines for this Tuesday, towards 34.80, the 61.8% retracement of the same rally. In the 4 hours chart, the technical indicators present a strong bearish momentum, despite being in oversold territory, whilst the 20 SMA accelerated its decline above the current level, in line with the longer term outlook.
Support levels: 35.50 34.88 34.30
Resistance levels: 36.20 36.90 37.65
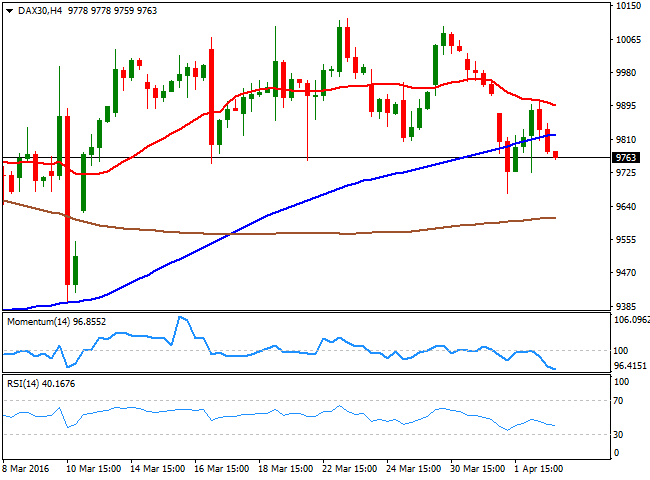
DAX
European equities posted a modest recovery at the beginning of the week, with the German DAX advancing 27 points to end the day at 9,822.08. Nevertheless, the poor performance of Wall Street and an increasing sense of risk aversion, has sent the index south in electronic trading, exposing it to a continued decline during the upcoming sessions, particularly as it faltered plenty of times to gain beyond the 10,000 mark. From a technical point of view, the daily chart shows that the index remained below its 20 SMA, with a limited spike above it being quickly sold on. In the same chart, the technical indicators have crossed their midlines towards the downside and maintain their bearish slopes, supporting additional declines ahead. In the 4 hours chart, the index met selling interest around a bearish 20 SMA, currently at 9,897, while the technical indicators present bearish slopes below their midlines, in line with the longer term perspective.
Support levels: 9,754 9,680 9,610
Resistance levels: 9,897 9,961 10,042
DOW JONES
All of the three major US indexes closed in the red in a lackluster session, as falling oil's prices hurt investors' sentiment, while poor US factory orders sent industrial and consumer discretionary companies lower. The Dow Jones Industrial Average shed 55 points to end at 17,737.00, the Nasdaq lost 0.46% to close at 4,891.80, whilst the SandP declined 0.32% to 2,066.13. Despite holding near its recently posted year highs, the DJIA seems to be losing upward steam, as in the daily chart, the Momentum indicator has turned south, and points to cross its midline into negative territory, while the RSI indicator is finally easing from extreme overbought readings, but remains above 70, pointing for a downward corrective move rather than suggesting a top has been reached. In the shorter term, the 4 hours chart, however, additional declines can't be confirmed, given that the index is hovering around its 20 SMA, whilst the Momentum indicator has bounced from its midline and the RSI indicator hovers around 52.
Support levels: 17,707 17,645 17,565
Resistance levels: 17,809 17,865 17,922

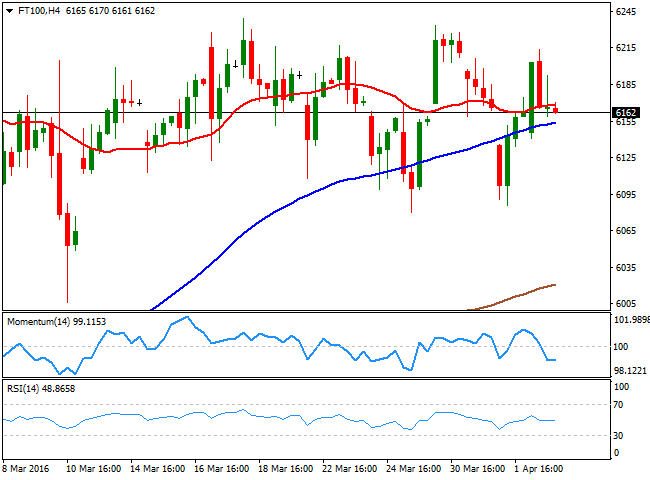
FTSE 100
The FTSE 100 closed up 0.30% or 18 points at 6,164.72, still trading within March's range. The index managed to trim early losses, but closed far below its daily low, as crude oil's slide finally weighed on investors' mood. Nevertheless, commodity related shares closed higher, with Rio Tinto adding 1.67%, Anglo American closing up 1.69%, and Royal Dutch Shell, adding 0.5%. The index has made no progress from a technical point of view, given that in the daily chart, it's stuck around a horizontal 20 SMA, while the technical indicators continue to lack directional strength around their midlines. In the 4 hours chart, the technical stance is also neutral, with the index moving back and forth around a flat 20 SMA, and the technical indicators heading nowhere within neutral territory. The 200 DMA stands at 6,245, being the level to break to see the index gaining a more constructive bullish potential, quite unlikely, however, if the Pound remains subdued to Brexit fears.
Support levels: 6,140 6,080 6,006
Resistance levels: 6,245 6,300 6,352
The information set forth herein was obtained from sources which we believe to be reliable, but its accuracy cannot be guaranteed. It is not intended to be an offer, or the solicitation of any offer, to buy or sell the products or instruments referred herein. Any person placing reliance on this commentary to undertake trading does so entirely at their own risk.
Recommended Content
Editors’ Picks
EUR/USD holds above 1.0600 as focus shifts to Powell speech

EUR/USD fluctuates in a narrow range above 1.0600 on Tuesday as the better-than-expected Economic Sentiment data from Germany helps the Euro hold its ground. Fed Chairman Powell will speak on the policy outlook later in the day.
GBP/USD stays near 1.2450 after UK employment data

GBP/USD gains traction and trades near 1.2450 after falling toward 1.2400 earlier in the day. The data from the UK showed that the ILO Unemployment Rate in February rose to 4.2% from 4%, limiting Pound Sterling's upside.
Gold retreats to $2,370 as US yields push higher

Gold stages a correction on Tuesday and fluctuates in negative territory near $2,370 following Monday's upsurge. The benchmark 10-year US Treasury bond yield continues to push higher above 4.6% and makes it difficult for XAU/USD to gain traction.
XRP struggles below $0.50 resistance as SEC vs. Ripple lawsuit likely to enter final pretrial conference

XRP is struggling with resistance at $0.50 as Ripple and the US Securities and Exchange Commission (SEC) are gearing up for the final pretrial conference on Tuesday at a New York court.
Canada CPI Preview: Inflation expected to accelerate in March, snapping two-month downtrend

The Canadian Consumer Price Index is seen gathering some upside traction in March. The BoC deems risks to the inflation outlook to be balanced. The Canadian Dollar navigates five-month lows against the US Dollar.