EUR/USD
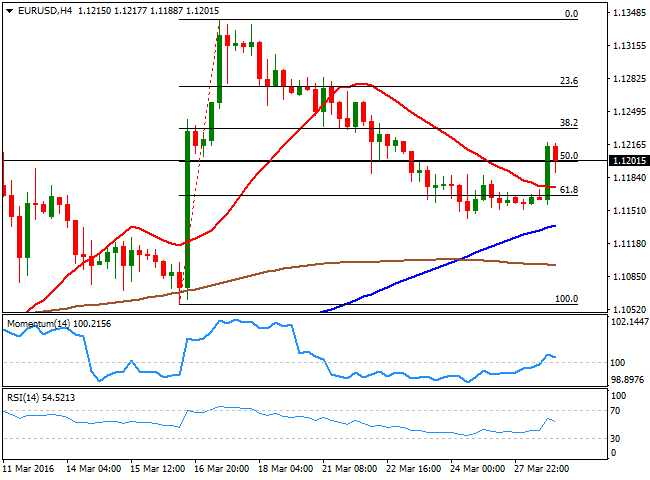
The American dollar edged lower across the board as local data disappointed. The personal income and spending report came in mixed, showing that data beat expectations for February, but January's numbers were revised negatively. The all important PCE inflation number was a huge disappointment, with the headline reading monthly basis down by 0.1%, while the core number came in at 0.1% against previous 0.3%. Also, the Goods Trade Balance posted a larger than expected deficit, of $63.0B. Pending home sales on the other hand, rose 3.5% in February, against January's 3% loss. This Tuesday, FED's Yellen is due to deliver a speech titled "Economic Outlook and Monetary Policy" at the Economic Club of New York luncheon, the first time she will speak after the latest FOMC meeting. Investors will be looking closely for any comment regarding rates and whether if she will maintain the dovish tone of the statement, of align with latest FED's speakers and offer a more hawkish wording. In the meantime, the American dollar suffered a strong set back early in the US session, down against all of its major rivals. The EUR/USD pair reached a daily high of 1.1219 before retracing towards the 1.1200 level, easing as Wall Street trimmed most of its early losses ahead of the close. The recovery has been pretty significant considering that the price was unable to fall beyond the 61.8% retracement of its latest daily bullish run, but not enough to confirm a continued advance, given that in the 4 hours chart, the price is currently struggling around the 50% retracement of the same rally, whilst the technical indicators have lost their bullish potential after regaining positive territory. The upside however, is now favored as long as the 1.1160 support holds, with an upward acceleration expected on a break above 1.1245.
Support levels: 1.1160 1.1120 1.1085
Resistance levels: 1.1245 1.1290 1.1330
GBP/USD
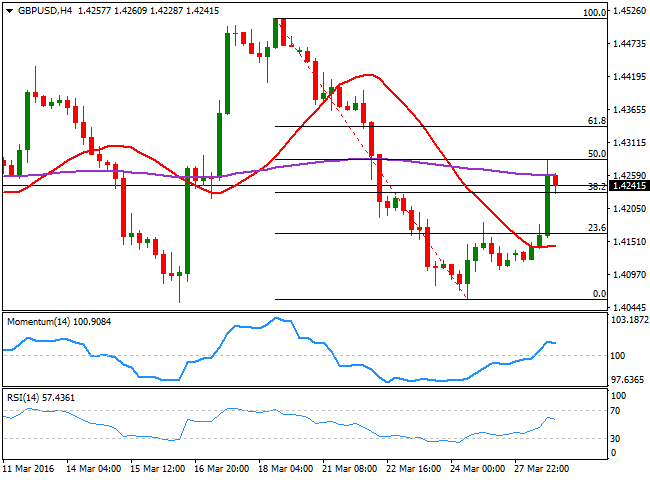
The GBP/USD pair advanced up to 1.4282, the highest since last Tuesday, fueled by poor US data. The Sterling saw some limited demand at the beginning of the day, as most European and Asian markets were closed on holiday, but downbeat US PCE inflation boosted the advance up to the mentioned high. There were no macroeconomic releases in the UK, and the calendar will remain empty until the release of GDP figures on Thursday, which means that the pair will be largely driven by dollar's self strength/weakness. The upward potential is still quite limited, given that in the 4 hours chart, the pair met selling interest around its 200 EMA, whilst the technical indicators have lost their bullish strength after recovering above their midlines. Furthermore, the recovery stalled around the 50% retracement of its latest bearish run, and the price is currently resting above the 38.2% retracement of the same rally, at 1.4230, the immediate support. A break below this last, should the see pair returning to the lower band of the 1.4100 level, which will also increase the risk towards the downside, eyeing levels below the 1.4000 figure for later on this week.
Support levels: 1.4230 1.4190 1.4145
Resistance levels: 1.4285 1.4330 1.4370
USD/JPY
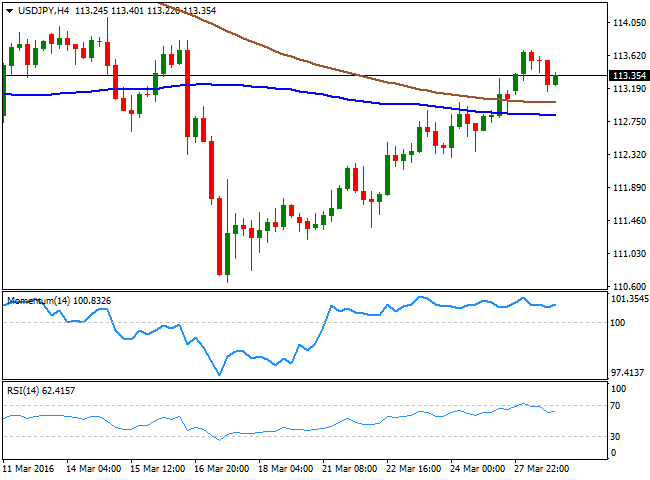
The USD/JPY pair advanced to 113.59, the highest in ten days, but with no actual follow through as tepid US macroeconomic releases stalled the early advance. The Japanese yen weakened as speculative interest is expecting PM Abe to announce some sort of fiscal stimulus and a delay in the planned tax hike, as soon as this Tuesday. Roughly 30 pips away from its Friday's close, the pair has been rising for seven days inarow, but it´s still worrisome the fact that the pair remains below 2015 lows, in spite of the negative deposit rate established by the BOJ late February. Technically, the 1 hour chart shows that the Momentum indicator has entered negative territory at the beginning of the US session, with the RSI is heading south around 51. In the same chart, the 100 and 200 SMAs remain below the current level, with the 100 SMA being the line in the sand at 112.30, as a decline below it should open doors for a steeper decline. In the 4 hours chart, however, the technical indicators lack directional conviction, but remain within positive territory. The pair has multiple intraday highs in the 113.70 region, which means only an acceleration beyond the level will favor additional gains up to the 114.45 price zone.
Support levels: 112.75 112.30 111.90
Resistance levels: 113.70 114.10 114.45
GOLD
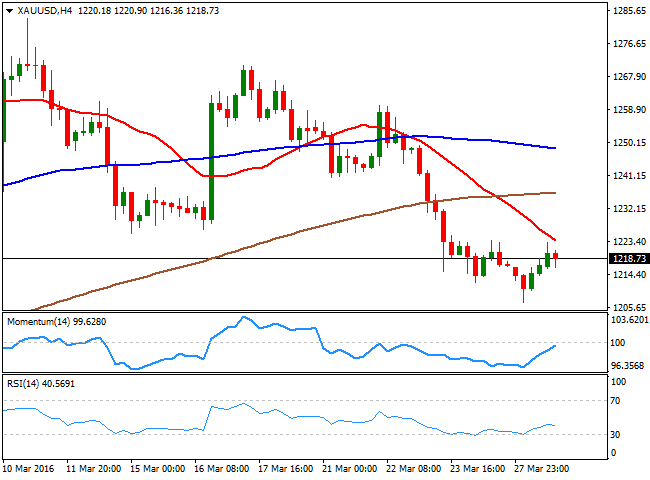
Spot gold recovered some ground after falling down to a fresh 5week low of $1,206.91 a troy ounce, closing the day higher around 1,219.00. The early decline was attributed to improved market's sentiment due to Chinese industrial profits figures released over the weekend, but the commodity finally turned higher as the dollar was hit by poor PCE inflation data. Gold bulls will be looking for Yellen's wording this Tuesday, as the bright metal has been highly correlated with the US economic policy, up when a rate hike moves further away, and down, when a hike becomes more real in the shorter term. From a technical point of view, the risk remains towards the downside, as in the daily chart, the price remains below Friday's high, at 1,223.75, the immediate resistance, whilst far below a now bearish 20 SMA. In the same chart, the technical indicators remain within bearish territory, although the RSI indicator has lost its downward strength. In the 4 hours chart, the technical indicators have bounced sharply from oversold readings, but that has not been enough to confirm more gains, as the price was capped by a bearish 20 SMA, currently at the mentioned Friday's high, reinforcing the strength of the dynamic resistance.
Support levels: 1,212.30 1,203.50 1,190.90
Resistance levels: 1,223.75 1,233.40 1,245.60
WTI CRUDE
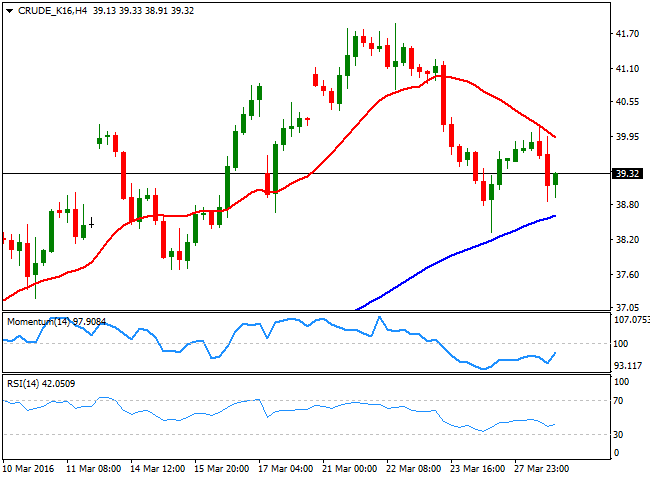
Crude oil prices remained subdued in spite of dollar's weakness with WTI futures failing to advance beyond $40.00 a barrel. The commodity was weighed by reviews from first line banks such as Barclays, which warned that markets' fundamentals remain weak and that could possible sent the price back towards the 30/35.00 region, or even lower. Brent closed the day at $40.26 a barrel, while US light, sweet crude shed some 50 cents from Friday's close and ended up around $39.35. The technical picture for this last is not yet confirming a continued decline, given that in the daily chart, the price bounced after testing a bullish 20 SMA, whilst the technical indicators kept heading lower, but within bullish territory. In the shorter term, the 4 hours chart presents a limited upward potential, given that selling interest has surged on approaches to a bearish 20 SMA, currently around 39.90, whilst the technical indicators present tepid bullish slopes within negative territory.
Support levels: 38.95 38.30 37.60
Resistance levels: 39.90 40.40 41.10
DAX
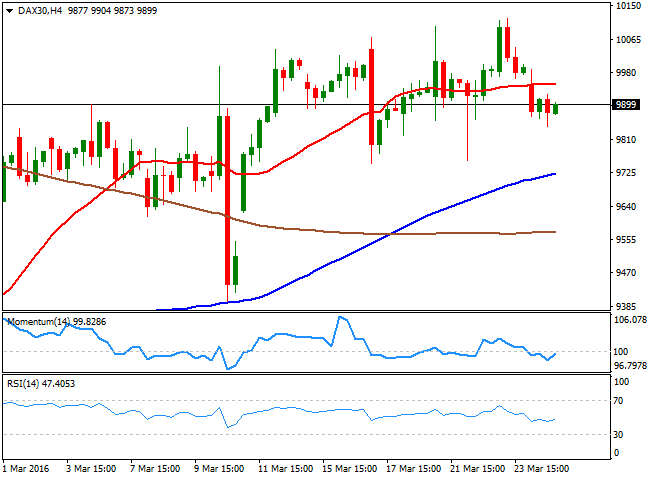
The holiday in Europe extended for one more day, with most major markets down on Easter Monday. Activity will resume this Tuesday, and local share markets are expected to open slightly higher, as investors' mood has somehow improved during this long weekend. The German DAX closed at 9,851.35 last Thursday, and although last week extended its rally up to 10,118, the index is still unable to settle above the key 10,000 level, which will result far more attractive to cautious investors. In the meantime, and as commented on previous update, the technical readings show that in the daily chart, the technical indicators head lower above their midlines while the 20 SMA provides a strong dynamic support around 9,810. In the 4 hours chart, the short term downside potential is limited, as the index is a few points below a horizontal 20 SMA, while the technical indicators have turned slightly higher within bearish territory.
Support levels: 9,842 9,774 9,710
Resistance levels: 9,951 10,040 10,118
DOW JONES
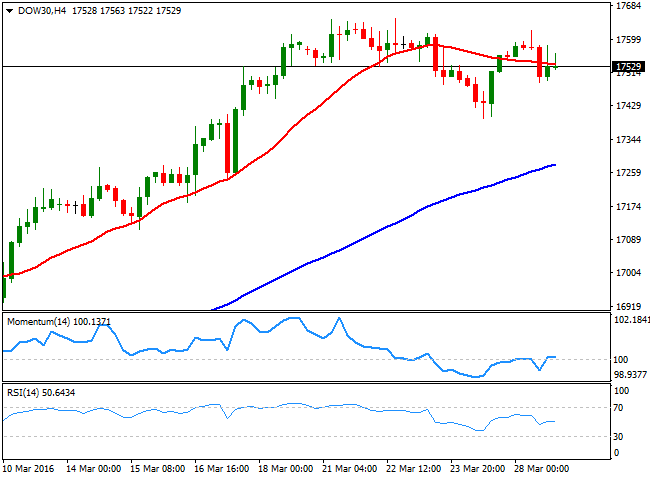
Wall Street closed the day pretty much flat, with the DJIA advancing 0.11% or 19 points to close at 17,535.39, the Nasdaq down 6 points to 4,766.79 and the SandP up 0.05% to end at 2,037.05. US indexes opened sharply lower, by trimmed most of its daily losses ahead of the close, as crude oil prices stabilized around Friday's close. The commodity has been the main driver of US equities, leading the energy sector lower and weighing on the daily close. The DJIA technical picture shows that the index has remained within last week's range, and in the daily chart, the technical indicators continue to lack directional strength, but hold well into positive territory, while the 20 SMA maintains a strong bullish slope well below the current level, all of which maintains the downside limited. In the 4 hours chart, the index was unable to close the day above its 20 SMA that anyway remains flat, while the technical indicators are currently hovering around their midlines, mostly reflecting the low volume seen this Monday. Markets will resume fullmode trading during the upcoming Asian session, with local share markets probably setting the tone for the rest of the day.
Support levels: 17,502 17,440 17,396
Resistance levels: 17,581 17,652 17,728
FTSE 100
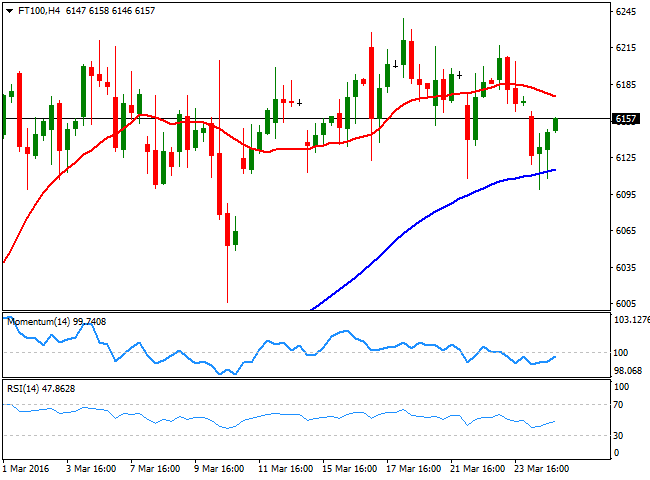
The FTSE 100 remained closed this Monday, with its latest close having been last Thursday at 6,106.48. Base metals ended the day slightly higher, while crude oil lost some ground, but in general, moves where soft, which anticipates some little changed opening in the index for this Tuesday. If anything, it may tick higher as market's sentiment has improved somehow during the long weekend. Anyway and with no technical updates for the last two trading days, the daily chart shows that the technical indicators have erased the overbought conditions reached late February and the Momentum is crossing its midline towards the downside as the index struggles around its 20 SMA, overall, not a good sign for bulls. In the 4 hours chart, the risk is also towards the downside, according to the latest available data, the index is below a mild bearish 20 SMA, while the technical indicators aim higher within negative territory. Given the latest recovery in oil prices, and the good news coming from the US and China over the weekend, the index may see some limited gains this Monday, but it still needs to advance at least beyond 6,239, March high, to be able to perform a more sustainable recovery.
Support levels: 6,112 6,075 6,037
Resistance levels: 6,239 6,268 6,326
The information set forth herein was obtained from sources which we believe to be reliable, but its accuracy cannot be guaranteed. It is not intended to be an offer, or the solicitation of any offer, to buy or sell the products or instruments referred herein. Any person placing reliance on this commentary to undertake trading does so entirely at their own risk.
Recommended Content
Editors’ Picks
EUR/USD hovers around 1.0700 ahead of German IFO survey

EUR/USD is consolidating recovery gains at around 1.0700 in the European morning on Wednesday. The pair stays afloat amid strong Eurozone business activity data against cooling US manufacturing and services sectors. Germany's IFO survey is next in focus.
USD/JPY refreshes 34-year high, attacks 155.00 as intervention risks loom

USD/JPY is renewing a multi-decade high, closing in on 155.00. Traders turn cautious on heightened risks of Japan's FX intervention. Broad US Dollar rebound aids the upside in the major. US Durable Goods data are next on tap.
Gold: Defending $2,318 support is critical for XAU/USD

Gold price is nursing losses while holding above $2,300 early Wednesday, stalling its two-day decline, as traders look forward to the mid-tier US economic data for fresh cues on the US Federal Reserve interest rates outlook.
Worldcoin looks set for comeback despite Nvidia’s 22% crash Premium

Worldcoin (WLD) price is in a better position than last week's and shows signs of a potential comeback. This development occurs amid the sharp decline in the valuation of the popular GPU manufacturer Nvidia.
Three fundamentals for the week: US GDP, BoJ and the Fed's favorite inflation gauge stand out Premium

While it is hard to predict when geopolitical news erupts, the level of tension is lower – allowing for key data to have its say. This week's US figures are set to shape the Federal Reserve's decision next week – and the Bank of Japan may struggle to halt the Yen's deterioration.
