EUR/USD
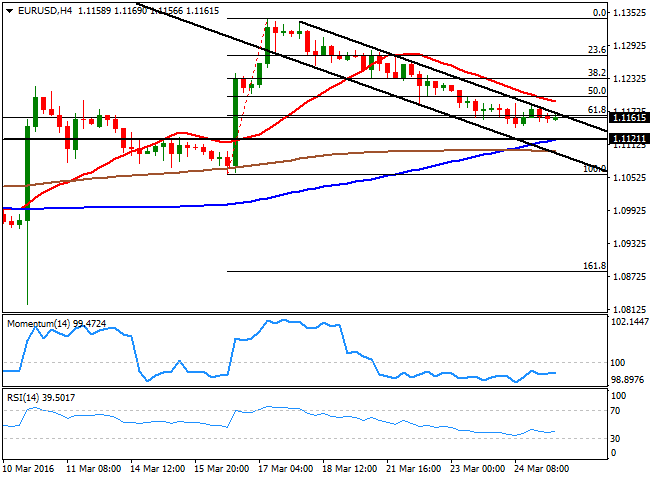
After a long weekend, European markets will remain closed on Monday, anticipating some more dull trading across the forex board. Nevertheless, the weekly opening may see some riskoff trading, on the back of positive news coming from the US and China during the past few days. Last Friday, the US released its latest version of the Q4 2015 GDP, which surprised to the upside being revised higher, to 1.4% from the previous estimate of 1.0%. During the weekend, news revealed that China's industrial profits rose at the fastest pace since mid 2014, during the first two months of 2016, up by 4.8% from a year earlier, all of which should keep the greenback on demand at the beginning of the week. The greenback stood as the weekly winner, mostly supported by FED's officers jawboning on a soon to come rate hike, leaving it poised to extend its advance during the upcoming days, particularly if local data shows that the economic recovery began to pickup during this March. As for the technical picture of the EUR/USD pair, the price is stuck around the 61.8% retracement of the rally achieved post FED, at 1.1165, presenting a neutral stance in the short term, given the lack of liquidity of these last days. The pair fell for the last five consecutive days, but the daily chart shows that the price remains above its moving averages, with the 20 SMA now heading north around 1.1130, and the technical indicators holding flat well into positive territory. Should the decline accelerate below 1.1120, the risk will turn lower, with chances then of a test of the 1.1000 level during the upcoming days.
Support levels:1.1120 1.1085 1.1040
Resistance levels: 1.1210 1.1245 1.1290
GBP/USD
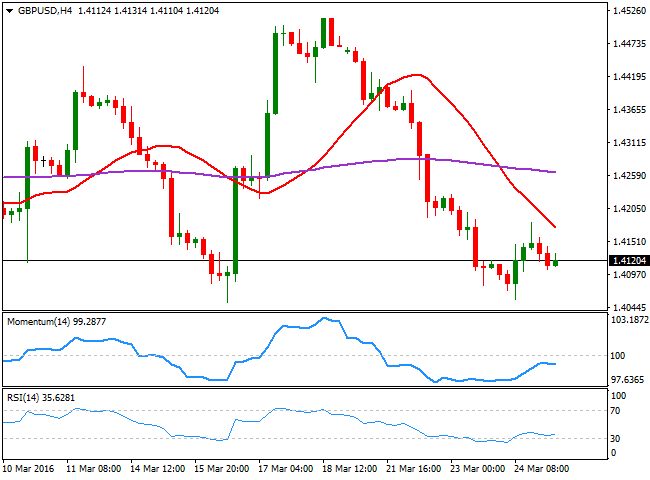
The Sterling under performed its counterparts, weighed by concerns over a possible Brexit, and the GBP/USD pair is at risk of further declines, as the data triggered rally seen on Thursday was rejected near 1.4200. Having held a few pips above the 1.4100 level on Friday, the downward risk prevails, most likely until the ends of June when the Referendum will take place. Technically, the pair has met strong buying interest on declines towards 1.4050 during the last two weeks, making of the level the one to beat to trigger stops and additional slides. The daily chart presents a limited bearish tone, as the price stands below its 20 SMA, whilst the technical indicators present tepid bearish slopes below their midlines. Short term, the 4 hours chart shows that the price has broken below its 200 EMA, now around 1.4260, while the 20 SMA heads sharply lower above the current price, offering an immediate resistance in the 1.4180 region. In the same chart, the technical indicators have corrected oversold readings, but lost steam within bearish territory. The immediate support comes at 1.4100, followed by the mentioned 1.4050 level, which if it's broken can lead to an extension below the 1.4000 figure at the beginning of the upcoming week.
Support levels: 1.4100 1.4050 1.4010
Resistance levels: 1.4200 1.4235 1.4260
USD/JPY
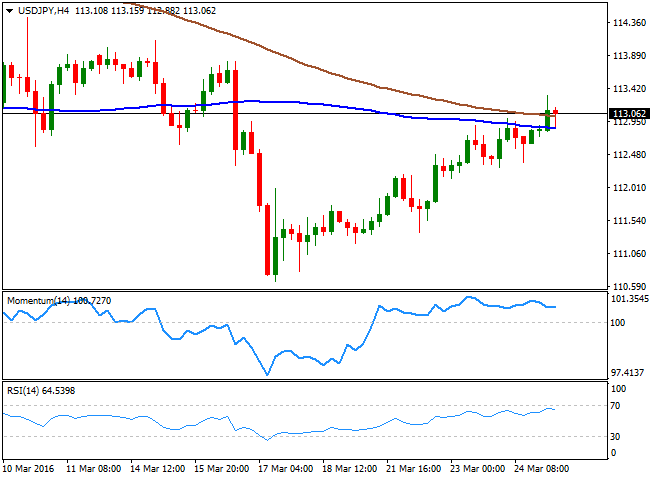
The USD/JPY pair rallied up to 113.32 last week, reaching the mentioned high early Friday, following the release of February Japanese inflation figures, which fueled speculation that the BOJ will be forced to add more stimulus sooner or later. The headline National CPI was up 0.3% compared to a year before, and in line with expectations. Excluding volatile food and energy prices, the CPI rose by 0.8% yearonyear. The pair later retraced partially ahead of the daily close, but held above the 113.00 figure, helped by the upward revision of the US GDP figures for the last quarter of 2015. Despite having advance all of the five days of the past week, the upward potential is still quite limited, given that in the daily chart, the pair is over 400 pips below a bearish 100 DMA, whilst the Momentum indicator retreated from its midline, and the RSI indicator consolidated below 50. In the 4 hours chart, the price is above its 100 and 200 SMAs, while the technical indicators hold within positive territory, lacking directional strength amid the latest absence of volatility. The pair however, can gap higher at the opening, fueled by positive Chinese data released over the weekend.
Support levels: 112.90 112.40 112.00
Resistance levels: 113.30 113.75 114.00
GOLD
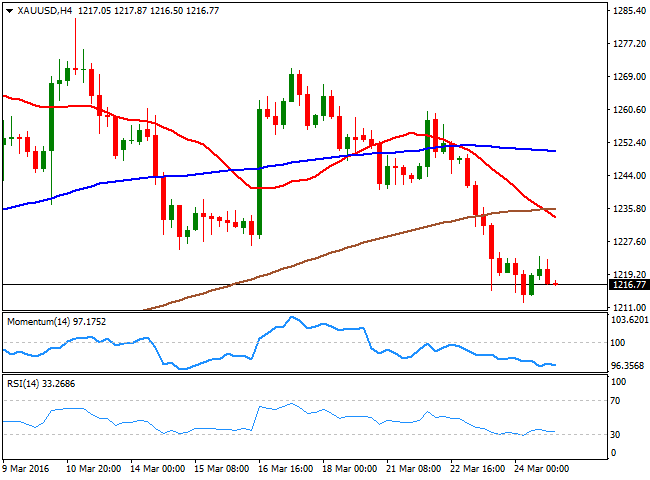
Gold prices slipped to their lowest level in nearly one month last week, with spot down to $1,212.26, weighed by hawkish comments from US FED's officers, pledging for the Central Bank to remain in the tightening path. Despite the limited activity seen on Friday, the commodity extended its weekly decline, posting a lower high and a lower low, and leaving doors opened for further declines during the upcoming days. The bright metal has been quite sensitive to the US Central Bank´s announcements for over a year now, and more jawboning alongside with steady dollar's strength, should lead to a deeper bearish move during this week, particularly as the US will release its CPE data this Monday, and the Nonfarm Payroll report next Friday. As for the technical picture, the price has accelerated its decline after breaking below a now flat 20 SMA, while the technical indicators have lost partially their bearish steam near oversold levels, but keep pressuring lower. In the 4 hours chart, spot is poised to continue falling given that the 20 SMA has extended below its 100 and 200 SMAS, while the technical indicators hover near oversold readings, with limited bearish slopes.
Support levels: 1,212.30 1,203.50 1,190.90
Resistance levels: 1,225.50 1,233.40 1,245.60
WTI CRUDE
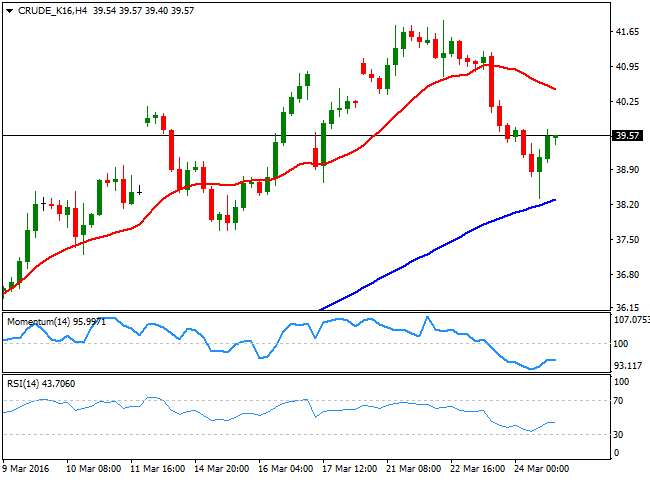
Crude oil prices, but reversed course in thin European trading and closed the day flat. West Texas Intermediate futures traded as low as $38.32 a barrel before closing the week around 39.50, getting a boost from news that smaller oil producing nations make deeper cuts to output than those estimated by the International Energy Agency. According to the latest data, in countries like Russia, Canada and Mexico the net oil production is declining by 220,000 barrels a day, compared to a decline of just 50,000 barrels a day initially estimated. The news, alongside with the latest US Baker Hughes report showing that US drilling rigs fell by 15 last week, may help the commodity to extend its advance closer to $50.00 a barrel, in spite of dollar's strength. The daily chart for WTI shows that oil met buying interest on a test of a sharply bullish 20 SMA, whilst the technical indicators turned back higher from near their midlines, after correcting overbought readings. In the 4 hours chart, the technical indicators have also corrected oversold conditions, but lack directional strength within negative territory, while the price remains below a bearish 20 SMA, indicating limited upward scope as long as the price remains below the critical 40.00 level.
Support levels: 39.10 38.30 37.60
Resistance levels: 39.90 40.40 41.10
DAX
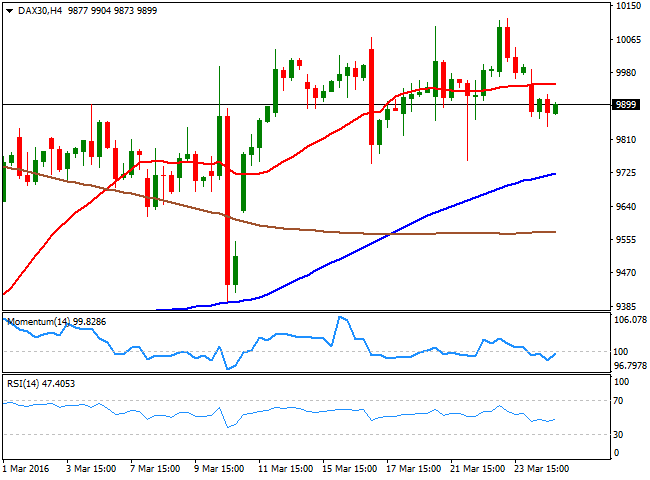
European stocks' markets remained closed on Friday, with the DAX latest close registered at 9,851.35. The holiday will extend into Monday, which means liquidity will remain extremely low, but for some electronic trading, given that Wall Street will work normally. In Europe, most major benchmarks closed in the red last week, as improved sentiment towards the greenback added to a slump in commodities' prices. The Stoxx 600 capped its longest losing streak in six weeks as investors wait for the European earnings season, while concerns over what the FED will do next also weighed on sentiment. Technically, the latest available readings show that in the daily chart, the index has been unable to hold gains beyond the 10,000 critical level, whilst the latest advances stalled below the 100 DMA, indicating speculators are not yet ready for a bullish continuation. In the same chart, the technical indicators head lower above their midlines while the 20 SMA provides a strong dynamic support around 9,810. In the 4 hours chart, the short term downside potential is limited, as the index is a few points below a horizontal 20 SMA, while the technical indicators have turned slightly higher within bearish territory.
Support levels: 9,873 9,810 9,756
Resistance levels: 9,924 9,9990 10,044
DOW JONES
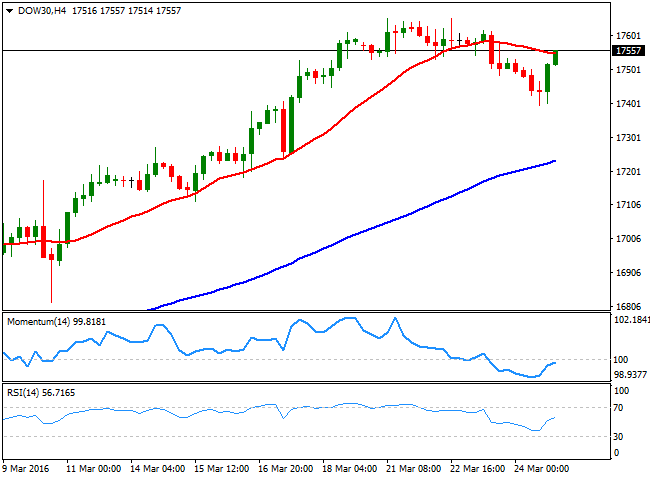
Wall Street was closed last Friday, but will resume its activity on Monday, as America does not observe Easter Monday. The DJIA closed the week at 17,515.73, posting its first weekly loss since midFebruary, as FED's officers surprised investors with some hawkish statements in regards of the upcoming economic policy decisions, pretty much opening doors for an April rate hike. The index however, held near its highest for this year, establish this March at 17,652, as investors are quite reluctant to believe the US Central Bank will raise rates next month. The upward revision to US GDP on Friday may help the index to advance this Monday, particularly if risk appetite surges during Asian trading hours. As for the technical picture, the daily chart shows that the RSI indicator remains within overbought territory, while the index is far above its moving averages, all of which keeps favoring the upside. In the shorter term, the latest available 4 hours chart presents a neutral stance, given that the index is stuck around a horizontal 20 SMA, while the technical indicators hover around their midlines.
Support levels: 17,502 17,440 17,396
Resistance levels: 17,581 17,644 17,728
FTSE 100
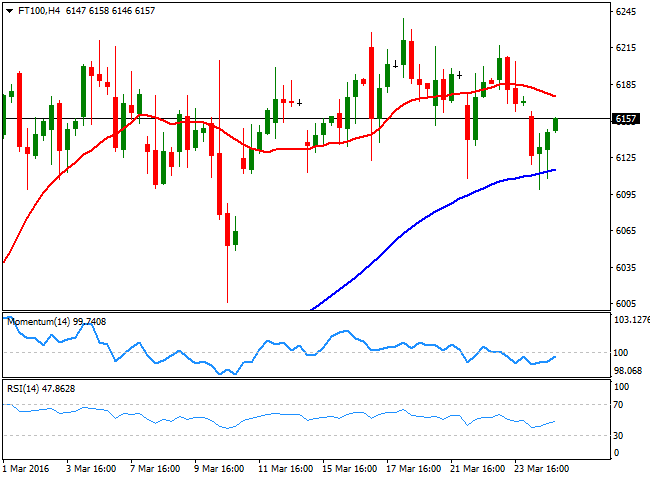
The FTSE 100 closed the shortened week at 6,106.48, tumbling on Thursday as oil prices fell back below $40.00 a barrel. The index has shown little directional momentum over the past two weeks, but on Thursday, the benchmark reached a fresh 2week low of 6,099 before recovering, which increased the risk of a bearish move. Also, and according to the daily chart, the technical indicators have erased the overbought conditions reached late February and the Momentum is crossing its midline towards the downside as the index struggles around its 20 SMA, overall, not a good sign for bulls. In the 4 hours chart, the risk is also towards the downside, according to the latest available data, the index is below a mild bearish 20 SMA, while the technical indicators aim higher within negative territory. Given the latest recovery in oil prices, and the good news coming from the US and China over the weekend, the index may see some limited gains this Monday, but it still needs to advance at least beyond 6,239, March high, to be able to perform a more sustainable recovery.
Support levels: 6,112 6,075 6,037
Resistance levels: 6,239 6,268 6,326
The information set forth herein was obtained from sources which we believe to be reliable, but its accuracy cannot be guaranteed. It is not intended to be an offer, or the solicitation of any offer, to buy or sell the products or instruments referred herein. Any person placing reliance on this commentary to undertake trading does so entirely at their own risk.
Recommended Content
Editors’ Picks
EUR/USD clings to daily gains above 1.0650

EUR/USD gained traction and turned positive on the day above 1.0650. The improvement seen in risk mood following the earlier flight to safety weighs on the US Dollar ahead of the weekend and helps the pair push higher.
GBP/USD recovers toward 1.2450 after UK Retail Sales data

GBP/USD reversed its direction and advanced to the 1.2450 area after touching a fresh multi-month low below 1.2400 in the Asian session. The positive shift seen in risk mood on easing fears over a deepening Iran-Israel conflict supports the pair.
Gold holds steady at around $2,380 following earlier spike

Gold stabilized near $2,380 after spiking above $2,400 with the immediate reaction to reports of Israel striking Iran. Meanwhile, the pullback seen in the US Treasury bond yields helps XAU/USD hold its ground.
Bitcoin Weekly Forecast: BTC post-halving rally could be partially priced in Premium

Bitcoin price shows no signs of directional bias while it holds above $60,000. The fourth BTC halving is partially priced in, according to Deutsche Bank’s research.
Week ahead – US GDP and BoJ decision on top of next week’s agenda

US GDP, core PCE and PMIs the next tests for the Dollar. Investors await BoJ for guidance about next rate hike. EU and UK PMIs, as well as Australian CPIs also on tap.
