EUR/USD
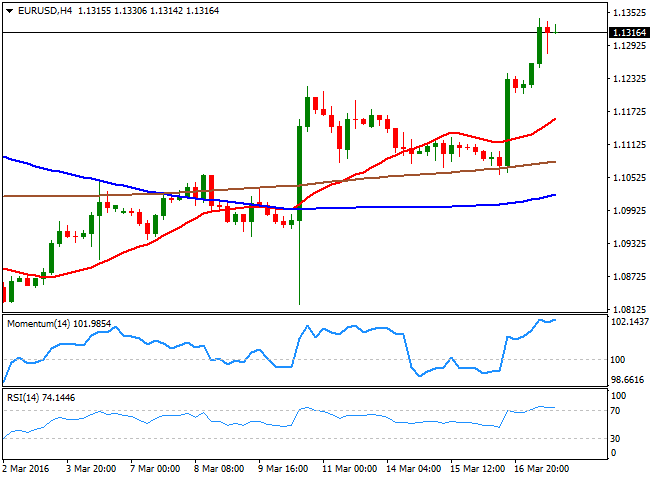
It was another bad day for dollar's bulls, as the negative momentum of the American currency extended all through the board, sending most of its counterparts to fresh multi month highs. The EUR/USD pair extended its gains up to 1.1341, its highest in over a month, helped by some positive local data, as the EU inflation surged 0.2% in February, beating estimates and back in positive ground, although the yearonyear figure showed a 0.2% slide as expected. Also in Europe, the international trade in goods posted a surplus of €6.2B, as imports fell by 1% and exports decreased 2% during the same month. In the US, the current account deficit narrowed from an upwardly revised reading in Q3, down to $125.3B, while weekly unemployment claims resulted at 265K for the week ending March 11th, beating expectations of 268K. The Philadelphia FED Manufacturing survey was also pretty encouraging, up to 12.4 from previous 2.8. Nevertheless, the extremely cautious tone of Yellen last Wednesday maintained the dollar in selloff mode for a second day inarow. The EUR/USD pair fell down to 1.1277 during the American afternoon, but quickly regained the 1.1300 level, indicating investors are willing to buy on dips. The technical picture continues favoring the upside, as in the 4 hours chart, the technical indicators keep heading higher, despite being in overbought territory. Friday may bring some profit taking, but with the Central Banks done for this month, the pullback will likely be limited. Should the rally extend beyond 1.1375, February high, the pair has scope to test the 1.1460 region, the level that capped the upside for most of the last 2015.
Support levels: 1.1290 1.1245 1.1200
Resistance levels: 1.1340 1.1375 1.1410
GBP/USD
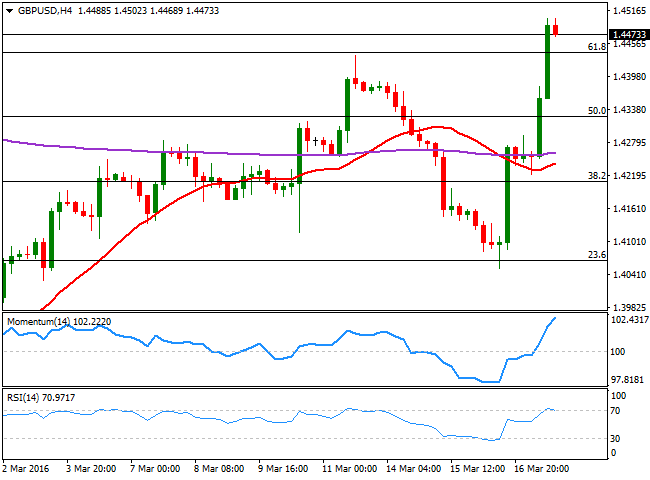
The British Pound skyrocketed, outperforming its major rivals, and reaching 1.4502 against the greenback, the highest since February 16th. The BOE announced its latest economic policy decisions this Wednesday, will all nine members voting to keep rates unchanged at 0.5%, and the Assets Purchase Program at £375 billion. The BOE also warned that the uncertainty surrounding a Brexit, represents a downward risk for the economy in the months ahead of the vote, and will likely weigh on Sterling. The GBP/USD retreated after these comments, but only to jump higher on broad dollar weakness. Currently trading above the 61.8% retracement of this year's decline, the short term picture is bullish for the pair, as the technical indicators have resumed their advances well into overbought territory, after a limited downward correction, whilst the 20 SMA heads sharply higher below the current level. In the 4 hours chart, the Momentum indicator keeps heading north within overbought territory, but the RSI indicator has lost its upward strength, rather suggesting some consolidation ahead than supporting a downward move.
Support levels: 1.4445 1.4410 1.4370
Resistance levels: 1.4510 1.4550 1.4590
USD/JPY
The USD/JPY pair fell to its lowest in a year and a half this Thursday, pricing 110.66 before some market talks about a possible BOJ intervention sent it up to test the 112.00 level. The Japanese yen gained ever since the day started, in spite the country reported a smallerthanexpected trade surplus in February of ¥242.8B although still showing improvement, compared to January. The drop in US yields and the weakening greenback were behind the decline, fueled by the strong negative opening in European equities. After the dust settled, the pair resumed its slide, now hovering around 111.40, and with the 1 hour chart showing that the 100 and 200 SMAs have accelerated their declines far above the current level, while the technical indicators have bounced from overbought levels, but remain within negative territory, rather following the latest upward corrective move than suggesting the pair may advance further. In the 4 hours chart, the technical indicators also corrected oversold readings, but have lost upward strength well below their midlines, in line with the shorter term outlook. The risk remains towards the downside, with another slide below 111.00 opening doors for a continued decline towards the 110.00 psychological support.
Support levels: 111.00 110.65 110.20
Resistance levels: 111.65 112.00 112.35
GOLD
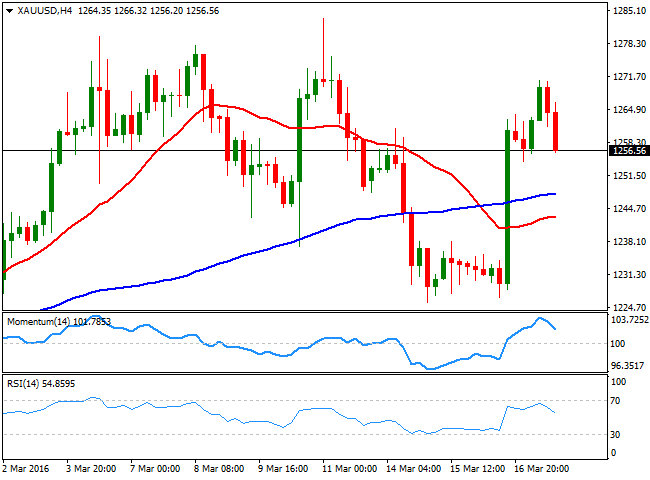
The strong gains in the aftermath of the latest FOMC announcement, extended up to $1,270.90 a troy ounce for spot gold, with the rally fueled as stocks declined during the first half of the day. But as European equities trimmed losses and Wall Street gained, the commodity came under selling pressure, and trades around $1,256.00 by the end of the US session, a couple of dollars below its daily opening. The bright metal maintains a long term positive outlook, and beyond intraday corrections, the latest FED's decision favors a continued advance in the weeks to come. Technically, the daily chart shows that the price has held well above a bullish 20 SMA, while the Momentum indicator resumed its advance within positive territory, and the RSI indicator hovers around 58, lacking directional strength. In the 4 hours chart, the technical indicators are retreating from near overbought levels, while the price remains above its moving averages, suggesting some further downward corrections in the short term, towards the 1,240 region.
Support levels: 1,252.10 1,240.90 1,233.15
Resistance levels: 1,265.40 1,275.70 1,283.50
WTI CRUDE
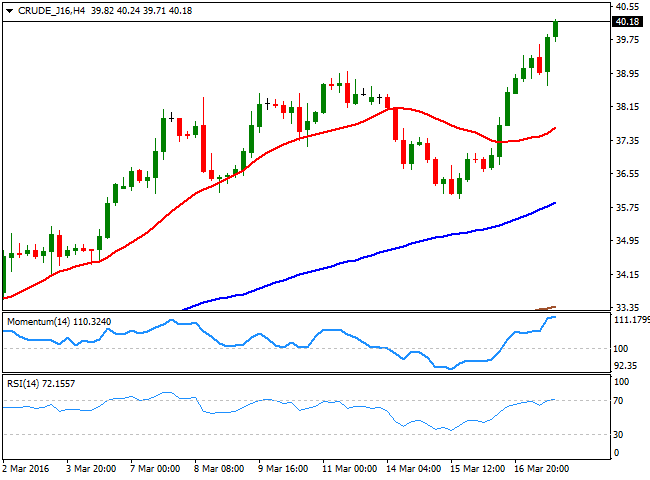
Crude oil prices surged to fresh year highs as the dollar kept sliding postFED, with the commodity also supported by renewed hopes on an output freeze agreement between OPEC and nonOPEC oil producers. West Texas Intermediate crude oil futures rallied up to $40.24 a barrel late in the US afternoon, and hold on to gains by the end of the day, indicating the possibility of a continued recovery for this Friday. The daily chart shows that the price is nearing a bearish 200 DMA, currently at 40.40, with some further advances beyond it confirming a steeper recovery. In the same chart, the technical indicators have resumed their advances, presenting strong bullish slopes near overbought territory. Shorter term, and according to the 4 hours chart, the upside is also favored, although the technical indicators are losing their upward strength. Nevertheless, with the price a few cents below its daily high and the price well above its moving averages, chances are also towards the upside in the shorter term.
Support levels: 39.70 39.10 38.60
Resistance levels: 40.40 41.10 41.80
DAX
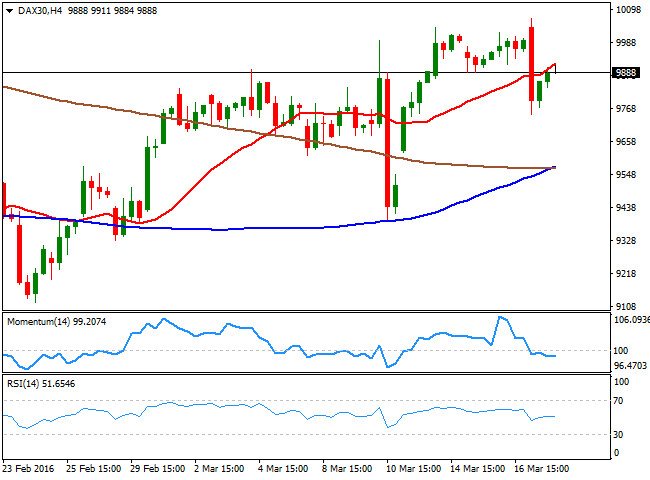
European equities fell big on Thursday, although most of the major indexes managed to trim most of their daily losses before the close. The German DAX closed 0.91% lower at 9,892.20, with the decline led by the carmakers sector, as BMW and Daimler shed over 1.5% due to a stronger EUR affecting the exporters companies. Mining shares, however, were benefited by a weaker greenback. Failure to hold gains above the 10,000 level may hit investor's sentiment and if the index continues failing to recover beyond it, the benchmark may well return towards the 9,000 region during the upcoming weeks. In the daily chart, the index has stalled its decline above a bullish 20 SMA, while the technical indicators have turned south within positive territory, still far from supporting a bearish breakout. In the 4 hours chart, the index is currently below a bullish 20 SMA, whilst the technical indicators lack directional strength below their midlines, maintaining the upside limited in the short term.
Support levels: 9,839 9,773 9,722
Resistance levels: 9,938 10,010 10,069
DOW JONES
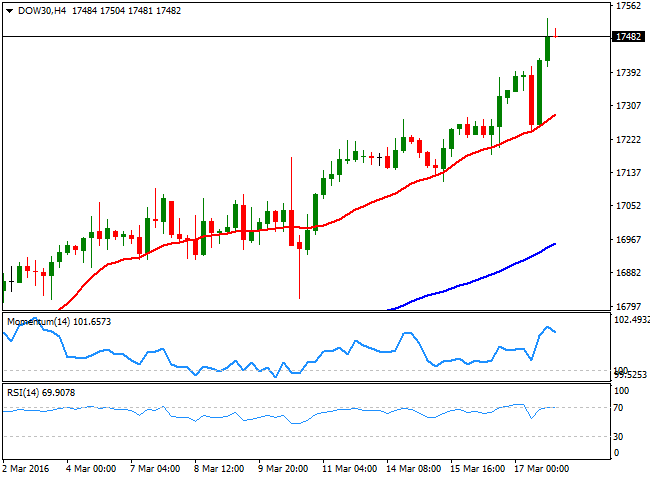
Wall Street continued advancing on Thursday, with the Dow Jones Industrial Average reversing all of its 2016 losses and entering positive ground. The index added 155 points or 0.90% to close the day at 17,481.49, while the Nasdaq advanced another 0.23% to end at 4,779.99 and the S and P added 13 points, to 2,040.59. US stocks´ gains were driven by higher oil prices that boosted the energy sector, whilst the dovish outcome of the Federal Reserve meeting, also weighed on investor's mood. The index hovers around 17,500 after the close, having advanced for fifth day inarow above its 100 and 200 DMAs. In the daily chart, the RSI indicator maintains a bullish slope around 75, although the Momentum indicator diverges from price action, turning lower within positive territory. Shorter term, and in the 4 hours chart, the technical indicators have lost upward strength near overbought territory, as a consequence of the sharp decline in volume after the close, but the index kept meeting buying interest on dips towards a bullish 20 SMA, indicating the bullish tone will likely prevail this Friday.
Support levels: 17,426 17,345 17,251
Resistance levels: 17,529 17,600 17,665
FTSE 100
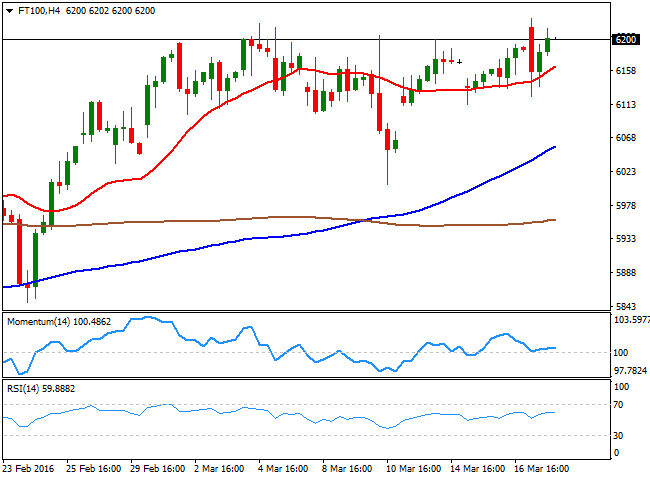
The FTSE 100 posted a modest advance, up 25 points or 0.42% to close at 6,201.12, with the commodityrelated sector leading the advance. A weaker dollar has supported gains in oil and base metal, which resulted in related stocks posting some solid gains. The best performers were Anglo American that advanced 9.8%, and Glencore up by 8.5%. The index posted a fresh year high of 6,228, before retreating, now entering the Asian session around the 6,200 level. Footsie traders however, seem to lack conviction, as in the daily chart, the technical indicators have lost their upward momentum and continued approaching their midlines. In the same chart, the 20 SMA and the 100 SMA converge around 6,100, and a break below it will open doors for further declines towards sub 6,000 level. The 4 hours chart shows that the index has managed to hold above a mild bullish 20 SMA, but that the technical indicators maintain a neutral stance, indicating the possibility of some consolidation/downward correction for this Friday.
Support levels: 6,112 6,075 6,037
Resistance levels: 6,228 6,300 6,346
The information set forth herein was obtained from sources which we believe to be reliable, but its accuracy cannot be guaranteed. It is not intended to be an offer, or the solicitation of any offer, to buy or sell the products or instruments referred herein. Any person placing reliance on this commentary to undertake trading does so entirely at their own risk.
Recommended Content
Editors’ Picks
AUD/USD jumps above 0.6500 after hot Australian CPI data

AUD/USD extended gains and recaptured 0.6500 in Asian trading, following the release of hotter-than-expected Australian inflation data. The Australian CPI rose 1% in QoQ in Q1 against 0.8% forecast, providing extra legs to the Australian Dollar upside.
EUR/USD holds above 1.0700 on weaker US Dollar, upbeat Eurozone PMI

EUR/USD holds above the 1.0700 psychological barrier during the early Asian session on Wednesday. The weaker-than-expected US PMI data for April drags the Greenback lower and creates a tailwind for the pair.
Gold price cautious despite weaker US Dollar and falling US yields

Gold retreats modestly after failing to sustain gains despite fall in US Treasury yields, weaker US Dollar. XAU/USD struggles to capitalize following release of weaker-than-expected S&P Global PMIs, fueling speculation about potential Fed rate cuts.
Ethereum ETF issuers not giving up fight, expert says as Grayscale files S3 prospectus

Ethereum exchange-traded funds theme gained steam after the landmark approval of multiple BTC ETFs in January. However, the campaign for approval of this investment alternative continues, with evidence of ongoing back and forth between prospective issuers and the US SEC.
US versus the Eurozone: Inflation divergence causes monetary desynchronization

Historically there is a very close correlation between changes in US Treasury yields and German Bund yields. This is relevant at the current juncture, considering that the recent hawkish twist in the tone of the Fed might continue to push US long-term interest rates higher and put upward pressure on bond yields in the Eurozone.
