EUR/USD
The American dollar mostly higher across the board, with the exception of the JPY that appreciated after the latest BOJ's economic policy announcement. The greenback also failed to appreciate against the common currency, as the pair held around the 1.1100 figure, rangebound, ahead of the US Federal Reserve meeting outcome this Wednesday . The US Central Bank is largely expected to remain on hold, but this particular meeting will include the updated projections of its funds target rate and economic situation, whilst Janet Yellen will offer a press conference, in where speculators will be looking for clues on a date for a forthcoming rate hike. Data coming from the US earlier today was quite disappointing, as retail sales for February fell 0.1% monthly basis, below expectations, whilst the PPI for final demand fell 0.2% in the same month, seasonally adjusted. On an un adjusted basis, the final demand index was unchanged for the 12 months ended in February, with downward revisions to previous readings. The pair jumped up to 1.1124 following the news, after extending its weekly decline down to 1.1071, but was unable to rally and settled around 1.1100, where it stands ahead of the Asian opening. The common currency maintains a positive bias, given that with few exceptions, the dollar traded broadly higher, and EUR buyers refused to give up. The fact that the pair held suggests that speculators are still looking for higher highs. The technical picture is for the most neutral in the short term, as in the 4 hours chart, the price recovered strongly on approaches to the 1.1065 level, the 38.2% retracement of the post ECB rally, whilst the technical indicators hover around their midlines, with little directional strength. The upcoming direction will depend on whether the FED is still in track of rising rates, which may see the pair down to 1.1000, or if not, which will result in a rally up to 1.1245.
Support levels: 1.1065 1.1020 1.0980
Resistance levels: 1.1120 1.1160 1.1200
GBP/USD
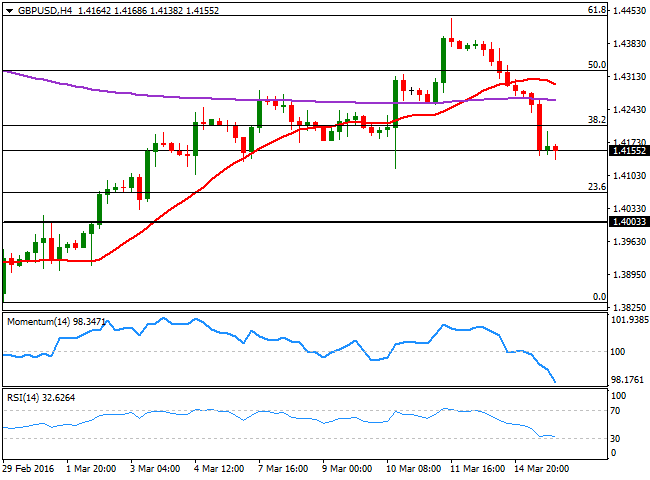
The Sterling was hit hard by renewed concerns over a possible Brexit, as latest polls showed that voters supporting the Brexit are more willing to vote in the forthcoming referendum than those against it, giving a decisive edge to the final result. The GBP/USD pair plummeted to 1.4140 in the American afternoon, and poor US data was not even enough to give the Pound a break, given that a spike towards 1.4200 saw selling interest resuming. This Wednesday, the UK will release its latest labor market data, and the market will likely focus in wages, still far below their precrisis average. Wages are expected to post a modest advance, seen at 2.0% from previous 1.9%, yet if the final number disappoint, the pair may well extend its decline towards the 1.4000 level. The technical picture is clearly bearish, given that, after being rejected by the 61.8% retracement of this year's slide around 1.4440, the pair accelerated its decline below the 38.2% retracement of the same rally at 1.4210, now a critical resistance level. Also, and according to the 4 hours chart, the technical indicators head sharply lower near oversold territory, whilst the price accelerated lower after breaking below its 200 EMA, all of which supports a continued decline on a break below 1.4130, the immediate support.
Support levels: 1.4130 1.4090 1.4050
Resistance levels: 1.4210 1.4260 1.4300
USD/JPY
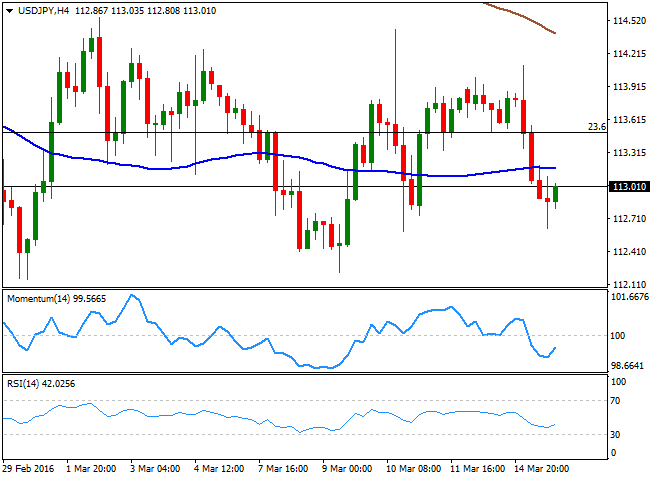
The USD/JPY pair fell down to 112.62, weighed at the beginning of the day by the BOJ, and later by soft US data. In Asia, the Japanese Central Bank decided to maintain its benchmark interest rate on hold at 0.1% and the annual purchases of financial assets at ¥80tn a year. Governor Kuroda, however, said that more asset purchases and adjustments to its negative rate remain on the table, whilst negative rates will continue as long as needed to reach the inflation goal of 2.0%, preventing the JPY from appreciating further. The pair managed to recover some ground in the American afternoon, struggling around the 113.00 level by the end of the session. The long term picture keeps favoring the downside, although a break below 112.10, the base of the pair's latest range, is required to confirm a steeper decline. In the 1 hour chart, the technical indicators head slightly higher well below their midlines, while the price is well below its 100 and 200 SMAs, both in the 113.40/50 region, maintaining the upside limited. In the 4 hours chart, the technical indicators also turned slightly higher within bearish territory, but lack momentum, with the pair most likely remaining range bound ahead of the FOMC decision this Wednesday.
Support levels: 112.60 112.10 111.70
Resistance levels: 113.50 113.90 114.40
GOLD
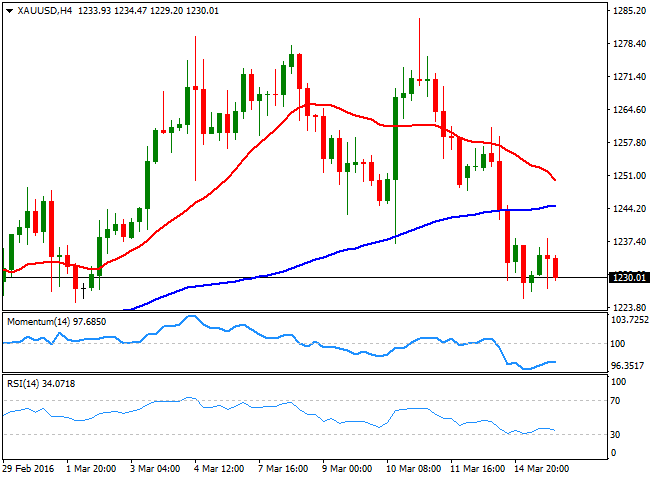
Spot gold extended its latest decline down to $1,225.60 a troy ounce this Tuesday, a fresh 2week low, but has spent most of the daily consolidating with selling interest limiting the upside on advances towards the 1,240.00 region. Gold for April delivery was weighed by broad dollar's strength ahead of the Federal Reserve meeting, as a more hawkish than expected statement will boost dollar's demand and therefore force the commodity further lower. Daily basis, the bright metal set a lower high and a lower low, while extending below its 20 SMA for the first time since early January, suggesting the downward move may extend during the upcoming days. In the same chart, the technical indicators continue heading south around their midlines, not yet confirming a downward continuation. Shorter term, the 4 hours chart presents an increasingly bearish potential, as the 20 SMA heads south, offering a dynamic resistance around 1,250,00, while the technical indicators have lost their upward potential within bearish territory, and after bouncing from oversold levels, supporting some further declines particularly on a break below the 1,220.00 region.
Support levels: 1,219.95 1,1211.10 1,202.30
Resistance levels: 1,241.10 1,248.50 1,256.80
WTI CRUDE
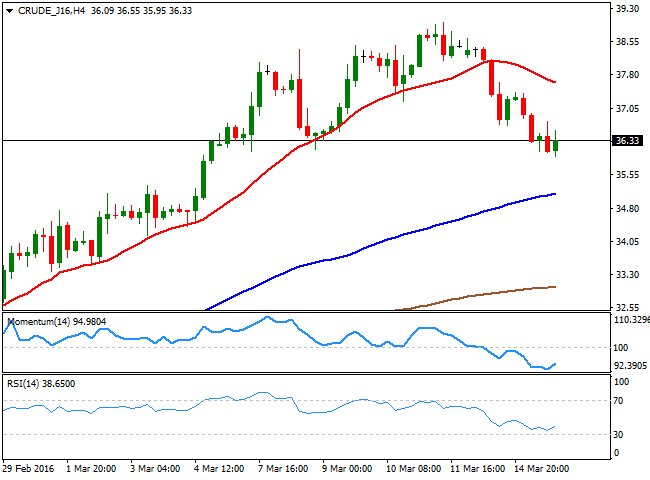
Oil prices continued retreating with light, sweet crude for April delivery down to $35.95 a barrel. A proposal to freeze crude oil production at January levels has become increasingly unlikely, and speculators returned their focus to the record stockpiles and the diminishing demand. And as the market waits for the API report later today, WTI remains subdued. The technical picture in the daily chart suggest that a test of the 35.00 region is likely, as the technical indicators have continued to retreat from overbought levels, although the price remains above the critical juncture, in where a bullish 20 SMA converges with a bearish 100 SMA. In the 4 hours chart, the latest short term decline seems to be losing steam, given that the technical indicators are bouncing from near oversold territory, whilst the latest decline, despite extending below a bearish 20 SMA, saw the price bouncing from well above a bullish 100 SMA.
Support levels: 35.90 35.10 34.45
Resistance levels: 37.20 37.80 38.40
DAX
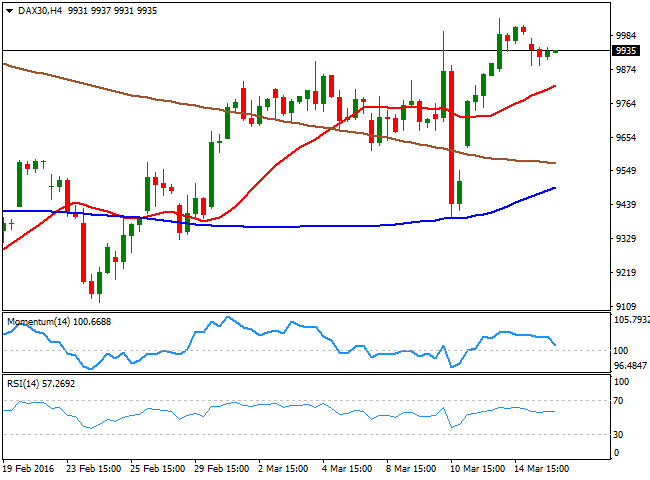
European equity markets fell on Tuesday, with the German DAX losing 56 points to close the day at 9,933.85. Risk sentiment prevailed after Asian shares' decline and commodities kept easing from its recent highs. Deutsche Bank and carmaker Volkswagen both closed 2.4% lower, while electric utility RWE led decliners with a 3.2% loss. The index traded in the lower half of is Monday's range, and despite the technical indicators have lost upward potential in the daily chart, the downside is still seen limited, given that the 20 SMA maintains its bullish slope well below the current level. The index however, has moved one step further away from its 100 DMA, currently around 10,190, and a line in the sand in the bulls bears' battle. In the 4 hours chart, the technical picture keeps favoring the upside, as the slight intraday retracement held above a bullish 20 SMA, while the RSI indicator heads slightly higher around 57.
Support levels: 9,889 9,807 9,742
Resistance levels: 9,976 10,041 10,112
DOW JONES
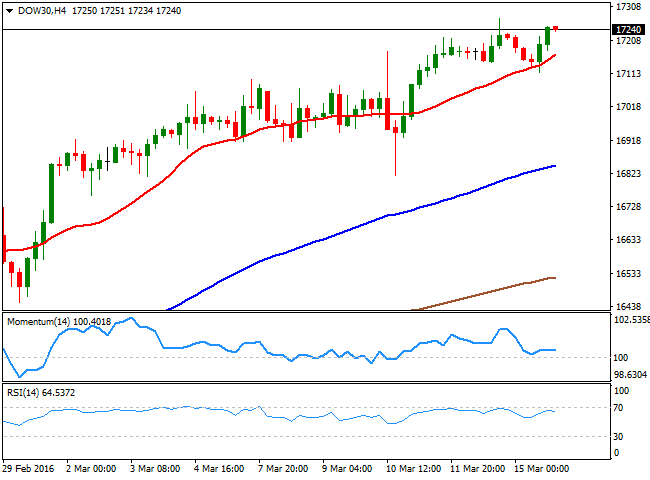
Wall Street closed uneventfully for a second day inarow, barely changed from its previous close. Stocks however, trimmed most of its early losses by the close, initially down on poor US retail sales that reignited concerns about economy's growth prospects. The Dow Jones Industrial Average closed the day 22 points higher at 17,251.53, the Nasdaq was down 45 points to 4,728.67, whilst the SandP shed 0.18%, to end at 2,015.93. The DJIA held near its recent highs, and the daily chart shows that the index remains well above its moving averages, with the 20 SMA heading sharply higher below the current level, and about to cross above the 100 DMA, a strong buying signal yet to be confirmed. In the same chart, the technical indicators remain flat near overbought levels, indicating some consolidation ahead rather than upward exhaustion. Shorter term, the 4 hours chart presents a positive tone, with the index above its 20 SMA and the indicators within positive territory, but lacking upward strength due to the restricted intraday range.
Support levels: 17,187 17,104 17,042
Resistance levels: 17,273 17,340 17,408
FTSE 100
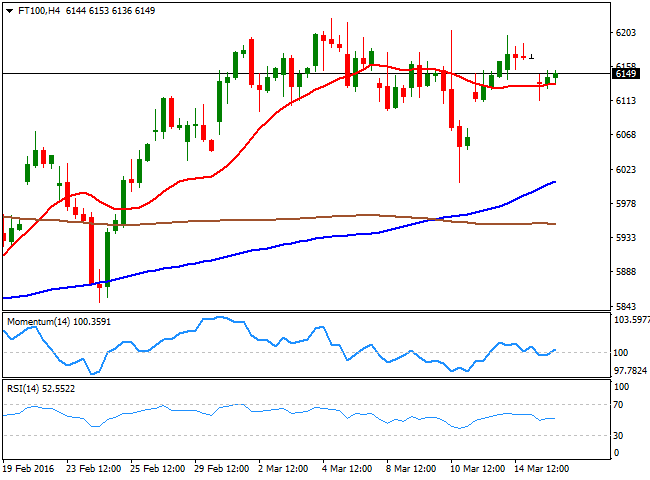
The FTSE 100 closed down 34 points at 6139.97 as risk aversion dominated the Asian and European sessions amid oil's prices extending their declines. Miners led the way lower with Antofagasta down 4.47% after the company posted a 58% drop in annual profit and cancelled its final dividend. Anglo American also fell closing down 11% whilst oilrelated companies also suffered from heavy losses with BHP Billiton shedding 6.54%. The index recovered from a dip towards its 100 DMA, while the technical indicators in the daily chart have lost upward potential, but remain well above their midlines, with no downward strength. In the 4 hours chart, the index maintains a positive tone, given that the technical indicators have managed to bounce from their midlines, but within neutral territory, whilst the index is now above its 20 SMA that anyway remains flat. Some follow through beyond the 6,220 region should provide further support to an upward continuation, while below 6,112, the immediate support, the risk turns towards the downside.
Support levels: 6,112 6,075 6,037
Resistance levels: 6,221 6,300 6,346
The information set forth herein was obtained from sources which we believe to be reliable, but its accuracy cannot be guaranteed. It is not intended to be an offer, or the solicitation of any offer, to buy or sell the products or instruments referred herein. Any person placing reliance on this commentary to undertake trading does so entirely at their own risk.
Recommended Content
Editors’ Picks
EUR/USD fluctuates near 1.0700 after US data

EUR/USD stays in a consolidation phase at around 1.0700 in the American session on Wednesday. The data from the US showed a strong increase in Durable Goods Orders, supporting the USD and making it difficult for the pair to gain traction.
USD/JPY refreshes 34-year high, attacks 155.00 as intervention risks loom

USD/JPY is renewing a multi-decade high, closing in on 155.00. Traders turn cautious on heightened risks of Japan's FX intervention. Broad US Dollar rebound aids the upside in the major. US Durable Goods data are next on tap.
Gold keeps consolidating ahead of US first-tier figures

Gold finds it difficult to stage a rebound midweek following Monday's sharp decline but manages to hold above $2,300. The benchmark 10-year US Treasury bond yield stays in the green above 4.6% after US data, not allowing the pair to turn north.
Worldcoin looks set for comeback despite Nvidia’s 22% crash Premium

Worldcoin price is in a better position than last week's and shows signs of a potential comeback. This development occurs amid the sharp decline in the valuation of the popular GPU manufacturer Nvidia.
Three fundamentals for the week: US GDP, BoJ and the Fed's favorite inflation gauge stand out Premium

While it is hard to predict when geopolitical news erupts, the level of tension is lower – allowing for key data to have its say. This week's US figures are set to shape the Federal Reserve's decision next week – and the Bank of Japan may struggle to halt the Yen's deterioration.

