EUR/USD
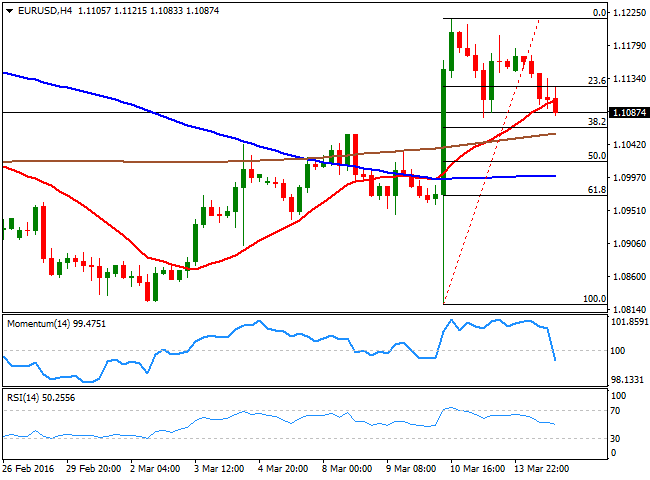
The greenback edged higher against all of its major rivals, benefited by a return of risk appetite, and strong profit taking ahead of several Central Banks decision, including the BOJ, the FED and the BOE. The dollar however, maintains its long term negative tone and this latest recovery seems barely corrective. The EU released its Industrial Production data, showing an increase of 2.1% monthly basis in January, a positive surprise that failed to boost the EUR. All eyes are now on the US Federal Reserve economic policy meeting next Wednesday. The FOMC seems more concern over the global developments than by the local woes, but there is a considerable uncertainty on whether the Central Bank may remain on hold, or open doors for a rate hike in June, which means majors will likely remain range bound ahead of the release. The EUR/USD eased further from the high set last week at 1.1217, and broke below the 1.1100 figure ahead of Wall Street's close, heading towards the 38.2% retracement of the post ECB rally at 1.1065, the immediate support. The technical readings in the 4 hours chart show that the price is now extending below a bullish 20 SMA, while the technical indicators head sharply lower below their midlines, limiting chances of a sudden recovery for the upcoming Asian session. Should the price extend its decline below the mentioned Fibonacci support, the most likely scenario is a continued slide towards the 1.1000 figure for this Tuesday.
Support levels: 1.1065 1.1020 1.0980
Resistance levels: 1.1120 1.1160 1.1200
GBP/USD
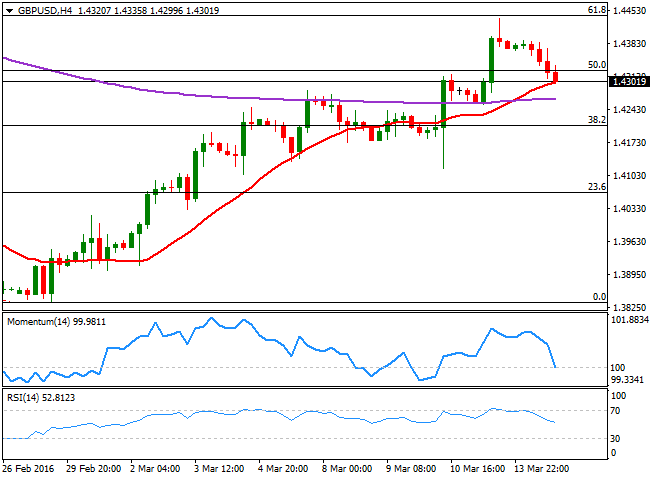
The GBP/USD pair flirted with the 1.4300 level this Monday, tracking a decline in oil prices and with no local data to underpin the Pound. The macroeconomic calendar, however, will be more interesting starting next Wednesday, when the UK will release its February employment data. Also, the Bank of England will have its economic policy meeting next Thursday, largely expected to maintain the status quo. Many market players believe that the pair is undervalued, but it topped out last week at a major resistance level, the 61.8% retracement of this year's decline, between 1.4815 and 1.3835, and to confirm a continued advance the pair needs to regain the 1.4450 level. In the meantime, the 1 hour chart presents a clear short term bearish tone, as the technical indicators head sharply lower near oversold levels, whilst the pair is extending its decline below a bearish 20 SMA. In the 4 hours chart, the price is pressuring a bullish 20 SMA, while the technical indicators have turned sharply lower around their midlines, increasing the risk of further declines, particularly on a break below 1.4260, the 200 EMA and the immediate support.
Support levels: 1.4260 1.4225 1.4170
Resistance levels: 1.4330 1.4370 1.4415
USD/JPY
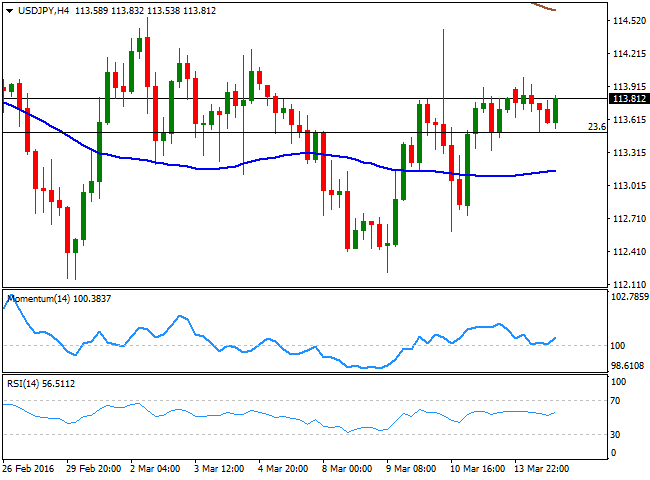
The USD/JPY pair traded within a limited range at the beginning of the week, meeting short term buying interest around the strong static support at 113.50, the 23.6% retracement of the latest daily bearish run. Ahead of the monetary policy meeting of the Bank of Japan, the pair maintains a neutral technical stance, having been unable to leave the 112.10/114.60 for the past two weeks. The BOJ is largely expected to leave its economic policy unchanged, while Governor Kuroda will likely reiterate that the country's is economy is doing well and heading towards the 2.0% inflation target, to be reached by mid 2017. Unless he is able to provide a surprise, the pair is not expected to react to the news, but continue to trade on sentiment. Technically, the short term picture presents a limited positive tone, as in the 1 hour chart, the price held above its moving averages, whilst the technical indicators head slightly higher above their midlines. In the 4 hours chart, the technical stance is neutral, with the technical indicators barely bouncing from their midlines, but lacking enough strength to confirm a new leg higher.
Support levels: 113.50 113.10 112.70
Resistance levels: 114.00 114.60 115.05
GOLD
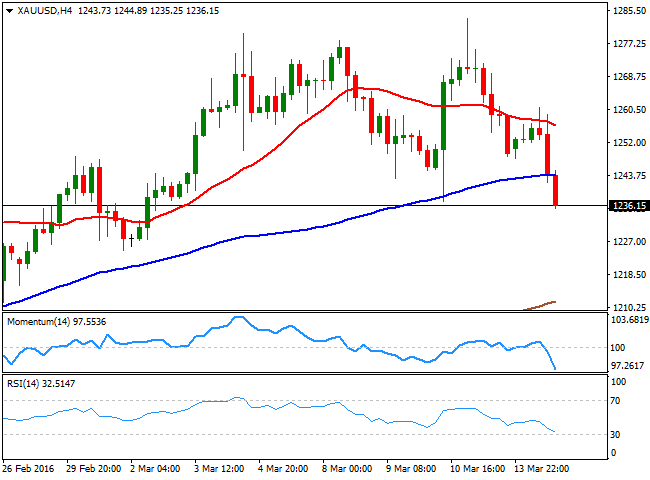
Gold prices sank on Monday as investors seek for riskier assets, while taking profits ahead of the upcoming US Federal Reserve twoday meeting. Spot gold fell down to the $1,236.00 a troy ounce price zone, reaching its lowest since March 2nd. The bright metal has been presenting a strong correlation with FED's decisions for over a year now, falling on chances that the Central Bank may tighten its economic policy, and rising on hopes it will remain on hold. Given that recent data in the US has been encouraging compared to December ones, odds of a rate hike have increased to nearly 50% for next June, when two months ago, the market was convinced the FED wouldn't move this 2016, therefore sending gold lower. The commodity is down for a second day inarow, but is far from suggesting an interim top, given that the daily chart shows that the price remains well above the 100 and 200 SMAs, both in the 1,130 region. In the same chart however, the price is below its 20 SMA for the first time since early January, while the technical indicators are heading south, approaching their midlines, suggesting a continued decline below the 1,200 level may open doors for a bearish extension. Shorter term, the 4 hours chart presents a strong bearish tone, given that the technical indicators head south almost vertically within bearish territory, while the price has remained capped below a mild bearish 20 SMA.
Support levels: 1,232.15 1,219.95 1,1211.10
Resistance levels: 1,241.10 1,248.50 1,256.80
WTI CRUDE
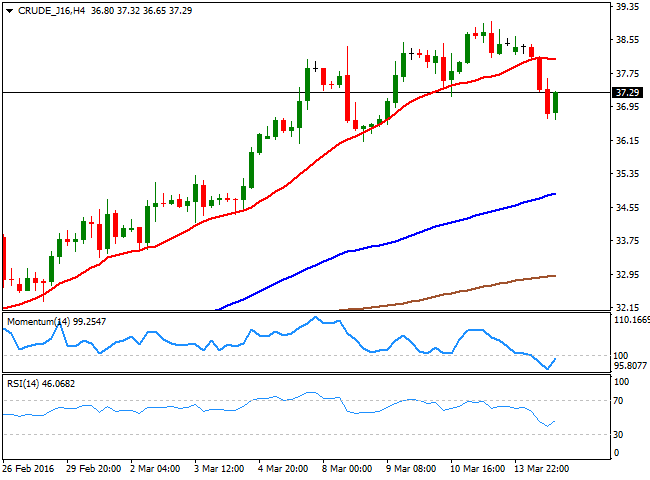
Crude oil prices edged lower on Monday, weighed by news that the OPEC and nonOPEC oil producers meeting has been delayed to April, and that Iran is planning to raise its crude production before they consider joining the output freeze. Speculators may rethink their latest bullish positions on such news, as the background macroeconomic picture that sent the commodity below $30.00 a barrel has only worsened during the last few weeks. The black gold fell down to 36.65 intraday before recovering above the 37.00 figure, and the daily chart for WTI shows that the price is well above its 20 and 100 SMAs, both around 34.70. In the same chart, the technical indicators have retreated from overbought territory, but remain well above their midlines, indicating limited selling interest at the time being. In the 4 hours chart, the technical indicators have lost their bearish strength, turning slightly higher within bearish territory, whilst the 20 SMA caps the upside around 38.60.
Support levels: 36.60 35.90 35.20
Resistance levels: 37.60 38.40 39.10
DAX
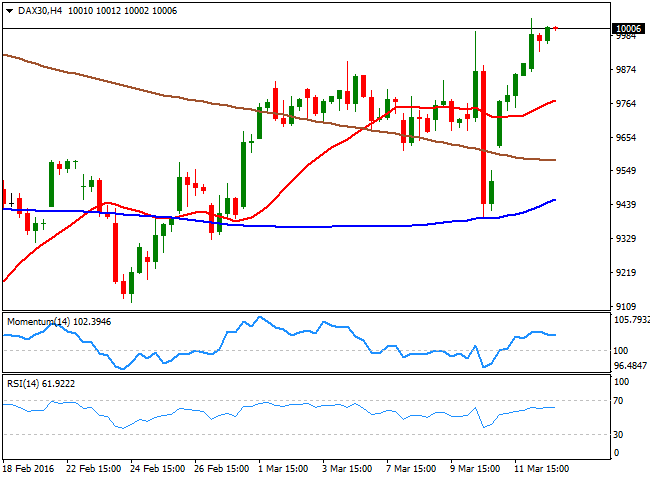
European markets rose with the DAX closing the day up 1.62% or 161 points to close at 9,990.26. The German benchmark flirted with the 10,000 level for the first time since early January, rallying on the back of the fresh round of stimulus announced last week by the ECB. Mining related shares led the way higher, but oil related ones lagged, as oil came under renewed selling pressure on diminishing hopes of a production freeze. The index presents a strong bullish potential in the daily chart, given that the 20 SMA heads sharply higher below the current level, while the technical indicators have extended their advances above their midlines, although it remains below the 100 DMA, currently at 10,194, the level to beat to confirm a more sustainable recovery. Shorter term, the technical indicators in the 4 hours chart have turned lower after approaching overbought levels, but remains firm above its moving averages, all of which limits chances of a downward move for this Tuesday.
Support levels: 9,934 9,863 9,787
Resistance levels: 10,041 10,112 10,194
DOW JONES
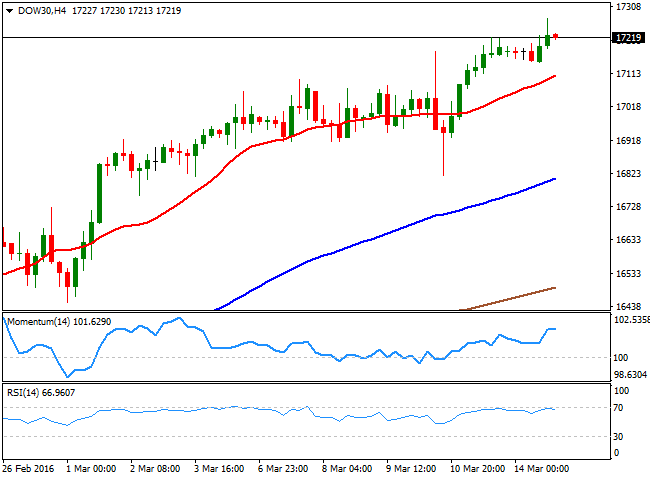
US indexes closed the day pretty much unchanged, with the DJIA up 15 points to close at 17,229.13, the Nasdaq adding 1 point to 4,750.28 and the S and P losing 0.13% to 2,019.64. Stocks ended flat as commodity related shares retreated alongside with oil in the American afternoon, but the consumer discretionary bloc surged. McDonald’s was up 1.3%, leading the advance in the Dow. Investors are in cautious mode ahead of the upcoming FED's announcement on economic policy this Friday, largely expected to remain on hold. The DJIA managed to extend its recent rally to fresh highs not seen since early January in the 17,200 region, resuming its latest advance and with the daily chart supporting a continued rally, given that the index has accelerated above its moving averages, whilst the technical indicators turned higher within bullish territory. In the 4 hours chart, the lack of upward momentum persists, with the indicators holding flat above their midlines, and the 20 SMA maintaining its bullish tone below the current level.
Support levels: 17,187 17,104 17,042
Resistance levels: 17,273 17,340 17,408
FTSE 100
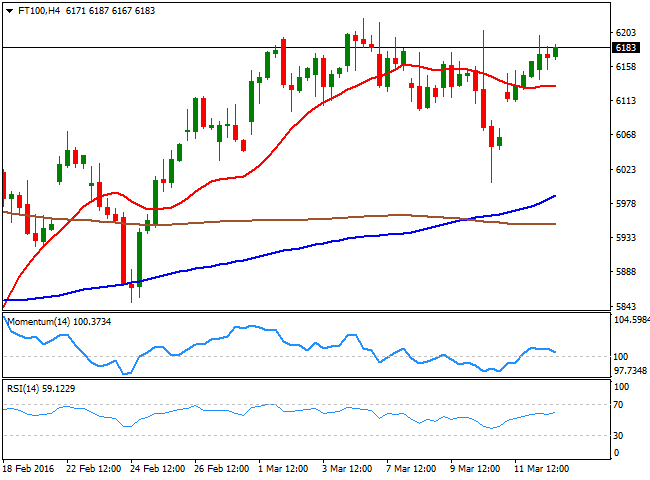
The FTSE 100 advanced 34 points at the beginning of the week to close at 6,174.57, with mining shares leading the way higher, as commodities started the day with a strong footing, despite the poor industrial production figures coming from China, which may affect demand of basic resources. Anglo American led the way higher by adding 5.99%, followed by Glencore that jumped 4.38%. Oil shares however, closed in the red, with BP down 0.85% and Royal Dutch Shell losing 0.1%. The index continues to make little progress from a technical point of view, still holding above its 100 DMA, but within its previous weeks' range, and with the technical indicators showing no directional strength, but holding above their midlines. In the shorter term the 4 hours chart also presents a neutral stance, with the technical indicators hovering around their midlines and the 20 SMA flat around 6,132.
Support levels: 6,132 6,075 6,037
Resistance levels: 6,221 6,300 6,346
The information set forth herein was obtained from sources which we believe to be reliable, but its accuracy cannot be guaranteed. It is not intended to be an offer, or the solicitation of any offer, to buy or sell the products or instruments referred herein. Any person placing reliance on this commentary to undertake trading does so entirely at their own risk.
Recommended Content
Editors’ Picks
EUR/USD regains traction, recovers above 1.0700

EUR/USD regained its traction and turned positive on the day above 1.0700 in the American session. The US Dollar struggles to preserve its strength after the data from the US showed that the economy grew at a softer pace than expected in Q1.
GBP/USD returns to 1.2500 area in volatile session

GBP/USD reversed its direction and recovered to 1.2500 after falling to the 1.2450 area earlier in the day. Although markets remain risk-averse, the US Dollar struggles to find demand following the disappointing GDP data.
Gold climbs above $2,340 following earlier drop

Gold fell below $2,320 in the early American session as US yields shot higher after the data showed a significant increase in the US GDP price deflator in Q1. With safe-haven flows dominating the markets, however, XAU/USD reversed its direction and rose above $2,340.
XRP extends its decline, crypto experts comment on Ripple stablecoin and benefits for XRP Ledger

Ripple extends decline to $0.52 on Thursday, wipes out weekly gains. Crypto expert asks Ripple CTO how the stablecoin will benefit the XRP Ledger and native token XRP.
After the US close, it’s the Tokyo CPI

After the US close, it’s the Tokyo CPI, a reliable indicator of the national number and then the BoJ policy announcement. Tokyo CPI ex food and energy in Japan was a rise to 2.90% in March from 2.50%.
