EUR/USD
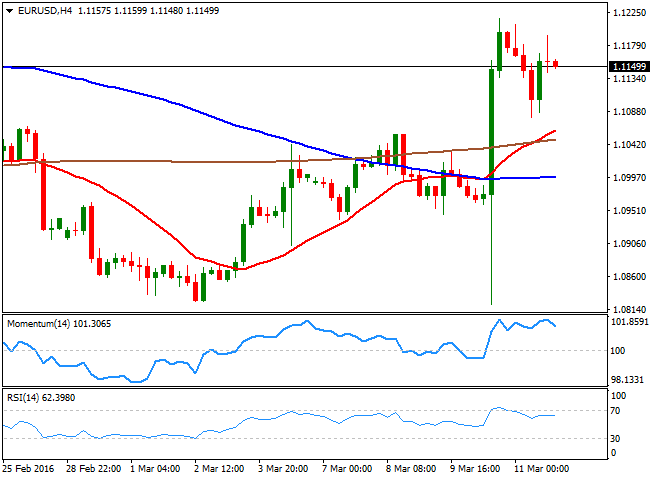
The dollar continued in sell mode ahead of the FED's economic policy meeting, with the EUR/USD pair trading as high as 1.1217 last week, as the ECB failed to weaken the common currency, and fueled the greenback's previous decline. The common currency soared after the market digested the announcement of a comprehensive package of easing measures by the European Central Bank, aimed to boost the local economy and inflation. The news backfired on Draghi, as investors can't see how more of the same can change the economic future of the region. Now, attention shifts to the FED, as the US Central Bank will have its economic policy meeting this week, and overall, markets are expecting an onhold stance, given the persistently low inflation and the economic deceleration that began by the end of 2015. During the weekend, Chinese data showed that growth in the second world's largest economy slowed further at the beginning of 2016, as value added industrial output in China rose 5.4% in the January February period from a year earlier, slowing from previous 5.9%, which means the week may start with some risk aversion across the boards. In the meantime, the technical picture for the EUR/USD pair shows that it has held on to gains, with a limited pullback on Friday, as buyers surged on dips. Nevertheless, and according to the daily chart, further rallies are not yet confirmed, as despite the price has recovered above its moving averages, the technical indicators have lost upward potential after crossing their midlines. The picture is quite similar in the 4 hours chart, in where the technical indicators are in retreat mode from overbought readings. At this point the pair needs to advance beyond 1.1240 to confirm a steadier upward movement, pointing tops to a test of 1.1460 should the FED hit the greenback.
Support levels: 1.1120 1.1080 1.1050
Resistance levels: 1.1160 1.1200 1.1240
GBP/USD
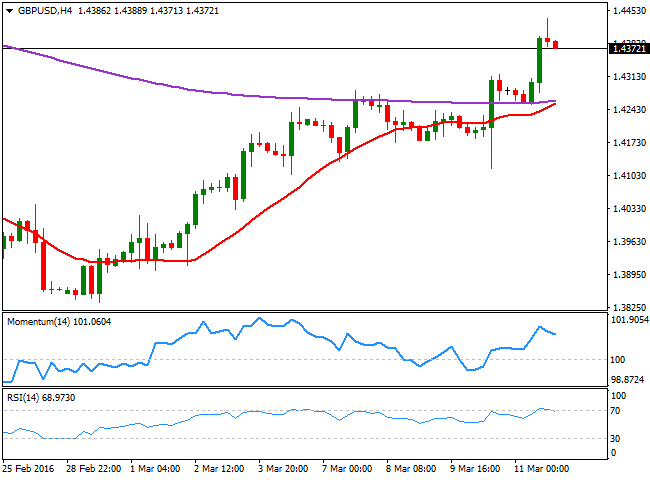
The Pound extended its latest recovery against the greenback up to 1.4435, closing with solid gains for second week in arow at 1.4372. There was an absence of macro market drivers for the Sterling during these last few days, with the rally mostly supported by dollar's broad weakness. On Friday however, data showed that the visible trade balance resulted roughly as expected, but significant downward revisions to December’s data meant that January showed an improvement in the deficit, against expectations of a deterioration. Also, the BOE released its quarterly inflation survey, showing that expectations have decreased in the year ahead inflation, to 1.8% from previous 2.0%, the lowest level in 15 years. During this upcoming week, the UK will release its February employment figures, which may determinate if the ongoing recovery is sustainable, particularly on a buildup in employment and wages. In the meantime, the daily chart shows that the strong upward momentum prevails, as the technical indicators continue heading north near overbought territory, while a decline towards the 20 SMA resulted in a sharp bounce. In the 4 hours chart, the price has extended its advance beyond the 200 EMA, currently around 1.4260, while the technical indicators eased partially from overbought readings. Pullbacks towards the level can be seen as buying opportunities, with only a break below the mentioned 1.4260 level signaling a possible return of the bearish trend.
Support levels: 1.4335 1.4295 1.4260
Resistance levels: 1.4410 1.4445 1.4490
USD/JPY
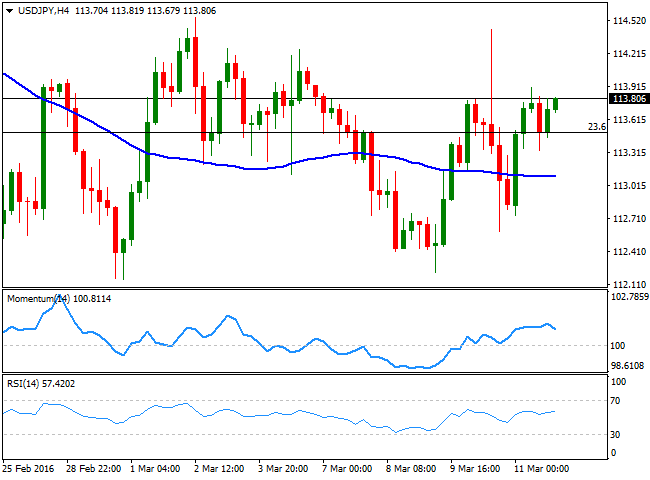
The USD/JPY pair closed the week with a doji, having traded for second week inarow within a well limited range between 112.10 and 114.60. The pair was unable to move in spite of stock's volatility, with investors sidelined ahead of the upcoming BOJ's meeting this week. The Japanese Central Bank is largely expected to remain on hold, on wait and see mode to asses further the effects of negative rates. Nevertheless, the market has had enough surprises from central bankers to remain wary. The bearish trend that ruled the pair for most of this past February has turned into a consolidative stage, and the technical stance is now neutral, until one of the mentioned extremes gives up. Technically, the daily chart shows that the pair continued hovering around the 113.50 region, presenting now a limited upward potential as the Momentum indicator heads north above its 100 level, but with the price developing well below its moving averages, and the 38.2% retracement of its latest decline at 115.05, a breakout point. Shorter term, technical readings in the 4 hours chart are neutral, with the price midway between the 100 and 200 SMAs, and the technical indicators lacking directional strength, within positive territory.
Support levels: 113.50 113.10 112.70
Resistance levels: 114.00 114.60 115.05
GOLD
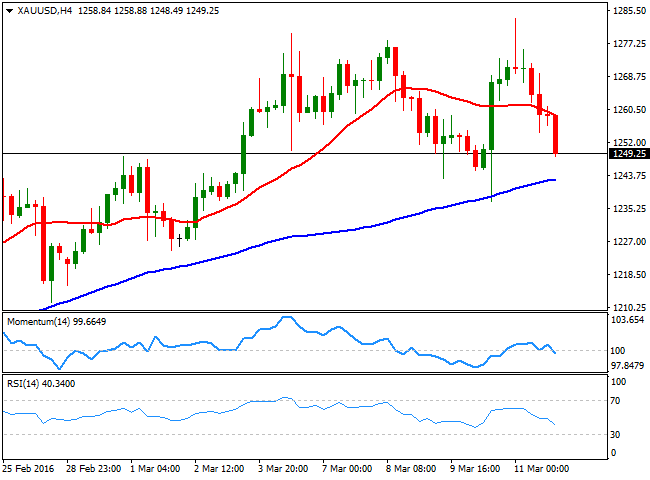
Gold prices turned lower on Friday, erasing all of the post ECB´s gains as stocks around the world rebounded. Spot gold reached a fresh 13month high of $1,283.50 before profit taking ahead of the upcoming FED's decision send it down to the current $1,249.25 price zone. The rally in the bright metal ran out of steam as equities reversed course, recovering most of the ground lost on Thursday, although the commodity is far from confirming a sharper decline in the days ahead, at least from a technical point of view. In the daily chart, the price is still above a bullish 20 SMA, currently at 1,241.50 the immediate support, while the technical indicators have turned south within positive territory. In the 4 hours chart and for the short term, the risk has turned towards the downside, as the price is being capped now by a bearish 20 SMA, whilst the technical indicators have crossed their midlines towards the downside, indicating a continued decline, particularly on a break below the mentioned support.
Support levels: 1,241.50 1,232.15 1,219.95
Resistance levels: 1,248.50 1,256.80 1,269.20
WTI CRUDE
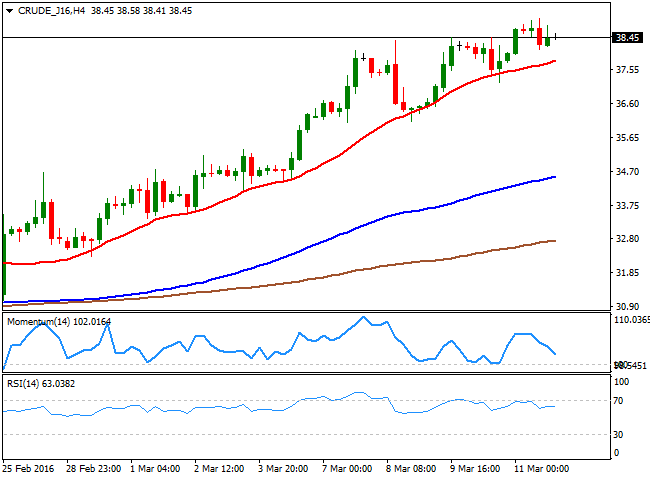
Crude oil prices surged on Friday to fresh yearly highs, helped by an International Energy Agency report, saying that oil prices may have bottomed out, as crude output in nonOPEC countries is falling faster than expected, while Iran's production is below that initially expected. Also, helping the commodity´s advance were news that US oil rig count fell to its lowest level on record. According to Baker Hughes, drilling rigs fell by 5 to 386 last week, the twelfth straight weekly decline. WTI futures reached $38.99 a barrel before ending the week at $38.45. The limited advance has resulted in the daily indicators losing their upward momentum, although they are still consolidating near overbought readings, while the price remains well above its 100 DMA and above a bullish 20 SMA, all of which keeps favoring the upside. The 200 DMA stands at 40.70, and a recovery beyond it should confirm a steeper recovery in the weeks to come. Shorter term, the 4 hours chart shows that a bullish 20 SMA keeps leading the way higher, attracting buyers on intraday retracements to it, while the technical indicators have turned flat above their midlines, showing no certain directional strength.
Support levels: 38.10 37.40 36.60
Resistance levels: 39.10 39.85 40.70
DAX
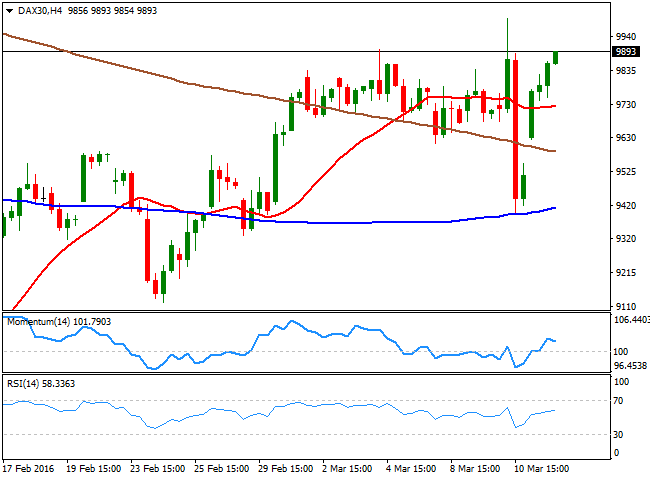
European markets opened sharply higher on Friday, with the German DAX closing with gains for fourth week in a row, up by 3.51% or 344 points to close at 9,831.13. Local share markets plummeted on Thursday, as investors run to price in comments from Mario Draghi anticipating little willingness to cut rates further. But banks rallied on relief on Friday, with Deutsche Bank adding 7.4%, also underpinned by rumors that the bank is in talks to sell its last batch of a portfolio of complex financial instruments. The technical picture favors some further gains for this week, as the daily chart shows that the index has recovered after flirting with a bullish 20 SMA on Thursday, while the technical indicators have bounced from their midlines, maintaining bullish slopes ahead of the weekly opening. In the 4 hours chart, the index is now above a flat 20 SMA after testing the 100 SMA earlier in the week, while the technical indicators have lost their upward slopes, but hold within positive territory.
Support levels: 9,854 9,787 9,690
Resistance levels: 9,924 9,996 10,041
DOW JONES
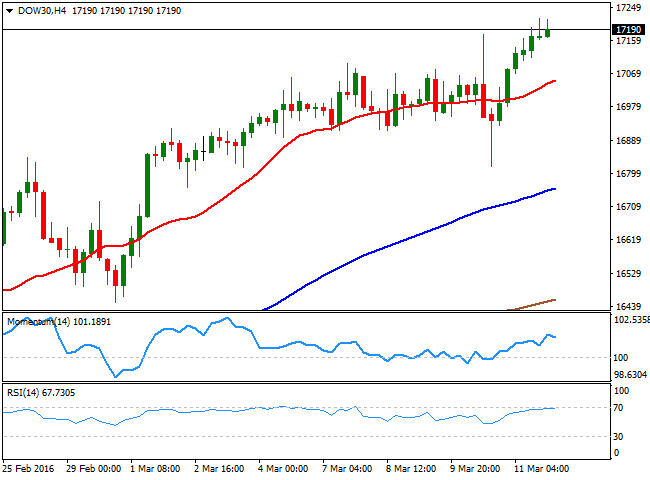
Wall Street closed strongly higher, with the DJIA ending at its highest level early January, up by 218 points or 1.28% to close at 17,213.31. The Nasdaq added 86 points and ended at 4,748.47, while the S and P surged 1.64% to 2,022.19. The US indexes followed European ones as in the Old Continent, investors realize that the new TLTROs will end up favoring banks. In the US, Morgan Chase advanced 1.3%, while Bank of America and Citigroup, both surged 3.9%. The daily chart for the DJIA supports some further gains, as the index remains near the mentioned close, rallying beyond its 100 and 200 DMAs, as the technical indicators maintain bullish slopes well above their midlines. In the 4 hours chart, the technical outlook is neutralto bullish, as the index remains above a bullish 20 SMA, currently around 17,042, whilst the technical indicators have lost their upward strength, but remain within positive territory. Buyers should surge on dips towards the 17,000 region to favor a continued advance in the index towards the next big figure of 18,000.
Support levels: 17,104 17,042 16,970
Resistance levels: 17,219 17,285 17,340
FTSE 100
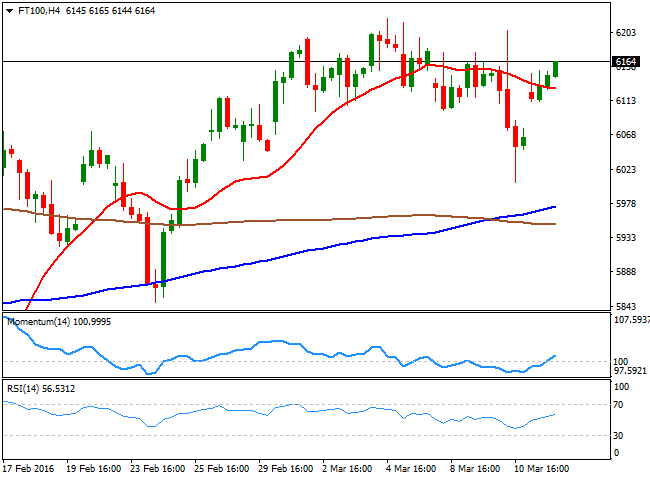
The Footsie closed at 6,139.79 up by 1.71% or 104 points, with the banking sector leading the way higher, as investors digested the implications of the latest stimulus measures announced by the ECB. Barclay's rose 3.8%, while Standard Chartered added 4.3%, while the insurance firm Aviva kept rallying after it beat forecast with a 20% rise in operating profits, adding 6.35%. The commodity related sector did little for the benchmark in spite of oil's gains, with Anglo American closing the day down 0.5%. From a technical point of view, the index maintains a positive tone, as it managed to close the week above its 20 and 100 DMAs, this last around 6,110. In the 4 hours chart, the 100 SMA has crossed over the 200 SMA in the 5,900 region, while the index is currently advancing above a mild bearish 20 SMA and the technical indicators head higher slightly above their midlines, supporting a retest of the weekly high of 6,221.
Support levels: 6,112 6,075 6,037
Resistance levels: 6,183 6,221 6,300
The information set forth herein was obtained from sources which we believe to be reliable, but its accuracy cannot be guaranteed. It is not intended to be an offer, or the solicitation of any offer, to buy or sell the products or instruments referred herein. Any person placing reliance on this commentary to undertake trading does so entirely at their own risk.
Recommended Content
Editors’ Picks
EUR/USD clings to daily gains above 1.0650

EUR/USD gained traction and turned positive on the day above 1.0650. The improvement seen in risk mood following the earlier flight to safety weighs on the US Dollar ahead of the weekend and helps the pair push higher.
GBP/USD recovers toward 1.2450 after UK Retail Sales data

GBP/USD reversed its direction and advanced to the 1.2450 area after touching a fresh multi-month low below 1.2400 in the Asian session. The positive shift seen in risk mood on easing fears over a deepening Iran-Israel conflict supports the pair.
Gold holds steady at around $2,380 following earlier spike

Gold stabilized near $2,380 after spiking above $2,400 with the immediate reaction to reports of Israel striking Iran. Meanwhile, the pullback seen in the US Treasury bond yields helps XAU/USD hold its ground.
Bitcoin Weekly Forecast: BTC post-halving rally could be partially priced in Premium

Bitcoin price shows no signs of directional bias while it holds above $60,000. The fourth BTC halving is partially priced in, according to Deutsche Bank’s research.
Week ahead – US GDP and BoJ decision on top of next week’s agenda

US GDP, core PCE and PMIs the next tests for the Dollar. Investors await BoJ for guidance about next rate hike. EU and UK PMIs, as well as Australian CPIs also on tap.
