EUR/USD
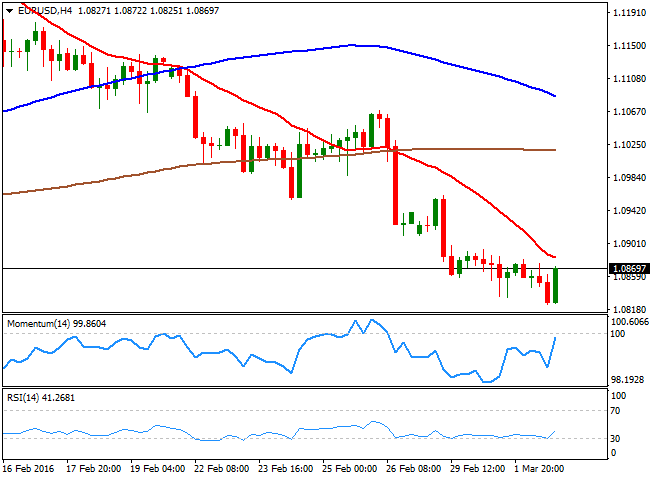
Moody's rating agency cut China's credit rating outlook from stable to negative at the beginning of the day, citing rising government debt, falling foreign currency reserves, and uncertainty about the reform agenda. Asian shares, however, managed to close in the green, and Europe followed through, although US ones hovered in negative territory all through the day to close it practically flat. The main macroeconomic release was the US ADP employment survey, showing that the private sector added 214K new jobs during February and confirming continued strength in the jobs market. The dollar that was trading slightly higher ahead of the news, accelerated its advance, but the limited momentum of the American currency faded after Wall Street kicked in, with the currency poised to end the day on the red against all of its major rivals, but the EUR. The common currency continues to be pressured by speculation the ECB will add some sort of easing measure during the upcoming meeting, and ends this Wednesday with a lower low, and a lower high, for third day inarow. As for the technical picture, the intraday advance was not enough to reverse the dominant bearish trend, albeit the price has bounced after approaching the key support area at 1.0800/10. The 1 hour chart shows that the price continues developing below its 20 SMA, while the technical indicators have turned flat below their midlines after bouncing from oversold levels, reflecting the absence of buying interest. In the 4 hours chart, the technical indicators have also bounced from oversold readings, but remain well below their midlines, while the 20 SMA caps the upside in the 1.0880/90 region, where the pair also presents multiple intraday highs from earlier this week, and the level to break to see the bearish pressure easing.
Support levels: 1.0810 1.0770 1.0730
Resistance levels: 1.0890 1.0925 1.0960
GBP/USD
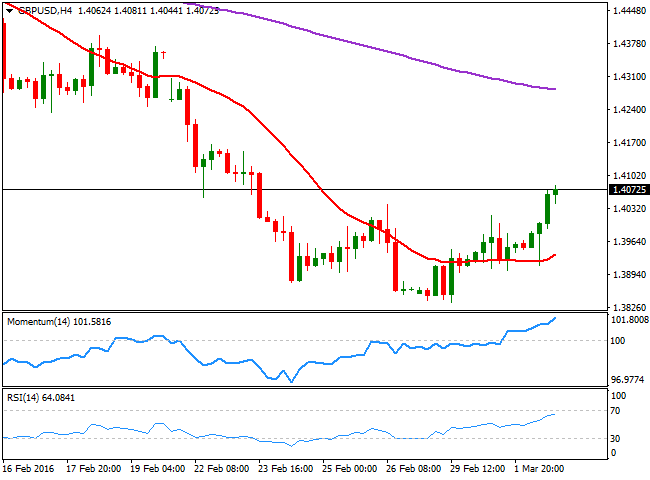
The GBP/USD pair trades at a fresh 6day high, with the pair rising ever since the day started, as Brexit fears eased somehow during these last few days. The Sterling saw a short lived slump mid London session, following the release of the UK construction PMI that declined in February, losing nearly a point and landing at 54.2, a fresh 10month low. But the pair later recovered, beginning to correct the overextended decline, and now poised to extend its advance according to technical readings. The pair can move back above the 1.41 level, and even extend up to the 1.4250 region, a line in the sand for the latest bearish trend, as if the price manages to extend beyond this last, the upside will look far more constructive. The short term outlook is bullish by the end of the day, as in the 1 hour chart, the Momentum and the RSI indicators have lost upward strength but hold within overbought territory, with no signs of turning lower, whilst the 20 SMA has advanced strongly below the current level, offering a strong dynamic support at 1.3990. In the 4 hours chart, the technical readings are also supportive of an upward continuation, as the Momentum indicator heads higher well above its 100 level, while the RSI indicator consolidates around 63. Should the pair hold above 1.4040, February 26th daily high, the downside will remain well limited, with scope to rally up to the mentioned 1.4250 price zone.
Support levels: 1.4040 1.3990 1.3950
Resistance levels: 1.4090 1.4130 1.4185
USD/JPY
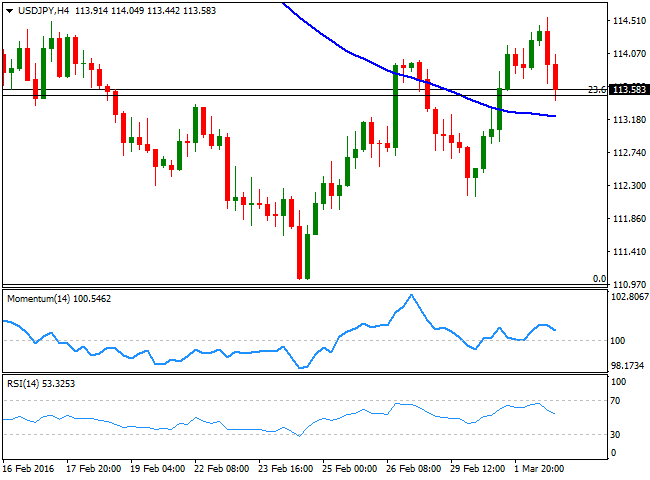
The USD/JPY pair spiked up to a fresh 2week high of 114.55 this Wednesday, boosted by a better than expected US ADP employment survey, but the pair quickly changed course as US equities fell. Stocks later bounce, but the pair remained near its daily low, unable to attract buyers. Mid American afternoon, FED's Williams hit the wires saying that any changes in the interestrate path may be modest and that the Central Bank maintains its latest stance, but the market is betting that a rate hike is now out of the table for this 2016, and it will take more than one strong employment report, to revert such idea. In the meantime, the market maintains its sell the spikes stance, with the daily high stalling short of the key resistance at 115.05, the 38.2% retracement of its latest daily slump. Short term, the bearish pressure continues to increase, given that the technical indicators have accelerated their declines and reached fresh lows within bearish territory, although the price is still above a bullish 100 SMA, currently around 113.25, the immediate support. In the 4 hours chart, the technical indicators have also turned south, but remain above their midlines, suggesting a downward extension below the mentioned 113.25 support is required to confirm a stronger bearish move.
Support levels: 113.25 112.80 112.40
Resistance levels: 113.70 114.10 114.60
GOLD
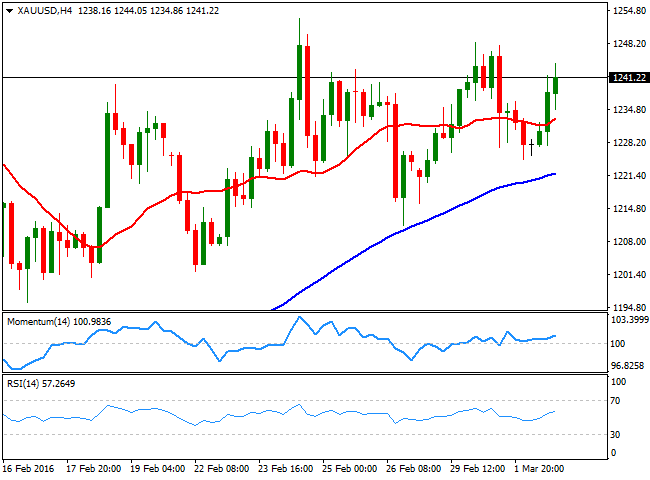
Gold prices surged on Wednesday, with spot erasing all of its Tuesday´s losses to close the day above $1,240.00 a troy ounce. A softer greenback has helped the bright metal to recover ground, alongside with bargain hunting, as speculators have been quickly buying on dips. Continued market turmoil and concerns over global economic growth have given the commodity a reason to recover, but the ongoing bullish trend is beyond safehaven demand, part speculative, part a natural trend after gold fell to production cost. Spot fell down to 1,224.72, approaching its daily 20 SMA, a dynamic support that has been steadily producing sharp bounces. In the same chart, the technical indicators have resumed their advances within positive territory, supporting some further gains for this Thursday. Shorter term, the 4 hours chart shows that the price is above a horizontal 20 SMA while the technical indicators present tepid bullish slopes above their midlines, maintaining the risk towards the upside, but lacking strength.
Support levels: 1,234.90 1,226.10 1,216.50
Resistance levels: 1,244.05 1,251.90 1,260.00
WTI CRUDE
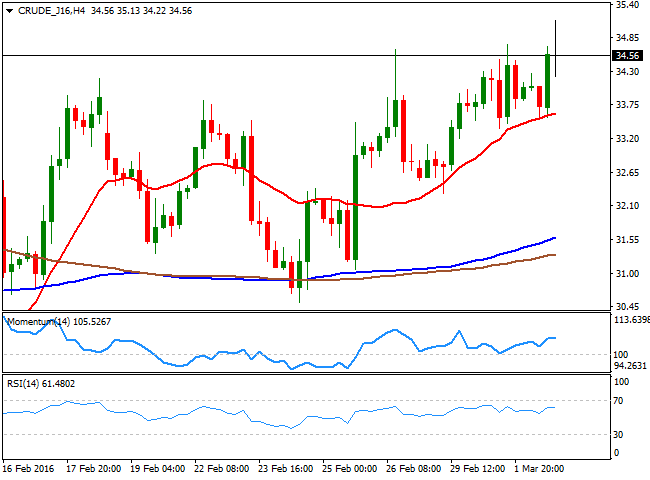
Crude oil prices erased part of their daily gains, with West Texas Intermediate futures trading around $34.50 a barrel after being as high as $35.13. The commodity was hurt by US stockpiles reports as the EIA said that crude inventories rose by 10.4 million barrels to a total of 518 million barrels, almost three times the 3.6 million barrel increase expected by analysts. Late Tuesday, the American Petroleum Institute also said that crude inventories jumped by 9.9 million barrels last week. The record reading however, was offset by new evidence that worldwide production continues to decline, whilst Venezuela's Oil Minister Eulogio Del Pino said that several oil producing countries will meet to discuss an output freeze plan and possible further actions, to fight the glut and falling prices. Daily basis, the commodity set a higher high, approaching further to its 100 SMA, still bearish around 35.80, the immediate resistance. In the same chart, the Momentum indicator has turned sharply lower, but the RSI indicator maintains its bullish slope around 59, supporting an extension of the latest recovery. In the 4 hours chart, the price has steadily found buying interest on decline towards its 20 SMA, whilst the technical indicators have lost upward momentum, but remain within positive territory in line with the longer term outlook.
Support levels: 34.00 33.35 32.55
Resistance levels: 34.90 35.80 36.60
DAX
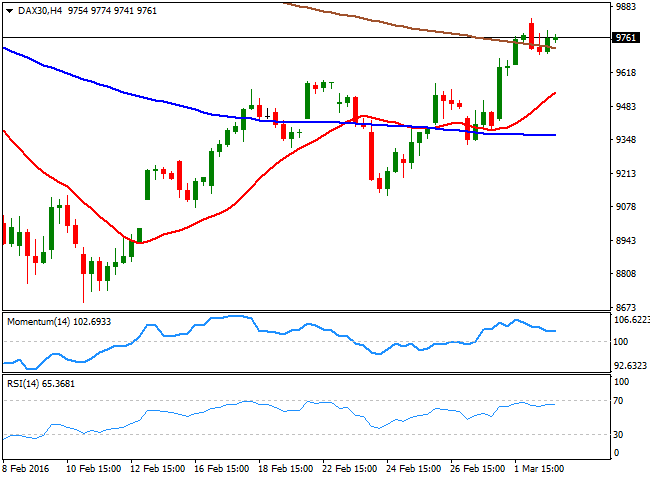
European stocks ended higher for fifth consecutive day, with the German DAX up by 0.61% to close at 9,776.62. The strong opening was supported by previous gains in the US and Asian markets, although investors' optimism faded by London close, resulting in modest gains all across the region. The index eased some 100 points in after hours trading, as Wall Street lost momentum, but the German DAX holds on to its latest bullish tone, as in the daily chart, it advanced further above a now flat 20 SMA, while the technical indicators have partially lost upward strength, but remain well above their midlines. Additionally, the index managed to post an over one month high, which suggests bulls are still in control, albeit buying interest remains discrete ahead of the ECB's meeting next week. In the 4 hours chart, the 20 SMA has accelerated its advance below the current level, while the technical indicators have recovered towards the upside after a limited downward move, in line with further advances for this Thursday.
Support levels: 9,742 9,690 9,651
Resistance levels: 9,837 9,924 10,000
DOW JONES
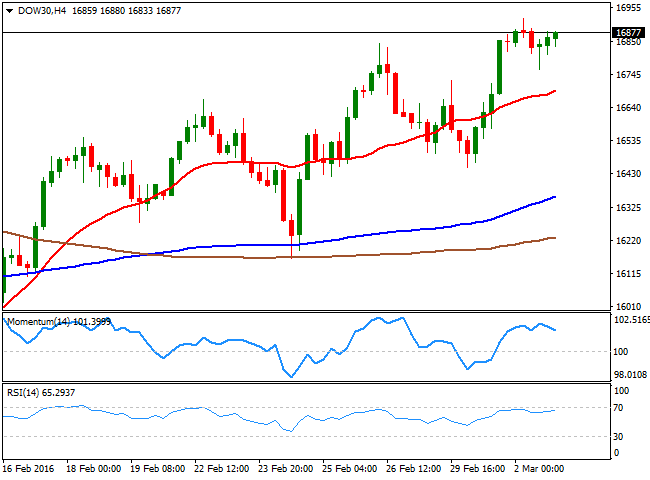
US stocks struggled to maintain their previous upward momentum, trading in the red for most of the day to finally close with tepid gains. Equities were unable to rally, despite strong employment figures, as investors entered in cautious mode ahead of the upcoming Nonfarm Payroll report next Friday. The DJIA closed the day up by 34 points at 16,899.73, the Nasdaq advanced 13 points to 4,703.42, while the S and P added 8 points to 1,986.45.Technically, the DJIA daily chart shows that the index extended its advance further, maintaining the positive tone given that it posted a higher high and a higher low, but still unable to surpass the 100 and 200 SMAs, both with mild negative slopes above the current level. In the same chart, the technical indicators have lost upward strength, but are not yet turning south, holding well above their midlines, also in line with additional gains. Shorter term, the 4 hours chart shows that the 20 SMA has accelerated its advance above the largest moving averages, while the index is well above it, and the technical indicators consolidate within positive territory, in line with the longer term outlook, and despite the current lack of directional strength.
Support levels: 16,811 16,761 16,680
Resistance levels: 16,922 17,014 17,105
FTSE 100
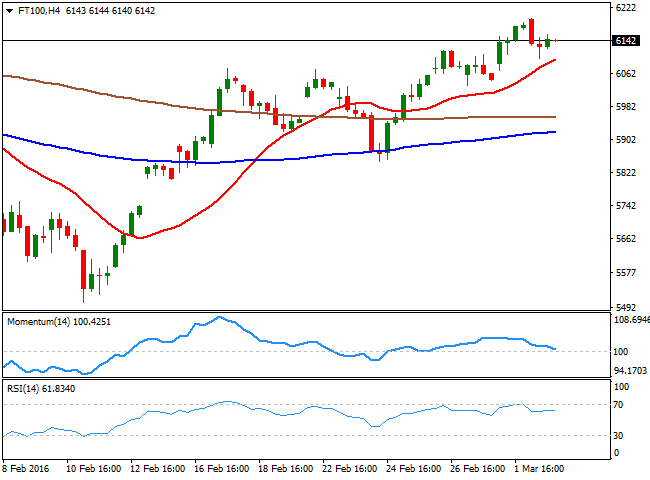
The FTSE 100 ended the day pretty much flat, down by 6 points at 6,147.06, in spite commodity related currencies were among the daily winners. Copper producer Antofagasta added 3.59%, while Rio Tin to was up by 2.3%, while oil's prices early advance helped Royal Dutch Shell to add 0.98%, and BP to surge by 0.64%. The London benchmark remains near its close ahead of Thursday´s opening, and the daily chart shows that, despite the retreat, it managed to close the day above its 100 DMA. In the same chart, the Momentum and the RSI indicators are losing some upward strength near overbought levels, still far from suggesting an upcoming downward move. In the 4 hours chart, the index remains well above a strongly bullish 20 SMA, but the Momentum indicator is drawing a bearish divergence, not yet confirmed, heading south and about to cross its midline towards the downside, whilst the RSI continues to aim higher around 63, this last limiting the downside at the time being.
Support levels: 6,094 6,027 5,969
Resistance levels: 6,181 6,246 6,325
The information set forth herein was obtained from sources which we believe to be reliable, but its accuracy cannot be guaranteed. It is not intended to be an offer, or the solicitation of any offer, to buy or sell the products or instruments referred herein. Any person placing reliance on this commentary to undertake trading does so entirely at their own risk.
Recommended Content
Editors’ Picks
EUR/USD clings to daily gains above 1.0650

EUR/USD gained traction and turned positive on the day above 1.0650. The improvement seen in risk mood following the earlier flight to safety weighs on the US Dollar ahead of the weekend and helps the pair push higher.
GBP/USD recovers toward 1.2450 after UK Retail Sales data

GBP/USD reversed its direction and advanced to the 1.2450 area after touching a fresh multi-month low below 1.2400 in the Asian session. The positive shift seen in risk mood on easing fears over a deepening Iran-Israel conflict supports the pair.
Gold holds steady at around $2,380 following earlier spike

Gold stabilized near $2,380 after spiking above $2,400 with the immediate reaction to reports of Israel striking Iran. Meanwhile, the pullback seen in the US Treasury bond yields helps XAU/USD hold its ground.
Bitcoin Weekly Forecast: BTC post-halving rally could be partially priced in Premium

Bitcoin price shows no signs of directional bias while it holds above $60,000. The fourth BTC halving is partially priced in, according to Deutsche Bank’s research.
Week ahead – US GDP and BoJ decision on top of next week’s agenda

US GDP, core PCE and PMIs the next tests for the Dollar. Investors await BoJ for guidance about next rate hike. EU and UK PMIs, as well as Australian CPIs also on tap.
