EUR/USD
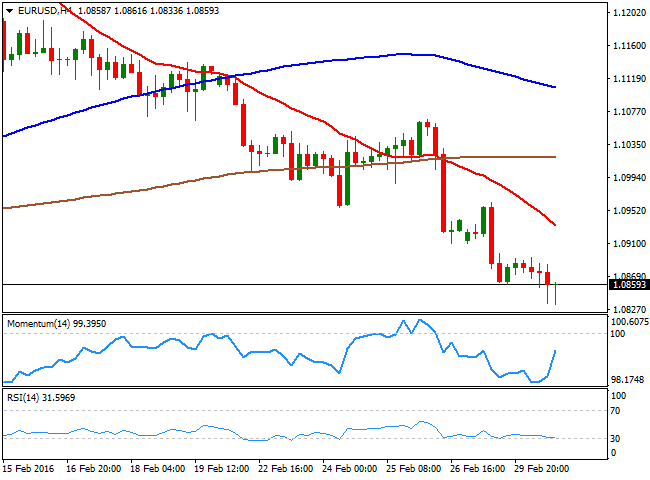
Worldwide turmoil increased as more signs of global economic slowdown have hit the wires this Tuesday, in the form of Markit Manufacturing PMIs. Starting in China, the official manufacturing PMI survey declined by 0.4 point to 49.0 in February reaching its lowest level since November 2011, while the EU reading fell to a 12month low in February of 51.2 against previous 52.3, while in Japan, it declined to 50.1 from the previous 50.2. European data was no better, as the EU reading fell to a 12month low in February of 51.2 against previous 52.3. The rest of the major European economies, with the exception of Germany, printed readings below expectations, and neared the 50.0 mark. The only positive news came from Germany, as unemployment in the country decrease by 10,000 in February, leaving the unemployment rate unchanged at 6.2%. In the US, the ISM manufacturing index rose to 49.5 from 47.8 in January, still in contraction territory, while construction spending rose 1.5% in January, with increases in private and public spending. The EUR/USD pair, however, was unable to attract investors, slowly sliding towards the mentioned daily low, weighed by speculations the ECB may take some aggressive easing measures in its March meeting. Technically, the 4 hours chart shows that the price has bounced some from the mentioned low, while the Momentum indicator heads higher within bearish territory, recovering from oversold readings. The fact that price did not follow the indicator suggests that bears are still in control. In the same chart, the RSI indicator consolidates near oversold readings, whilst the 20 SMA maintains a sharp bearish slope above the current level, all of which supports a test of the critical 1.0800/10 region, where buyers have been defending the downside pretty much since last December. Should the pair trigger the large stops suspected below this region, the decline will likely extend towards the 1.0700 region.
Support levels: 1.0810 1.0770 1.0730
Resistance levels: 1.0890 1.0925 1.0960
GBP/USD
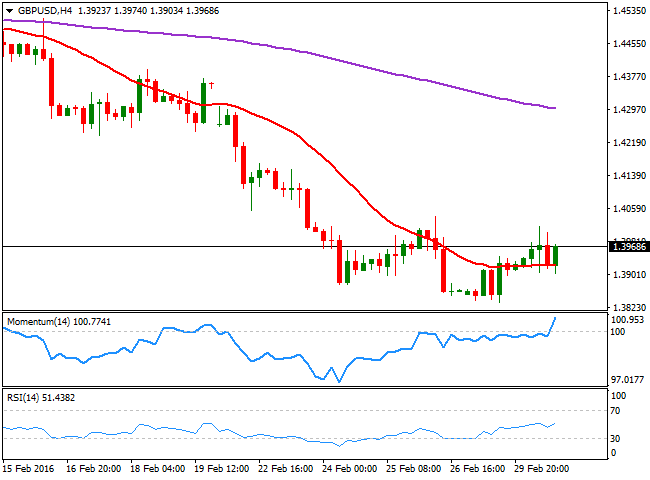
The Sterling advanced for a second day in arow, although the GBP/USD pair is ending the day below the daily high set at 1.4017 during the European session. The pair gave back its gains following the release of February's manufacturing PMI that fell more than expected to 50.8, against market expectations of a slight decline to 52.2, the lowest reading since early 2013. Nevertheless, intraday buying interest surged on approaches to the 1.3900 level, suggesting bears have lost interest at current levels. Short term, the pair presents a mild bullish tone, as in the 1 hour chart, the price has managed to recover above a bullish 20 SMA, whilst the technical indicators have bounced from their midlines, indicating the pair may continue advancing. In the 4 hours chart, the price has bounced several times from a horizontal 20 SMA, whilst the technical indicators are currently advancing above their midlines, in line with the shorter term perspective. Nevertheless, it would take an upward acceleration beyond the 1.4020 level to see a more sustainable advance during the upcoming hours that can extend up to the 1.4100 region.
Support levels: 1.3960 1.3920 1.3875
Resistance levels: 1.4020 1.4060 1.4100
USD/JPY
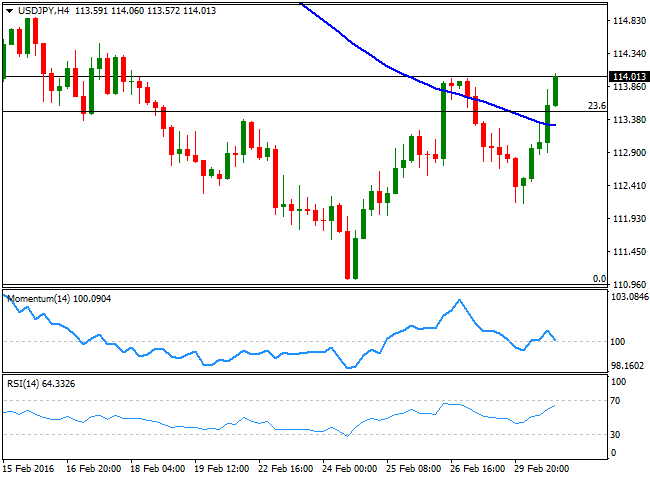
The American dollar outperformed against the Japanese yen, as the pair advanced a couple of pips beyond the 114.00 level in the American afternoon, supported by rising stocks worldwide. The pair traded as low as 112.15 this Tuesday, down at the beginning of the day as Monday's negative mood favored safehaven assets. Anyway, the price is currently at a major resistance level, and some consolidation should be expected, as the current region stands for the past two sessions highs. Still far below the 38.2% retracement of its latest daily decline at 115.05, the daily chart shows that the technical indicators have turned higher around their midlines, rather reflecting this daily gain than suggesting further advances. In the shorter term, the price has accelerated well above its moving averages, with the 100 SMA crossing above the 200 SMA, and at the same time, the technical indicators are giving some signs of exhaustion within oversold territory. Nevertheless, with the pair pressuring its daily high, a new leg higher may follow after some consolidation. In the 4 hours chart, the technical indicators diverge from each other, with the Momentum heading lower and the RSI higher, both above their midlines.
Support levels: 113.50 113.15 112.60
Resistance levels: 114.10 114.60 115.00
GOLD
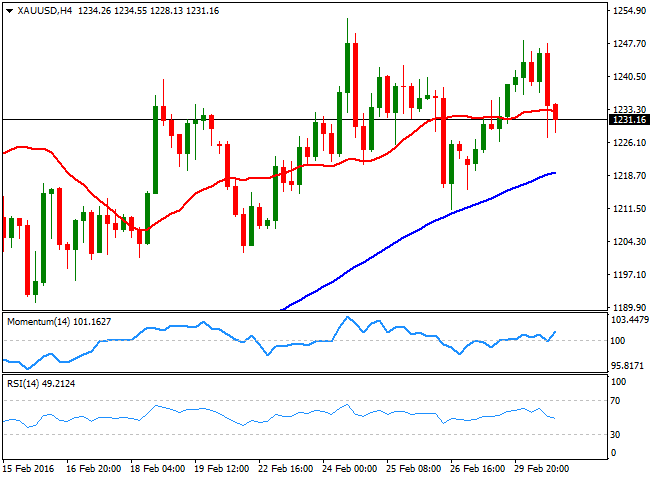
Gold prices advanced at the beginning of the day, with spot reaching $1,248.48 a troy ounce before turning into the red in the American session, as better than expected US manufacturing data revived hopes of a sooner rate hike coming from the FED. Spot price dipped 0.5% to 1,227.09, before recovering to the current 1,231.00 region, with buying interest still surging on dips. Technically, the daily chart shows that the price remains well above a bullish 20 SMA, but also that the technical indicators have turned south, with the RSI around 62 and the Momentum around its midline, this last currently neutral. In the 4 hours chart, the technical outlook is neutral to bullish, as the price is hovering around a horizontal 20 SMA, while the technical indicators have turned slightly higher after testing their midlines, but lack enough momentum to confirm a stronger advance. As commented on previous updates, the overall stance is bullish, as long as the market places limited hopes on a US rate hike. Should American data continue to surprise towards the upside, the commodity may reverse course, but that's something that will take more than one strong macroeconomic reading.
Support levels: 1,226.10 1,216.50 1,202.05
Resistance levels: 1,242.30 1,251.90 1,260.00
WTI CRUDE
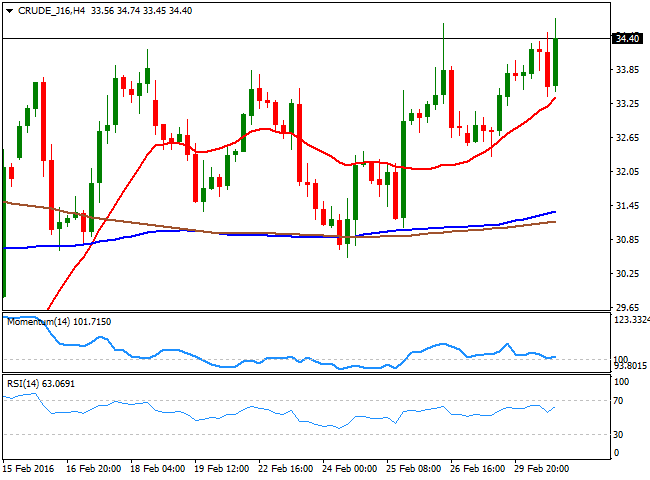
Crude oil prices began the day with a negative tone, weighed by poor Chinese manufacturing readings, but after a stuttering start, prices jumped higher, with WTI futures reaching a fresh 5week high of $34.74 a barrel, accumulating a 30% advance in near two weeks. Ahead of the release of US stockpiles data, the commodity is comfortably consolidating above 34.00, maintaining the positive tone seen on previous updates, although a strong upward rally is out of the table, given that the background conditions that sent it down to $26.00 are still present. In the daily chart, the commodity advanced further above its 20 SMA, but the 100 SMA continues to head south, now around 35.80. In the same chart, the technical indicators have resumed their advances after a limited downward correction, in line with further gains for this Wednesday. In the shorter term, the 4 hours chart shows that a strongly bullish 20 SMA provided support around 33.36, the daily low, while the technical indicators have also resumed their advances, but lack momentum at the time being.
Support levels: 34.00 33.35 32.55
Resistance levels: 34.90 35.80 36.60
DAX
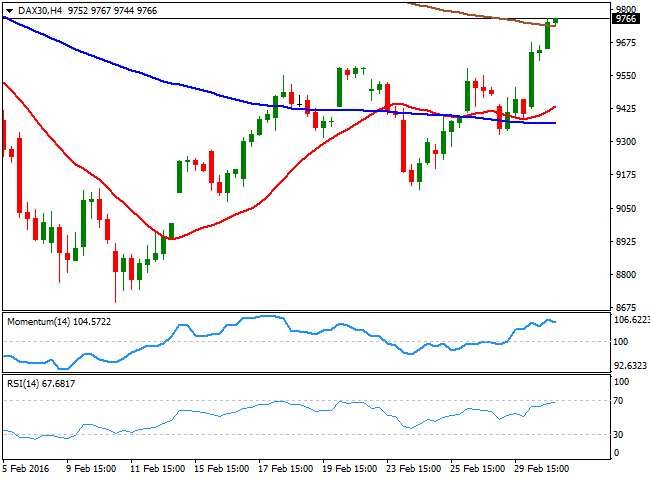
The German DAX added 226 points or 2.34% to end the day at 9,717.16, the best performer among European equities. The index was supported by automakers, with BMW adding 4.2% after its chief executive officer forecast another year of record sales, and Daimler which advanced 2.5%. Also, improved employment data in the country, and a better than expected Markit Manufacturing PMI, supported the benchmark. The rally extended further following Wall Street's gains, leaving a clearly bullish tone in the daily chart, as the index has accelerated well above its 20 SMA, while the technical indicators head sharply higher well into positive territory. In the 4 hours chart, the 20 SMA is advancing above the 100 SMA, although with limited strength, whilst the technical indicators are turning slightly lower near overbought territory, still far from suggesting that the index may change course. The DAX has its next relevant resistance at 9,924, January 27th intraday high, which means some follow through beyond it will support a continued advance up to 10,000.
Support levels: 9,651 9,580 9,521
Resistance levels: 9,847 9,924 10,000
DOW JONES
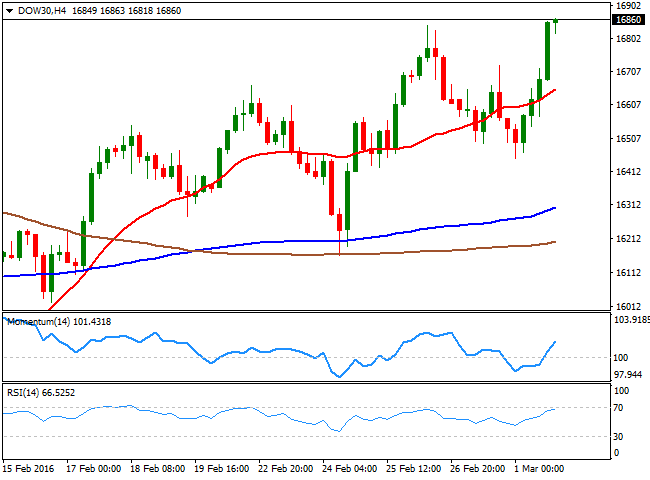
Wall Street posted strong gains this Tuesday, with all of the three indexes closing the day near its highs. The Dow Jones Industrial Average added 348 points to end at 2.11%, while the Nasdaq and the S and P jumped over 2% each. The DJIA has advanced ever since the day started, but accelerated during the American session, following improved local data that anyway is far from avert the latest economic slowdown. Holding near its daily high at the close, the daily chart presents a strong positive tone, as the technical indicators have resumed their advances near overbought levels, while the benchmark extended further above a bullish 20 SMA. The index, took one step further towards the longer moving averages, as the 100 SMA stands at 16,952 and the 200 SMA at 17,007, a critical resistance area for this Wednesday. In the 4 hours chart, the index is also clearly bullish, as the 20 SMA advanced further, now well below the current level, while the Momentum indicator heads higher, within positive territory, and the RSI indicator hovers around 66, in line with the current consolidative stage after the close, but maintaining the positive tone.
Support levels: 16,700 16,620 16,485
Resistance levels: 16,910 17,080 17,220
FTSE 100
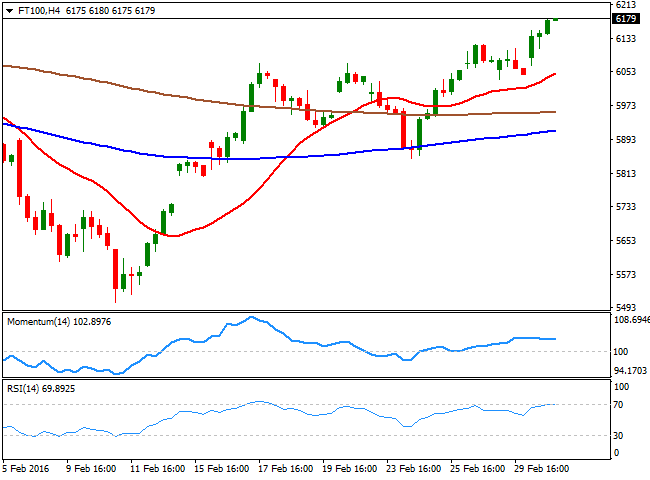
The London benchmark, the FTSE 100 advanced 0.92% and closed the day at 6,152.88, a fresh 2month high, boosted by a strong performance from the London Stock Exchange Group, as it shares surged to record highs after Intercontinental Exchange confirmed it was considering making a rival bid for the group. Barclays was the worst performer, down 8.1% after it reported falling profits and a cut to its dividend next year. The commodityrelated sector ended mixed, with Antofagasta and Glencore down, but Rio Tinto up, tracking oil's advance. From a technical point of view, the daily chart shows that the index has extended above its 100 DMA for the first time since early January, while the technical indicators maintain a strong upward momentum as they near overbought territory. Shorter term, the 4 hours chart shows that the index has extended well above a now bullish 20 SMA, while the technical indicators have turned flat within positive territory, although with the index holding around its daily high, chances are of further gains for this Wednesday.
Support levels: 6,152 6,094 6,027
Resistance levels: 6,181 6,246 6,325
The information set forth herein was obtained from sources which we believe to be reliable, but its accuracy cannot be guaranteed. It is not intended to be an offer, or the solicitation of any offer, to buy or sell the products or instruments referred herein. Any person placing reliance on this commentary to undertake trading does so entirely at their own risk.
Recommended Content
Editors’ Picks
AUD/USD could extend the recovery to 0.6500 and above

The enhanced risk appetite and the weakening of the Greenback enabled AUD/USD to build on the promising start to the week and trade closer to the key barrier at 0.6500 the figure ahead of key inflation figures in Australia.
EUR/USD now refocuses on the 200-day SMA

EUR/USD extended its positive momentum and rose above the 1.0700 yardstick, driven by the intense PMI-led retracement in the US Dollar as well as a prevailing risk-friendly environment in the FX universe.
Gold struggles around $2,325 despite broad US Dollar’s weakness

Gold reversed its direction and rose to the $2,320 area, erasing a large portion of its daily losses in the process. The benchmark 10-year US Treasury bond yield stays in the red below 4.6% following the weak US PMI data and supports XAU/USD.
Bitcoin price makes run for previous cycle highs as Morgan Stanley pushes BTC ETF exposure

Bitcoin (BTC) price strength continues to grow, three days after the fourth halving. Optimism continues to abound in the market as Bitcoiners envision a reclamation of previous cycle highs.
US versus the Eurozone: Inflation divergence causes monetary desynchronization

Historically there is a very close correlation between changes in US Treasury yields and German Bund yields. This is relevant at the current juncture, considering that the recent hawkish twist in the tone of the Federal Reserve might continue to push US long-term interest rates higher and put upward pressure on bond yields in the Eurozone.
