EUR/USD
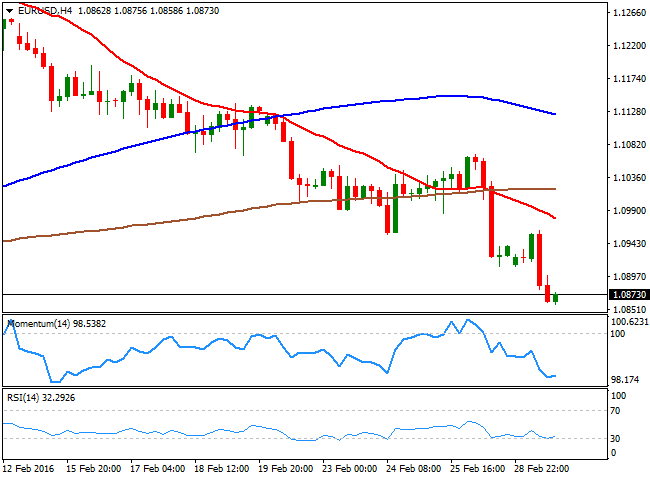
Investor's struggled to maintain the positive mood, as negative data kept coming from all fronts. China surprised markets' by its extending its easing policy further with a general cut in the reserve requirement ratio of 0.5 percentage points, which led to strong declines in Asian stocks. In Europe, the EU inflation data surprised on the downside, as February readings came out at 0.2% compared to a year before, while the core annual reading shrunk to 0.7%. The common currency came under pressure as the market is pricing in a 15bps deposit rate cut in the upcoming ECB meeting, and remained subdued, despite US macro figures disappointed. The Pending Home Sales Index declined 2.5% over the month, falling from December’s upwardly revised reading of 108.7 to a level of 106.0 in January, while the Chicago PMI plummeted to 47.6 from the previous 55.6. The EUR/USD pair advanced early Europe up to 1.0960, but failed to sustain gains after the poor local inflation figures, and fell down to 1.0858. Despite broad dollar's weakness, the pair was unable to recover much, and consolidates near its daily low by the end of the day, maintaining a generally negative technical tone. Short term, the 1 hour chart shows that the price remains below a bearish 20 SMA, while the indicators head south within bearish territory, indicating the risk remains towards the downside. In the 4 hours chart, the technical picture also favors additional declines, although the technical indicators have lost bearish strength around oversold levels. Some consolidation could be expected, with strong buying interest aligned around 1.0810, and large stops below it that if triggered, could see the pair approaching 1.0700 next Tuesday.
Support levels:1.0850 1.0810 1.0770
Resistance levels: 1.0920 1.0960 1.1000
GBP/USD
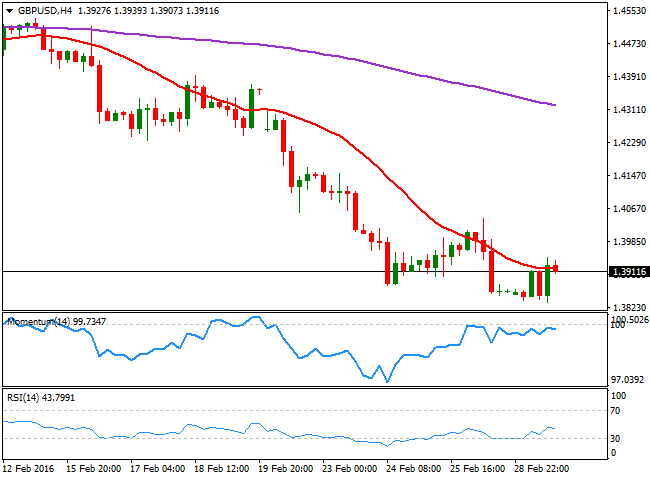
The British Pound recovered some ground in the American afternoon, after extending its decline down to 1.3835 against the greenback at the beginning of the American session, a new almost 6year low. Tepid US housing and manufacturing figures helped the GBP/USD pair to bounce, and even correct the extreme oversold readings seen in the daily chart. But the negative sentiment towards the Pound prevails ever since the announcement of the date of the referendum on whether to stay or not within the EU, and selling interest at higher levels will likely be the way to play the pair. Technically, the 1 hour chart shows that the latest advance has helped the pair to recover above its 20 SMA and the technical indicators extend above their midlines, but are currently turning south in positive territory. In the 4 hours chart, the price is unable to advance beyond a horizontal 20 SMA, while the technical indicators lack directional strength below their midlines, given no clear clues on what's next for the pair, although the risk is clearly towards the downside. At this point, the price needs to break below the mentioned low to confirm a firmer downward continuation, with a break below the 1.3800 figure exposing the pair to a retest of 1.3501, 2009 low.
Support levels: 1.3860 1.3835 1.3790
Resistance levels: 1.3940 1.3985 1.4020
USD/JPY
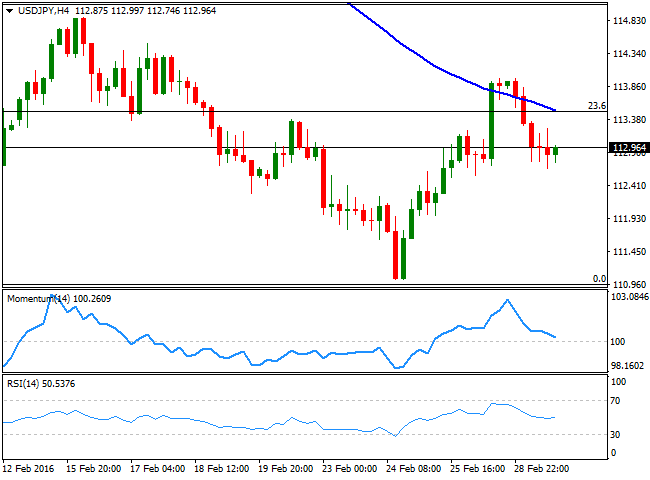
The USD/JPY pair lost around 100 pips from its Friday's close, as the G20 meeting that took place in Shanghai during the weekend, failed to boost market's sentiment. The Group committed to go beyond easymoney monetary policy to pursue structural reforms in their respective countries to strengthen the global economy, but as usual, no actual decision was made. The pair's decline stalled during the American afternoon, as local share markets turned positive, but poor US data maintained the upside limited. From a technical point of view, the 1 hour chart shows that the price is struggling around the 200 SMA, while the 100 SMA heads slightly higher around 112.55, providing an immediate intraday support. In the same chart, the Momentum indicator aims higher, but remains below its 100 level, while the RSI indicator resumed its decline around 43, in line with further declines. In the 4 hours chart, the price retreated from a bearish 100 SMA, while the Momentum indicator heads south and nears its 100 level, and the RSI stand flat around 50.
Support levels: 112.45 112.00 111.65
Resistance levels:113.20 113.70 114.10
GOLD
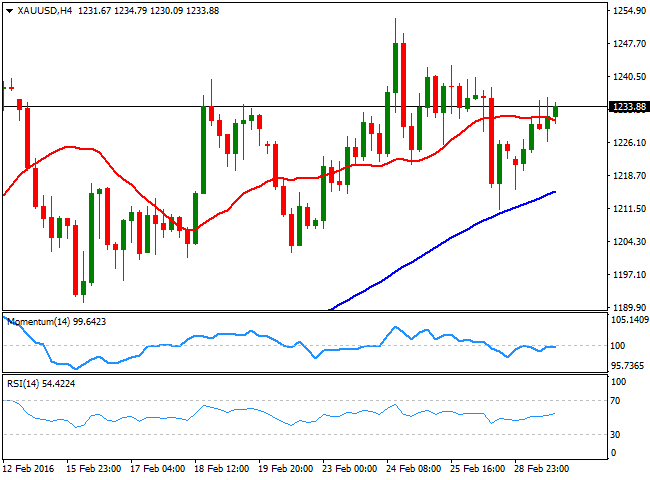
Gold recovered its shine, with spot erasing all of its Friday's losses and advancing up to a daily high of $1,235.87 a troy ounce. The decline in stocks favored the commodity, with strong buying interest coming from China, in the form of bargain hunting. Also, supporting the bright metal was dollar's weakness, which traded lower against most of its major rivals. From a technical point of view, the bullish stance prevails, as the price recovered strongly after testing a bullish 20 SMA early Monday, currently a strong dynamic support at 1,216.50. In the same chart, the technical indicators have erased all of their overbought readings, and the Momentum indicator turned lower around its midline, still unable to confirm further gains. In the shorter term, the 4 hours chart, the technical picture is neutral, given that the price is hovering around a horizontal 20 SMA and the technical indicators head nowhere around their midlines.
Support levels: 1,226.10 1,216.50 1,202.05
Resistance levels: 1,242.30 1,251.90 1,260.00
WTI CRUDE
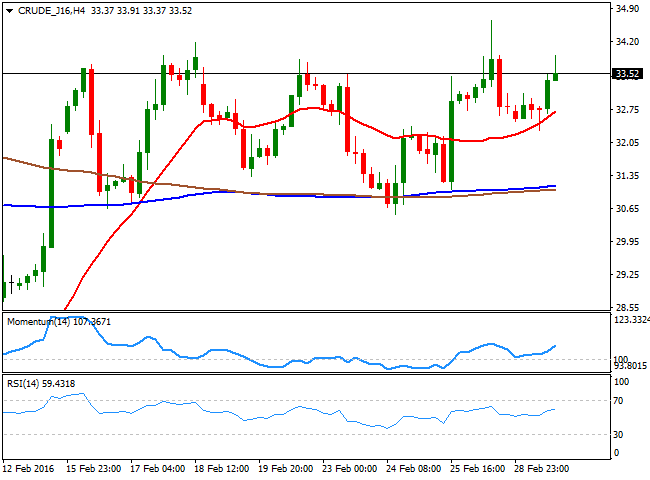
Crude oil prices advanced this Monday, supported by news that Saudi Arabia pledged to work with other crude producers to limit market volatility. Brent futures were trading at $35.98 per barrel by London's close, up 88 cents, or 2.5%. WTI futures nearer $34.00 a barrel during the American afternoon, and trades a handful of cents below it by the end of the day, maintaining a generally positive tone, with the daily chart showing that the price remains well above its 20 SMA, while the RSI indicator resumed its advance and heads north around 56. In the same chart, the Momentum indicator has lost upward steam and turned lower, but remains near overbought territory, far from anticipating an upcoming decline. In the 4 hours chart, the technical tone is clearly bullish, given that the price bounced sharply from around a bullish 20 SMA, while the technical indicators head north well into positive territory. Last week high at 34.65 is the level to take to confirm a more sustainable recovery beyond the 35.00 mark during the upcoming sessions.
Support levels: 33.10 32.55 31.90
Resistance levels: 34.65 35.20 36.00
DAX
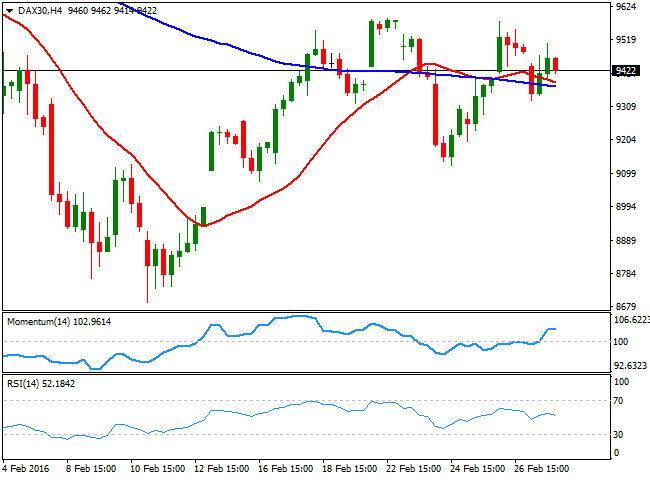
Stocks in Europe ended the day generally higher, supported by a recovery in oil's prices, which supporter energyrelated shares. Nevertheless, the German DAX closed 17 points lower at 9,495.40, weighed by poor European data, and diminishing optimism among investors, after G20 policymakers failed to come up with new measures to fight the ongoing economic slowdown. Automakers suffered the most, with BMW and Daimler down 1% each, although Volkswagen added 0.5%. From a technical point of view, the daily chart shows that the index remains above a bearish 20 SMA, while the technical indicators stand in positive territory, although losing their upward strength, not enough to confirm a downside continuation for this Tuesday. In the 4 hours chart, the technical stance is neutral as the index is actually hovering around its 20 and 100 SMAs, both horizontal some points below the current level, while the Momentum indicator has turned flat within positive territory, and the RSI indicator turned south around 51.
Support levels: 9,368 9,281 9,220
Resistance levels: 9,507 9,586 9,674
DOW JONES
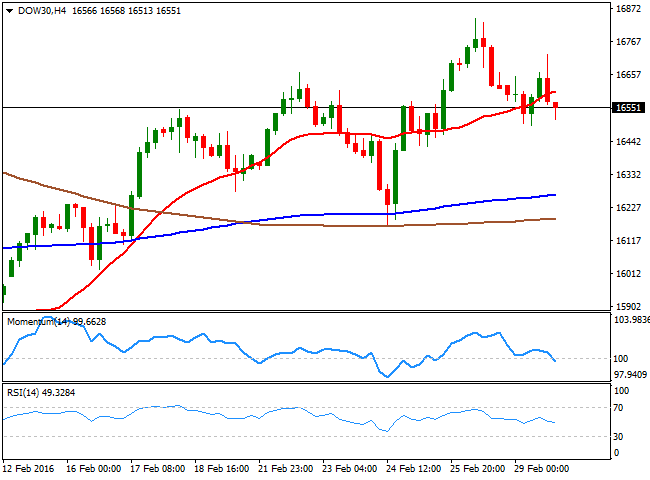
Wall Street wobbled within gains and losses for most of this Monday, but finally tuned into the red a couple of hours ahead of the close. The Dow Jones Industrial Average closed the day down by 123 points at 16,516.50, the Nasdaq shed 0.71% to end at 4,557.95, and the SandP lost 15 points to 1,932.23. For the SandP and the Nasdaq, is the third straight month of declines. Increasing uncertainty over economic growth sent investors away from stocks, and not even the recovery in oil was enough to support the US market. The DJIA, in its daily chart, is gaining bearish tone, as the technical indicators turned south from near overbought levels reached last Friday, although they are still far from suggesting a more sustainable decline in time. In the same chart, the 20 SMA continues to head slightly higher well below the current level, indicating a limited bearish potential at the time being. Shorter term, the 4 hours chart supports some further slides, as the index broke below its 20 SMA in the US session, while the technical indicators are entering bearish territory.
Support levels: 16,494 16,423 16,348
Resistance levels: 16,570 16,828 16,910
FTSE 100
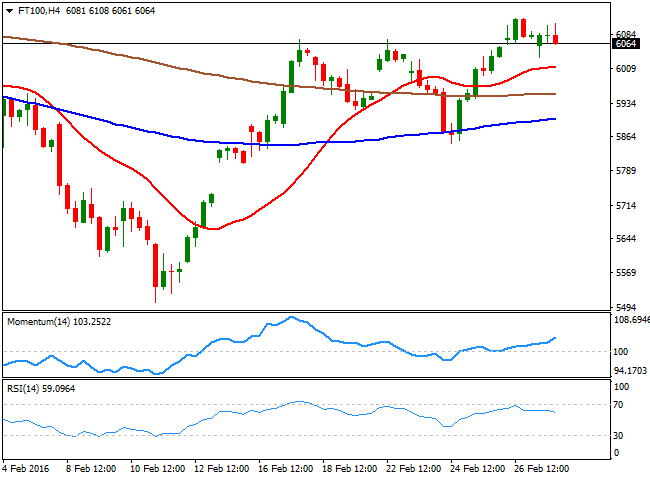
The FTSE 100 closed the day practically unchanged, up by 1 point, at 6,097.09, and by 0.2% in the month. Oil's recovery saved the day, as mining stocks led the way higher, with Anglo American up by 6.58% and Glencore by 3.90%. HSBC Holdings, on the other hand, was among the biggest fallers after Bernstein slashed the stock’s rating due to a sharp slowdown in Hong Kong and “unsustainable” dividend, downgrading the stock to “underperform”, sending it down by 1.7%. As for the technical readings, the daily chart shows that the upside remained limited by the 100 DMA, a strong dynamic resistance at 6,130, whilst the technical indicators remain within positive territory, but partially losing their upward strength. The 4 hours chart presents quite a similar picture, with the index developing above its moving averages and the technical indicator holding within positive territory, albeit with no directional strength. A decline below the 6,000 level may exacerbate the fall, particularly if market's sentiment turns negative this Tuesday.
Support levels: 6,027, 5,969 5,921
Resistance levels: 6,132 6,181 6,246
The information set forth herein was obtained from sources which we believe to be reliable, but its accuracy cannot be guaranteed. It is not intended to be an offer, or the solicitation of any offer, to buy or sell the products or instruments referred herein. Any person placing reliance on this commentary to undertake trading does so entirely at their own risk.
Recommended Content
Editors’ Picks
AUD/USD stands firm above 0.6500 with markets bracing for Aussie PPI, US inflation

The Aussie Dollar begins Friday’s Asian session on the right foot against the Greenback after posting gains of 0.33% on Thursday. The AUD/USD advance was sponsored by a United States report showing the economy is growing below estimates while inflation picked up. The pair traded at 0.6518.
EUR/USD mired near 1.0730 after choppy Thursday market session

EUR/USD whipsawed somewhat on Thursday, and the pair is heading into Friday's early session near 1.0730 after a back-and-forth session and complicated US data that vexed rate cut hopes.
Gold soars as US economic woes and inflation fears grip investors

Gold prices advanced modestly during Thursday’s North American session, gaining more than 0.5% following the release of crucial economic data from the United States. GDP figures for the first quarter of 2024 missed estimates, increasing speculation that the US Fed could lower borrowing costs.
Bitcoin price continues to get rejected from $65K resistance as SEC delays decision on spot BTC ETF options

Bitcoin (BTC) price has markets in disarray, provoking a broader market crash as it slumped to the $62,000 range on Thursday. Meanwhile, reverberations from spot BTC exchange-traded funds (ETFs) continue to influence the market.
Bank of Japan expected to keep interest rates on hold after landmark hike

The Bank of Japan is set to leave its short-term rate target unchanged in the range between 0% and 0.1% on Friday, following the conclusion of its two-day monetary policy review meeting for April. The BoJ will announce its decision on Friday at around 3:00 GMT.
