GOLD
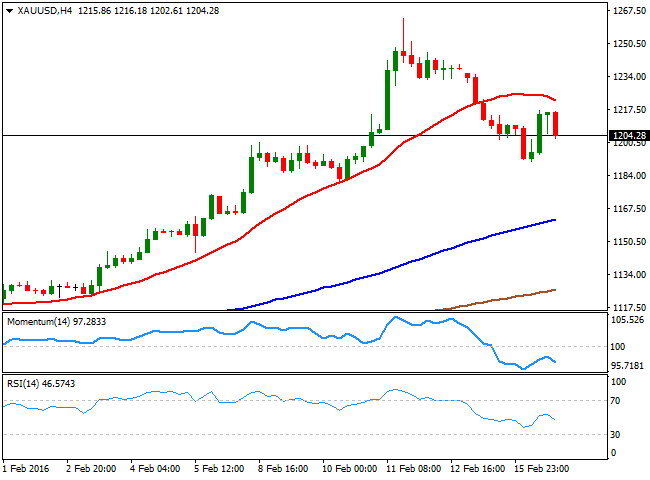
Gold extended its decline this Tuesday, with spot down to $1,190.89 a troy ounce at the beginning of the day, as Asian shares rose. But the commodity began recovering ground as oil plummeted, bringing back riskaverse trading and supporting an advance in the safe haven asset. The intraday recovery stalled around $1,217 mid American session, where the base metal turned back south amid broad dollar's strength. Now holding above 1,200.00, spot is poised to close its third straight day into the red, having posted daily basis a lower low and a lower high, in line with further declines. In the same chart, the technical indicators continued correcting overbought readings, but remain nearby while the 20 SMA advanced further below the current level, now around 1,160.00. Shorter term, the 4 hours chart suggest the commodity may retest the mentioned low, as the intraday recovery stalled below a bearish 20 SMA, while the technical indicators resumed their declines within bearish territory, and after correcting oversold readings.
Support levels:1,202.05 1,190.90 1,182.60
Resistance levels: 1,214.60 1,223.90 1,233.20
WTI CRUDE
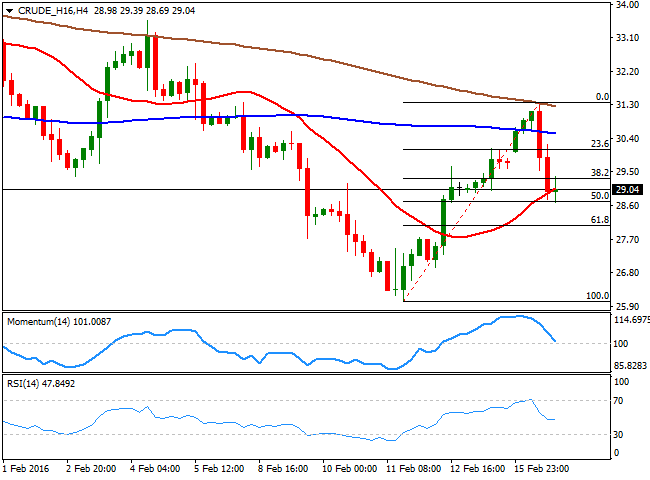
Crude oil prices surged early Tuesday, with WTI futures reaching $31.36 a barrel during the London session, but reversed course after the announcement of an agreement reached between Saudi Arabia, Russia, Qatar and Venezuela to freeze oil output at January level. The market was largely disappointed by the news, as is purely symbolic, considering worldwide production stands at record highs, and that a freeze will do little against the global glut that pushed the price lower during this last year. US crude fell towards $29.00, and remains around this last by the end of the day, having erased half of its latest gains. Technically, the daily chart shows that the price was unable to advance beyond its 20 SMA while the technical indicators have resumed their declines below their midlines, supporting some continued slides for this Wednesday. In the 4 hours chart, the technical indicators have turned sharply lower from overbought levels, and are currently around their midlines, while the price is hovering around a bullish 20 SMA, which suggest a break below 28.70, the immediate support, is required to confirm further slides.
Support levels: 28.70 27.90 27.20
Resistance levels: 29.40 30.10 30.80
EUR/USD
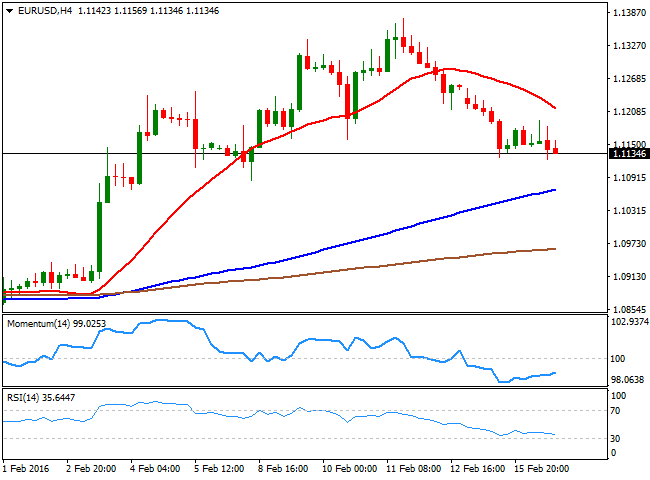
The American dollar surged against most of its major rivals, helped by a sudden reversal in market's sentiment, on renewed global woes. In the spotlight was once again oil, as Saudi Arabia, Russia and other oil producers agreed to freeze output at January levels. Oil was trading higher ahead of the news, but suddenly reversed course, as the announce was quite short of market's expectations for a production cut. Also, and as broadly expected, the German ZEW index disappointed, hit by market turmoil. According to February data, the assessment of the current situation fell to 52.3 from 59.7 in the previous month, while expectations dropped to 1.0 from a previous 10.2. In the US, the February 2016 Empire State Manufacturing Survey indicates that business activity continued to decline for local manufacturers, posting a largerthanexpected drop, down to 16.6.The EUR/USD pair edged lower for a third day inarow, stalling its decline in the 1.1120 region for a second day inarow. The short term picture points for a continued decline, as in the 1 hour chart, the price broke below the 20 SMA and remained below it during the American afternoon, whilst the technical indicators head lower within bearish territory. In the 4 hours chart, the 20 SMA has accelerated its decline above the current level, now offering resistance around 1.1210, whilst the Momentum indicator hovers near oversold levels and the RSI indicator heads south around 34. A downward acceleration through the mentioned support should see the decline accelerating towards the 1.1040/50 region during this Wednesday.
Support levels: 1.1120 1.1080 1.1045
Resistance levels: 1.1160 1.1210 1.1250
GBP/USD
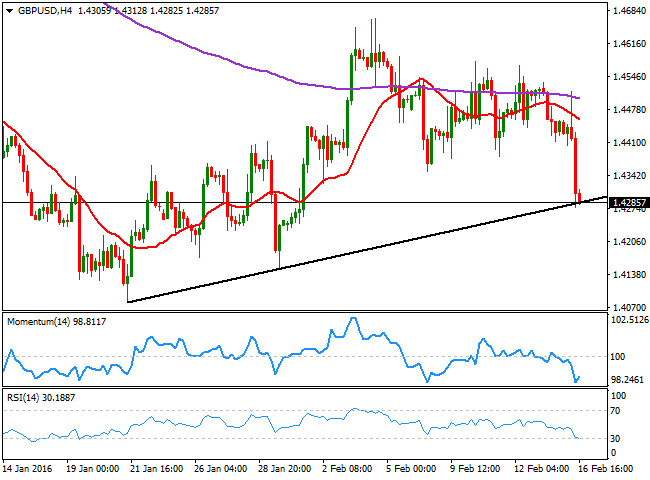
The GBP/USD pair fell after the release of the UK inflation data, as the headline consumer price inflation rose to 0.3%YoY in January from the 0.2%YoY rate recorded in December, but decline by 0.8% compared to a month before during the same period. Core inflation slowed to 1.2% yearonyear, while the Producer Price Indexes showed a sharp decline both in output and input. The pair was trading higher ahead of the news, but sharply reversed afterwards, extending its decline below the 1.4300 figure in the US session. This Wednesday, the kingdom will release its January employment figures, with wages expected to remain subdued. If that's the case, the reality will be that there isn't enough inflationary pressure over the Bank of England, and therefore a rate hike will remain out of the table for longer than expected. The 1 hour chart shows that the technical indicators have turned back south within oversold territory, while the price is well below a bearish 20 SMA, currently around 1.4410, supporting some further declines. In the 4 hours chart, the technical indicators are showing signs of exhaustion towards the downside within oversold territory, but at the same time the price shows a strong bearish acceleration after failing to overcome its 200 EMA, all of which supports the shorter term view.
Support levels: 1.4250 1.4210 1.4170
Resistance levels: 1.4325 1.4370 1.4410
USD/JPY
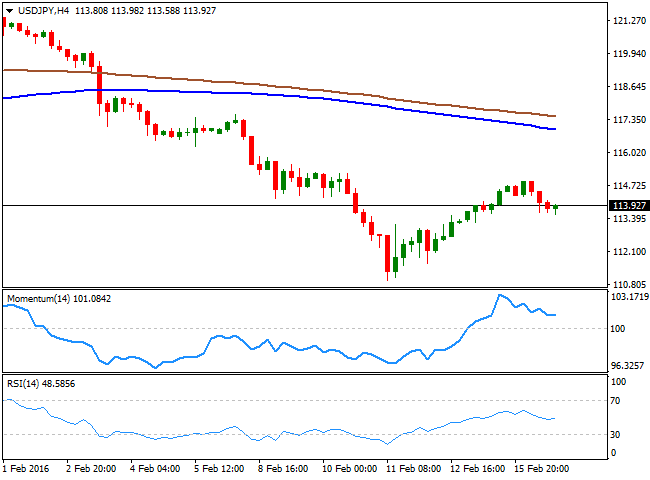
The USD/JPY pair traded as high as 114.86 during the past Asian session, but reversed course during European trading hours. Now recovering from a daily low of 113.58, the short term picture the upside seems limited, but the downward potential has decelerated, as in the 1 hour chart, the price trades below a bearish 200 SMA, while the technical indicators remain well into bearish territory, but with no directional strength. In the 4 hours chart, the technical indicators are aiming to recover ground within positive territory, after erasing the overbought conditions reached earlier in the day. Nevertheless, the pair will continue trading on sentiment, and upcoming direction will depend on Asian share markets' behavior, as if equities trade into the red, the Japanese will likely strengthen. The main support is the 113.35, as a break below it should see the pair accelerating its decline towards the 111.00 region, last week lows.
Support levels: 113.60 113.35 113.00
Resistance levels: 114.20 114.75 115.20
DAX
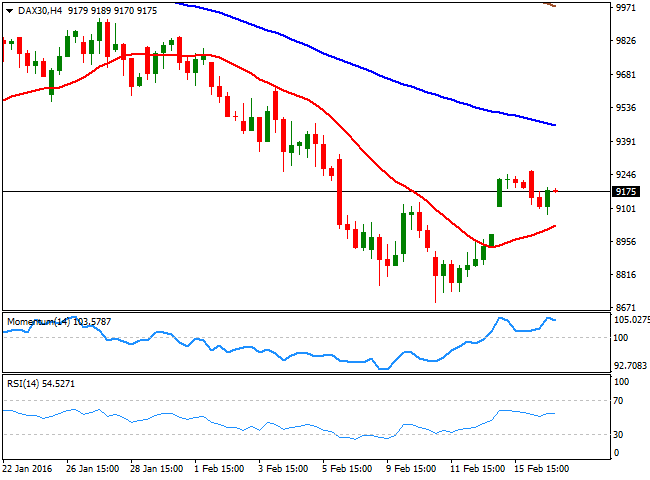
European equities turned lower, with the German DAX down by 71 points to close at 9,135.11, weighed by fading risk appetite and poor ZEW survey figures. The first was due to a sharp reversal in the latest oil's gains after worldwide producers failed to agree on an output cut. As for the second, the German sentiment indicator showed that confidence continued to erode among local business during this February. The index gained further in electronic trading as Wall Street surged, but the daily chart shows that it currently stands below its daily high of 9,266, whilst the technical indicators have lost their upward strength, well below their midlines, suggesting the risk may turn back south. In the 4 hours chart, the technical indicators have turned south, but remain well above their midlines, whilst the 20 SMA heads higher around 9,025. Should the benchmark fall below this last, further declines should be expected, back towards this month low in the 8,690 region.
Support levels: 9,112 9,025 8,966
Resistance levels: 9,266 9,334 9,418
DOW JONES
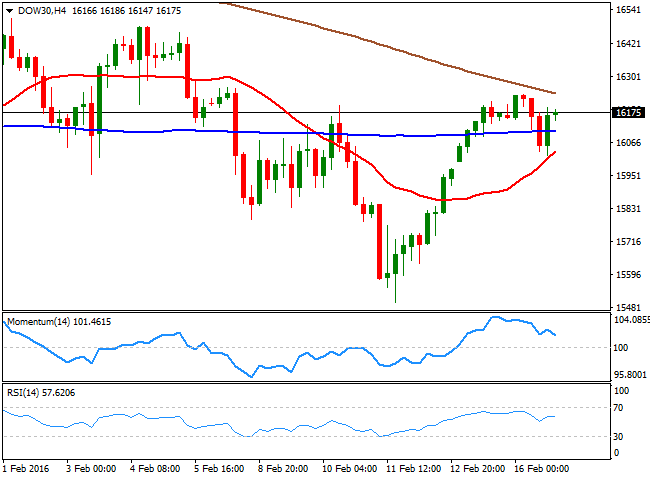
US indexes rallied in spite of oil's decline, up by second straight day and with the Dow Jones Industrial Average ending the day at 16,167.78, up by 193 points. The Nasdaq advanced 2.27% to end at 4,453.96, while the SandP added 30 points and closed at 1,895.58. The advance in the DJIA was led by strong advances in financial consumer and technology stocks. Technically, the daily chart shows that the latest recovery lacks upward momentum, as the index is barely a handful of points above a flat 20 SMA, while the technical indicators are flat within neutral territory. In the 4 hours chart, an early decline met buying interest around a bullish 20 SMA, currently at 16,034, although the Momentum indicator diverges lower, retreating towards its midline from overbought territory, whilst the RSI indicator stands flat around 57. Overall, the upside is still seen limited and advances are understood as corrective, with only a steeper recovery beyond the 16,500 region offering a more upsideconstructive outlook for the index.
Resistance levels: 16,239 16,310 16,376
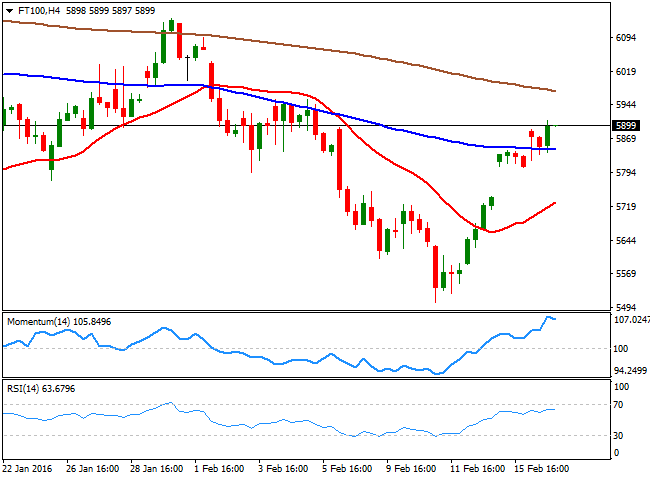
FTSE 100
The FTSE 100 closed at 5862.17, up by 38 points in quite a choppy session. Energyrelated stocks managed to hold on to gains, despite oil reversed course during the London session, with Royal Dutch Shell up by 1.56% and BP ending the day 1.38% higher. Also up was Merlin Entertainments, which announced a new chief financial officer on Tuesday, adding 2.9%. Banks, however, edged lower with Standard Chartered, down 5.3% after two brokerages cut their target prices following a recent rally. The continued advance in the index left a more constructive outlook in the daily chart, as the index is above its 20 SMA for the first time in over a week, while the technical indicators have extended their bullish slopes, but still below their midlines. In the 4 hours chart, the technical indicators are losing upward strength within overbought territory, but the index stands well above a bullish 20 SMA, supporting some continued advance towards the 6,000 region.
Support levels: 5,856 5,807 5,765
Resistance levels: 5,909 5,945 5,992
The information set forth herein was obtained from sources which we believe to be reliable, but its accuracy cannot be guaranteed. It is not intended to be an offer, or the solicitation of any offer, to buy or sell the products or instruments referred herein. Any person placing reliance on this commentary to undertake trading does so entirely at their own risk.
Recommended Content
Editors’ Picks
EUR/USD clings to daily gains above 1.0650

EUR/USD gained traction and turned positive on the day above 1.0650. The improvement seen in risk mood following the earlier flight to safety weighs on the US Dollar ahead of the weekend and helps the pair push higher.
GBP/USD recovers toward 1.2450 after UK Retail Sales data

GBP/USD reversed its direction and advanced to the 1.2450 area after touching a fresh multi-month low below 1.2400 in the Asian session. The positive shift seen in risk mood on easing fears over a deepening Iran-Israel conflict supports the pair.
Gold holds steady at around $2,380 following earlier spike

Gold stabilized near $2,380 after spiking above $2,400 with the immediate reaction to reports of Israel striking Iran. Meanwhile, the pullback seen in the US Treasury bond yields helps XAU/USD hold its ground.
Bitcoin Weekly Forecast: BTC post-halving rally could be partially priced in Premium

Bitcoin price shows no signs of directional bias while it holds above $60,000. The fourth BTC halving is partially priced in, according to Deutsche Bank’s research.
Week ahead – US GDP and BoJ decision on top of next week’s agenda

US GDP, core PCE and PMIs the next tests for the Dollar. Investors await BoJ for guidance about next rate hike. EU and UK PMIs, as well as Australian CPIs also on tap.
