EUR/USD
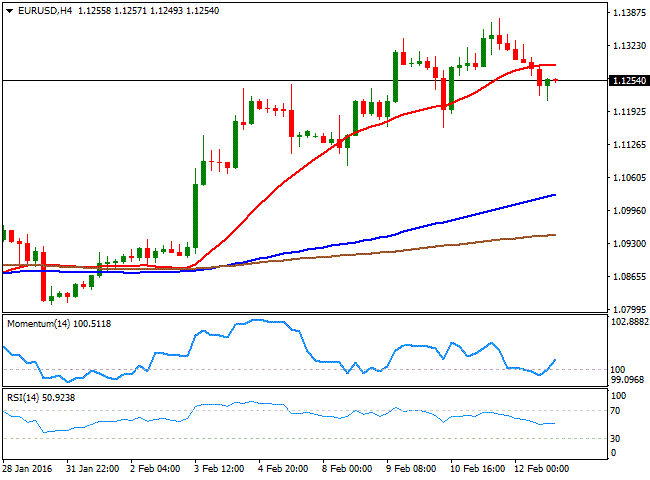
The dollar remained under pressure last week, down for a third week in arow amid turmoil in the financial world coming from fears of a global economic slowdown. The greenback managed to advance some on Friday, boosted by better than expected US Retail Sales and profit taking ahead of the weekend, but the outlook continues to be negative for the currency, as the background scenario that maintained it under pressure remains intact. During the upcoming days, the US will release the Minutes of the latest FOMC meeting, alongside with inflation and manufacturing figures, which if negative, will likely keep the greenback under pressure. Also, ECB's Mario Draghi will testify before an EU Parliament committee, generally expected to present a dovish stance, given latest EUR's strength. The EUR/USD rallied up to 1.1375, its highest since mid October, but retreated towards the mid 1.1250 region on Friday, and while the upward move has lost momentum, there are no technical signs that the trend will be changing course any time soon. The latest downward corrective movement may extend at the beginning of this week, according to technical readings, given that in the daily chart, the technical indicators have turned lower from oversold territory, and retain their bearish slopes. But in the same chart, the 20 SMA continued advancing beyond the 100 SMA and is about to cross the 200 SMA towards the upside, limiting the downward potential. In the 4 hours chart, the price broke below its 20 SMA, currently around 1.1295 and the immediate resistance, while the Momentum indicator bounced from its 100 level and the RSI consolidates around 50, also help keeping the downside limited.
Support levels: 1.1200 1.1160 1.1120
Resistance levels: 1.1299 1.1335 1.1380
GBP/USD
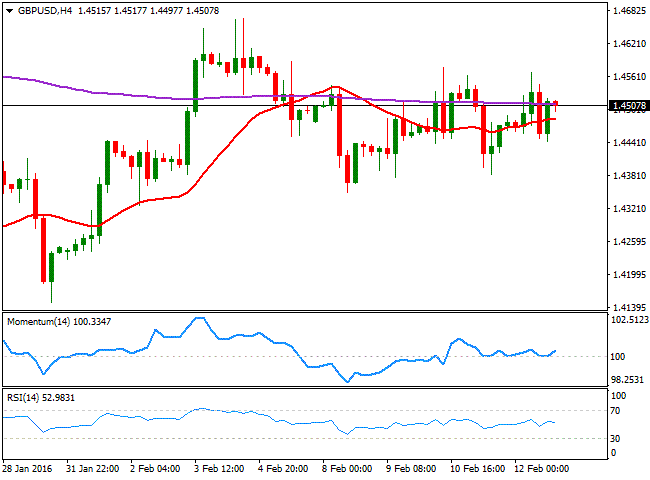
The GBP/USD pair ended the week flat around the 1.4500 level, with the Pound under pressure as the Bank of England has been quite dovish in its latest appearances, and Governor Mark Carney said that now, is no time to raise rates. Adding to the negative case for the British currency are fears of a Brexit, as the latest polls shown a large increase in those favoring a split. Nevertheless, the market is all about dollar's weakness these days, and the technical picture is bullish, as in the daily chart, the pair has been consistently meeting buying interest on approaches to a bullish 20 SMA, whilst the technical indicators head north, firmly above their midlines. Sellers, however, have contained advances between 1.4520/60, still the level to beat to confirm a more constructive outlook. Shorter term, the 4 hours chart presents a neutral stance, with the price hovering around its 20 SMA and 200 EMA, both lacking directional strength, while the technical indicators show no directional strength around their midlines.
Support levels: 1.4450 1.4400 1.14350
Resistance levels: 1.4525 1.4560 1.4600
USD/JPY
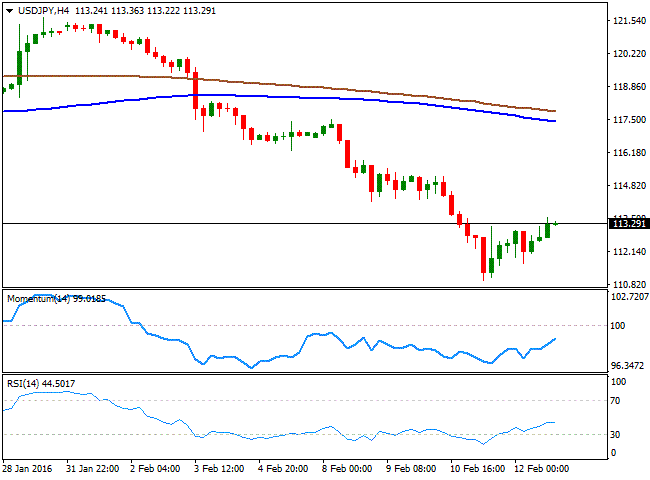
The USD/JPY pair shed over 1,000 pips ever since topping at 121.68 following BOJ's announcement of negative rates, as safehaven demand favored the Japanese currency. The pair fell down to 110.97 in an overstretched round of panic, when market talks about a probable intervention helped it bounced over 200 pips. There were no official confirmation of BOJ's action on Friday, but speculators believe the Central Bank sold a boatload of currency to halt the bleeding. Anyway, the pair's advance seems barely corrective and the risk remains towards the downside, as in the daily chart, the technical indicators have stalled their sharp declines, but remain in extreme oversold territory, not yet confirming further recoveries. In the 4 hours chart, the technical indicators have also corrected oversold readings, but the RSI indicator has lost its upward strength around 44, whilst the price develops well below its moving averages, indicating limited buying interest at the current levels. Former lows in the 114.20 region provide a critical resistance for the upcoming days, as it will take a steep recovery above it to confirm an interim bottom has taken place.
Support levels: 113.00 112.60 112.10
Resistance levels: 113.80 114.20 114.65
GOLD
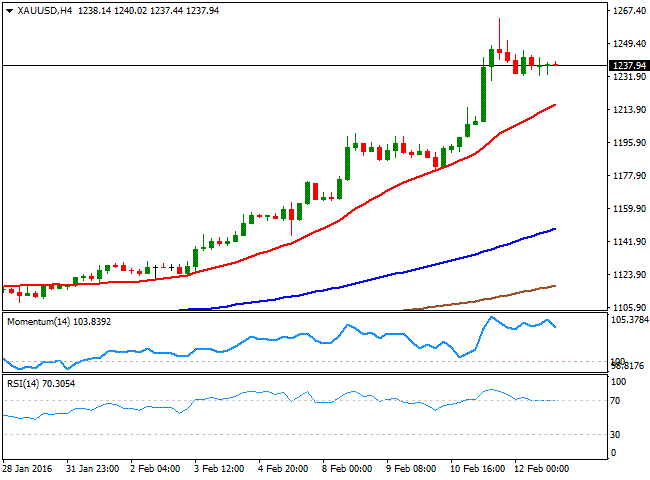
Gold was the overall winner last week, with spot running to a one year high of $1,263.36 a troy ounce, and closing the week with solid gains around 1.238.00. The commodity was clearly benefited by its safehaven condition, up by almost 20% ever since the year started. Despite most other commodities have been in a continued selloff on diminishing demand worldwide. The sharp 4week rally seems a bit overstretched and downward corrective movement should not be disregarded, although the latest price's behavior shows that speculators are taking pullbacks to buy. Daily basis, the technical indicators are beginning to lose upward strength within extreme overbought territory, supporting the case for a downward correction, although the 20 SMA has crossed almost vertically the 100 and 200 SMAs, far below the current level, in line with further long term gains. In the 4 hours chart, the price is well above a bullish 20 SMA, currently around 1,216.65, while the technical indicators have partially corrected extreme readings, supporting a bearish correction on a break below 1,229.57 the immediate support.
Support levels: 1,229.57 1,222.30 1,216.65
Resistance levels: 1,243.30 1,251.42 1,263.40
WTI CRUDE
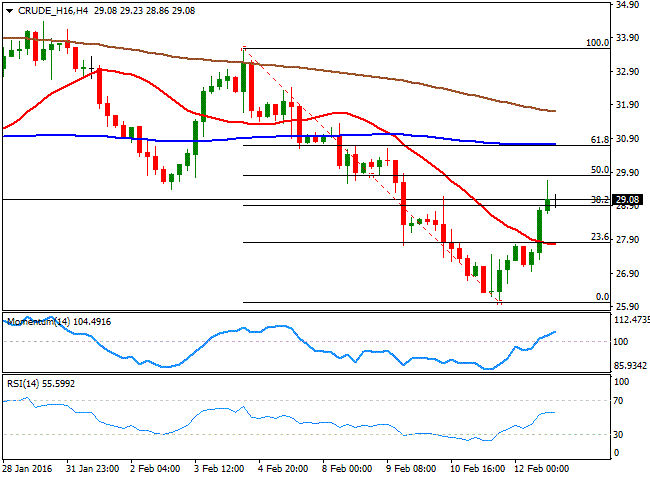
Crude oil prices bounced back on Friday, with West Texas Intermediate futures adding over $2.00, but held below $30.00 a barrel, ending a second week inarow in the red. After sinking to its lowest level in over 12years, the US benchmark bounced on some rumors suggesting worldwide producers are willing to cooperate on an output reduction, although there were no official announcement on it. Also, helping the commodity on Friday was the Baker Hughes report, showing that the US oil rig count fell for an eight straight week, down to 541 from previous 571. Nevertheless, the International Energy Agency warned last week that the excess of supply over demand is set to worsen, which means the long term outlook is still negative for crude. Technically, the daily chart shows that the price's recovery stalled below the 50% retracement of the latest daily decline, measured between 33.57 and 26.03. The 20 SMA in the same chart converges with the 61.8% retracement of the same decline around 30.80, a critical resistance for this Monday, whilst the technical indicators bounced tepidly from oversold readings. In the 4 hours chart, oil presents a bullish tone, as the price stands above its 20 SMA, while the technical indicators head slightly higher within positive territory.
Support levels: 28.50 27.70 27.10
Resistance levels: 29.90 30.80 31.50
DAX
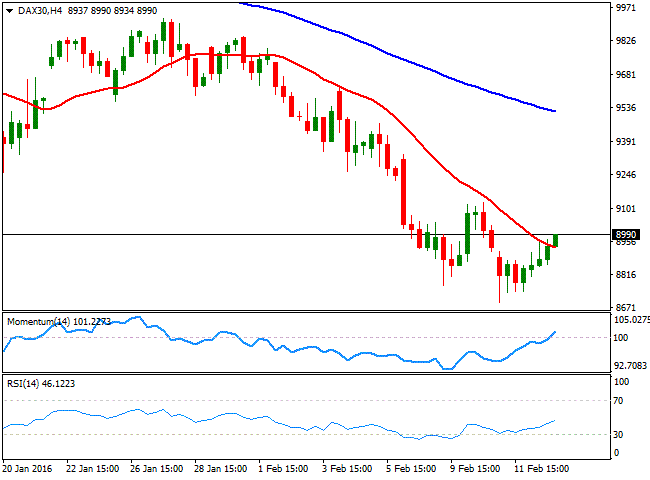
European stocks managed to recover ground and close in the green last Friday, with the German DAX up 2.45% to end at 8.967.51. The advance was supported by a recovery in oil prices, which sent the commodity related higher, but mostly due to some positive news affecting the banking sector. The Deutsche Bank, Germany's biggest bank, announced it would buy back more than $5billion in senior debt, surging by the end of the day by 11.8%. From a technical perspective, however, the long term bearish trend persists, with the index holding below the 9,000 mark by the end of the week. Technically, the daily chart shows that the technical indicators have bounced from oversold readings, but remain well below their midlines, whilst the 20 SMA has extended further its decline far above the current level. In the 4 hours chart, the technical indicators have crossed their midlines towards the upside and maintain their bullish slopes, as the index stands a few points above its 20 SMA, suggesting another short term leg higher for this Monday, before it can resume the dominant bearish trend.
Support levels: 8,934 8,857 8,742
Resistance levels: 9,014 9,126 9,200
DOW JONES
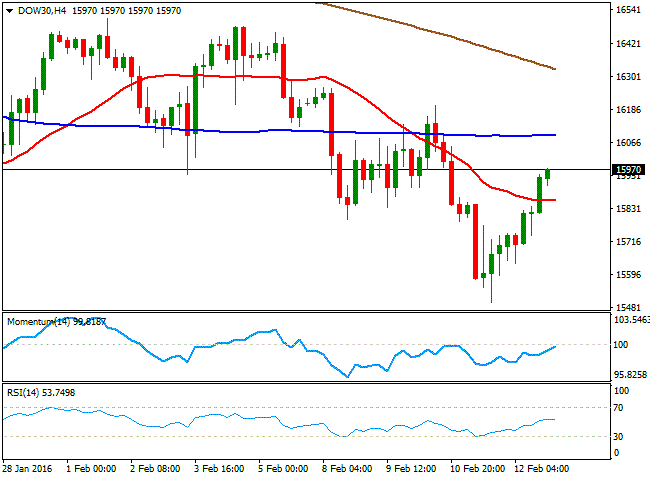
US indexes posted a nice recovery last Friday, with the DJIA advancing 313 points or 2.0% to end at 15,973.84. The Nasdaq advanced 70 points to 4,337.61, while the S and P added 1.95% and ended the week at 1,864.78. The comeback found was supported by a recovery in oil's prices, although Friday's gains weren't enough to prevent indexes closing in the red weekly basis. The stock market will be closed this Monday for Presidents Day, suggesting some limited action for this Monday, but the technical picture suggests the recovery may extend, at least in the short term. The daily chart for the DJIA shows that the technical indicators head higher around their midlines, lacking enough momentum to confirm a sharper advance, while the 20 SMA remains horizontal far above the current level. In the 4 hours chart, the technical indicators have extended their recoveries from oversold levels, but have lost upward steam below their midlines, whilst the index is a handful of points above its 20 SMA that anyway lacks directional strength.
Support levels: 15,916 15,829 15,743
Resistance levels: 16,037 16,133 16,199
FTSE 100
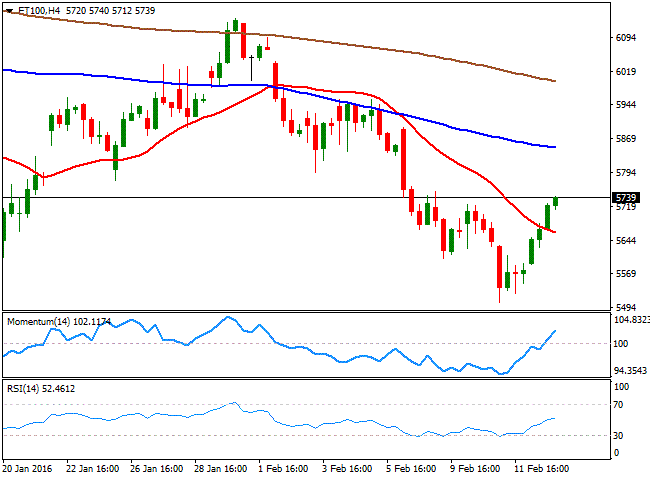
The London benchmark, the FTSE 100, added over 3.0% on Friday to close the week at 5,707.60, helped by a nice rebound in commodities, particularly oil, which resulted in Anglo American adding over 18% daily basis and Glencore jumping 12.3%. However, the index closed the week down by 2.4%, accumulating an 8.6% lost ever since the year started. The index ended the week a dew points above the mentioned close, having extended its gain in electronic trading amid US indexes recovery, suggesting some additional gains for this Monday. The risk however, may quickly turn back south on renewed risk averse trading. Technically, the daily chart shows that the technical indicators head higher within negative territory, with the Momentum indicator approaching its midline and the 20 SMA far above the current level. In the 4 hours chart, the Momentum indicator heads strongly higher above its 100 level, while the RSI indicator hovers around 52, and the index advanced above a bearish 20 SMA, in line with some short term gains.
Support levels: 5,702 5,661 5,604
Resistance levels: 5,760 5,804 5,882
The information set forth herein was obtained from sources which we believe to be reliable, but its accuracy cannot be guaranteed. It is not intended to be an offer, or the solicitation of any offer, to buy or sell the products or instruments referred herein. Any person placing reliance on this commentary to undertake trading does so entirely at their own risk.
Recommended Content
Editors’ Picks
EUR/USD clings to daily gains above 1.0650

EUR/USD gained traction and turned positive on the day above 1.0650. The improvement seen in risk mood following the earlier flight to safety weighs on the US Dollar ahead of the weekend and helps the pair push higher.
GBP/USD recovers toward 1.2450 after UK Retail Sales data

GBP/USD reversed its direction and advanced to the 1.2450 area after touching a fresh multi-month low below 1.2400 in the Asian session. The positive shift seen in risk mood on easing fears over a deepening Iran-Israel conflict supports the pair.
Gold holds steady at around $2,380 following earlier spike

Gold stabilized near $2,380 after spiking above $2,400 with the immediate reaction to reports of Israel striking Iran. Meanwhile, the pullback seen in the US Treasury bond yields helps XAU/USD hold its ground.
Bitcoin Weekly Forecast: BTC post-halving rally could be partially priced in Premium

Bitcoin price shows no signs of directional bias while it holds above $60,000. The fourth BTC halving is partially priced in, according to Deutsche Bank’s research.
Geopolitics once again take centre stage, as UK Retail Sales wither

Nearly a week to the day when Iran sent drones and missiles into Israel, Israel has retaliated and sent a missile into Iran. The initial reports caused a large uptick in the oil price.
