EUR/USD
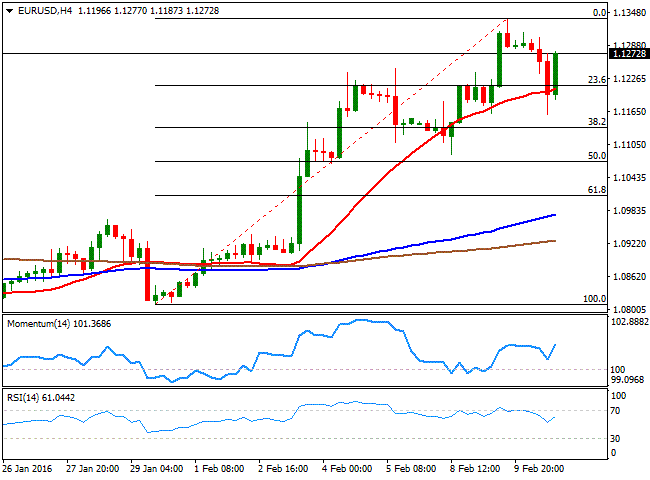
Yellen did little for the greenback in her semianual testimony on economic policy before the Congress, as the currency ended the day mostly lower across the board. The EUR, however, ended the day down against its American dollar, as European shares finally closed in the green this Wednesday . The US Central Bank's head said that "financial conditions in the United States have recently become less supportive of growth," but she also reiterated that they are ready for further tightening, should economic conditions allow. Despite the less dovishthanexpected stance, the greenback fell during the American afternoon, while stocks trimmed some of their early gains, and oil prices continued declining. During the upcoming Asian session, both China and Japan will be on holidays, pointing for some limited price action. For the most, markets have been and will likely continue trading on sentiment, with a doom outlook over worldwide economic growth.As for the EUR/USD, the pair fell down to 1.1160 before recovering above 1.1200, and rallied past former highs around 1.1245 ahead of the closing bell. The technical picture is still bullish, as in the 4 hours chart, the price has quickly recovered above a mild bullish 20 SMA, while the technical indicators resumed their advance within positive territory, presenting now sharp bullish slopes, after a limited downward corrective move. The line in the sand towards the downside is the 1.1120 as only below this level the pair can be at risk of further declines. In the meantime, investors are generally targeting the 1.1460 region, a major static resistance that contained the upside for most of this past 2015.
Support levels: 1.1245 1.1200 1.1160
Resistance levels: 1.1290 1.1335 1.1380
GBP/USD
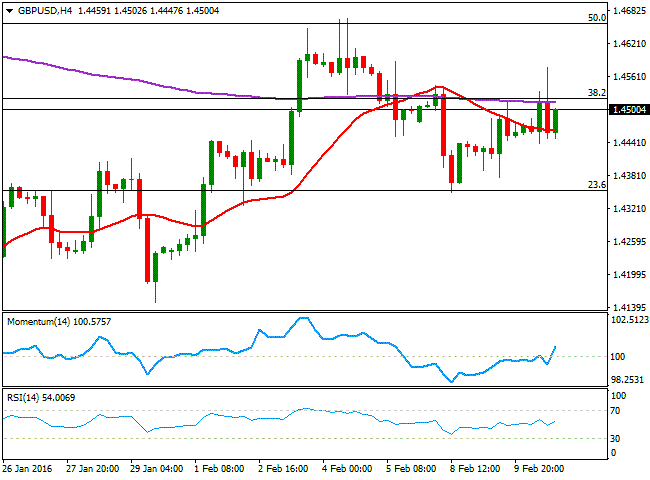
The GBP/USD pair ends the day with gains, in spite of poor industrial output data in the UK released earlier in the day. According to December figures, Britain had its worst quarter in almost three years by the end of 2015, as manufacturing production fell monthly basis by 0.2%, and 1.7% compared to a year before. Industrial production dropped by 1.1% compared to November, and fell by 0.4% on a yearonyear basis. Also, the NIESR GDP estimate showed a 0.4% growth in the three months ending January 2015, after a 0.5% advance in the three months ending in December. The pair trades around the 1.4500 figure after being as high as 1.4577, still meeting intraday selling interest in the 1.4520/30 region, where the pair has the 38.2% retracement of its latest weekly decline. Technically, the 1 hour chart shows that the price is advancing above a mild bullish 20 SMA, while the technical indicators are heading north after bouncing from their midlines, supporting some further gains, should the price finally break above the mentioned resistance. In the 4 hours chart, the Momentum indicator head strongly higher, while the 20 SMA has provided short term support ever since the day started, currently at 1.4460.
Support levels: 1.4460 1.4415 1.4370
Resistance levels: 1.4535 1.4580 1.4620
USD/JPY
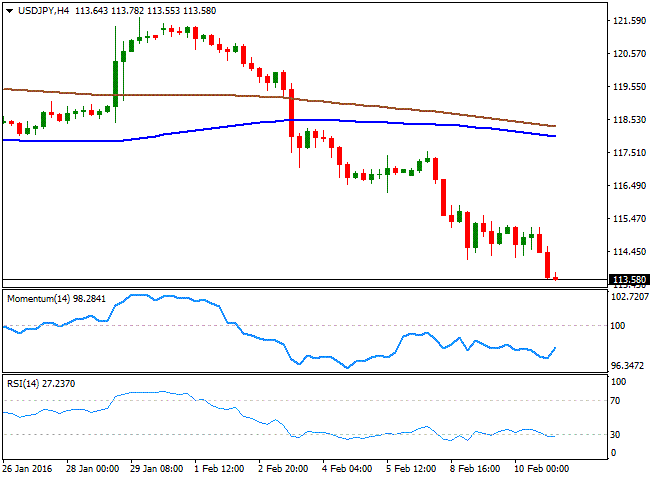
The Japanese yen gained further momentum against all of its major rivals, with the USD/JPY plummeting to the 113.50 region, last seen early November 2014. The pair attempted to recover ground earlier in the day, advancing up to 115.19 as market talks pointed out that the BOJ was calling interbank dealers to "check prices," a form of verbal intervention that usually helps the pair rising. Nevertheless, the rally was short lived, and this fresh lows are clearly showing that bears are in control. Short term, the technical outlook is still bearish, as the technical indicators have managed to post some upward corrections before resuming their declines, now approaching oversold territory, with a limited downward momentum, while the price continues developing well below its moving averages. In the 4 hours chart, the Momentum indicator hovers with no clear direction well below its midline, while the RSI indicator heads south at 29, indicating there's still room for additional declines.
Support levels: 113.30 112.90 112.50
Resistance levels: 113.80 114.20 114.65
GOLD
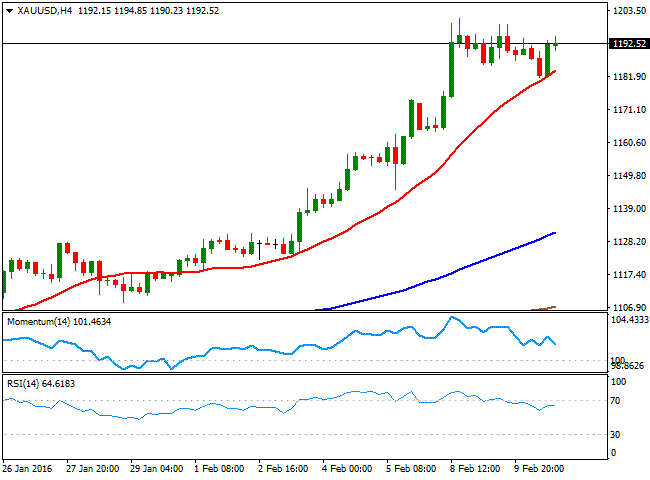
Gold prices traded within its latest range, for the most consolidating gains below the critical 1,200.00 level. Spot gold trades around $1,193.00 a troy ounce ahead of the US close, having recovered from a low of set a 1,181.46, as risk aversion eased temporarily during the European session. The bright metal retains the bullish tone seen on previous updates, as safehaven demand joined forces with a weaker dollar. The daily chart presents a bullish engulfing pattern that supports a break higher for the upcoming session. In the same chart, the technical indicators have eased some, but are mostly consolidating in overbought territory. In the 4 hours chart, the price has recovered from an early dip towards its 20 SMA, also supportive of a new leg higher, albeit the technical indicators have turned lower within positive territory, limiting chances of a rally in the short term, and as long as the price remains unable to break the high set at $1,200.90.
Support levels: 1,191.45 1,184.10 1,175.05
Resistance levels: 1,200.90 1,208.65 1,219.60
WTI CRUDE
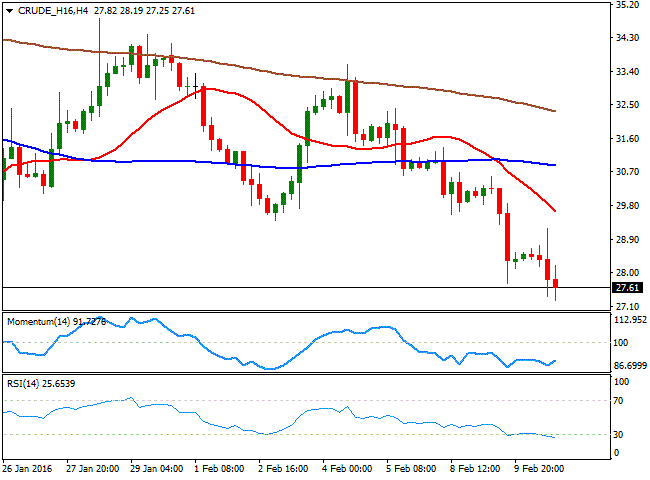
Crude oil prices have extended their decline towards fresh 12year lows, with WTI futures down to $27.25 a barrel in spite US crude stockpiles unexpectedly fell by 754K barrels against expectations of a 3.6M build, according to the latest EIA report. The commodity enjoyed some demand afterwards, and advanced briefly beyond $29.00, before turning back south, as a weekly decline is not enough to ease concerns over a worldwide glut. The black gold is currently a few cents above the mentioned low, and there are no technical signs that it will reverse course any time soon, as in the daily chart, the commodity posted a lower low and a lower high well below its moving averages, while the technical indicators remain well into negative territory. Furthermore, the RSI indicator maintains a strong bearish slope around 36, anticipating further declines. In the shorter term, the 4 hours chart shows that the RSI indicator heads south in oversold territory, while the Momentum indicator lacks directional strength within bearish territory as the 20 SMA heads strongly south above the current level.
Support levels: 27.25 26.60 26.00
Resistance levels: 27.90 28.60 29.20
DAX
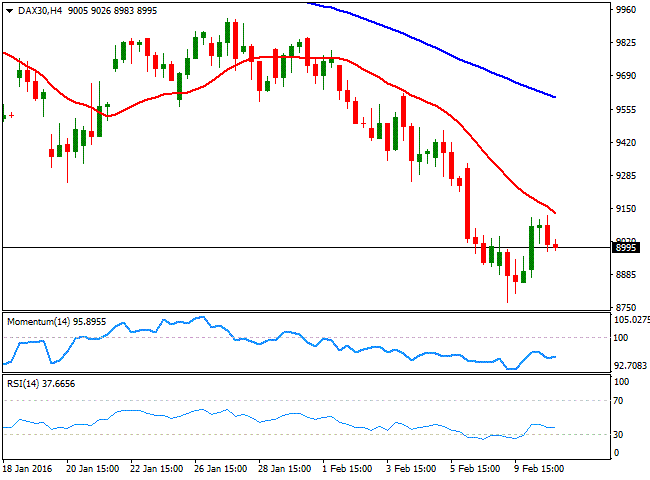
European stocks ended the day higher for the first time in the week, with banks' shares staging a comeback. The German DAX added 140 points or 1.55% to close at 9.071.29, with Deutsche Bank up by 10.22%, following news that the lender was considering buying back several billion euros of its debt, to soothe concerns about its funds. The daily advance, however, was not enough to revert the long term bearish trend of the index, currently trading around 8,981, as Wall Street struggles to maintain its daily limited gains. Technically, the price remains well below its midlines in the daily chart, while the technical indicators have lost bearish strength and consolidate near oversold levels, far from supporting further advances. In the 4 hours chart, the 20 SMA capped the upside, and offers a strong resistance now around 9,128,, while the technical indicators have resumed their declines within bearish territory after correcting oversold readings.
Support levels: 8,852 8,769 8,660
Resistance levels: 9,038 9,125 9,222
DOW JONES
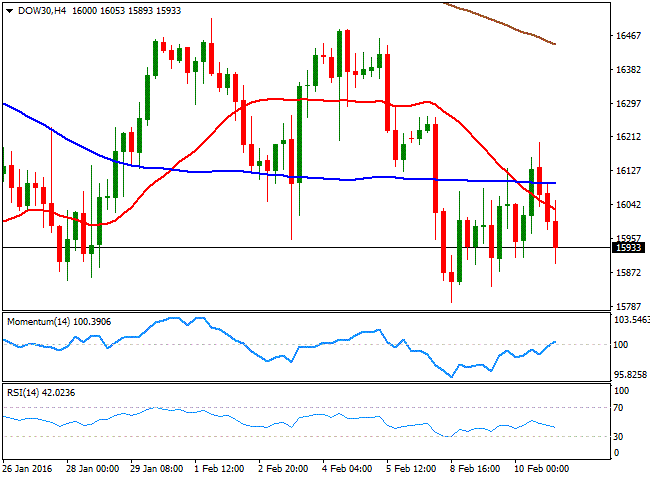
Wall Street closed mixed this Wednesday after FED's Yellen testimony, as despite maintaining the tightening path, the Central Bank's head acknowledged the downside risk to the economy coming from China. After quite a choppy session, the DJIA closed down 99 points at 15,914.60, the Nasdaq added 0.35% to end at 4,283.59, while the SandP ended flat at 1,851.86. The daily chart for the DJIA shows that the index once again failed to sustain gains beyond its 20 SMA, although it managed to advance up to 16,199 intraday. In the same chart, the Momentum indicator hovers around its midline, showing no directional strength, but the RSI indicator heads lower around 39, in line with further declines. In the shorter term, the 4 hours chart shows that the index is unable to clearly advance beyond a bearish 20 SMA, while the Momentum indicator is also stuck around its midline, and the RSI heads south within bearish territory, also supporting a bearish continuation on a break below 15,874, the immediate support.
Support levels: 15,874 15,795 15,692
Resistance levels: 16,034 16,130 16,192
FTSE 100
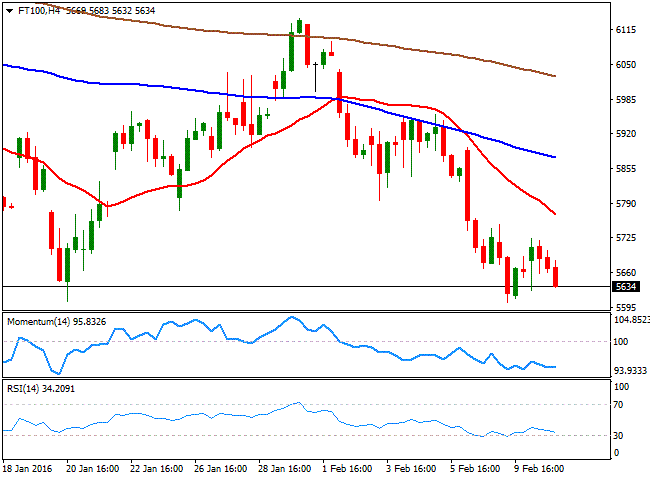
The FTSE 100 advanced 40 points or 0.71% this Wednesday , closing the day at 5,672.30, helped by a recovery in the banking sector, after sharp falls during the previous sessions. Among local ones, Barclays advanced 3%, the Royal Bank of Scotland was up 6.6p and HSBC gained 8.2p ahead to 440.7p. The Footsie held onto gains, despite the mining sector edged lower, with Antofagasta down by 3.1% and Randgold Resources by 3.5%. Trading around 5,637 ahead of the Asian opening, the daily chart shows that the index continued declining below a bearish 20 SMA, while the technical indicators head strongly lower below their midlines, maintaining the risk towards the downside. In the 4 hours chart, the technical indicators hover with no clear direction near oversold territory, while the 20 SMA has extended its decline further below the 100 SMA, both well above the current level, also supporting a bearish continuation for this Thursday .
Support levels: 5,604 5,562 5,510
Resistance levels: 5,692 5,760 5,808
The information set forth herein was obtained from sources which we believe to be reliable, but its accuracy cannot be guaranteed. It is not intended to be an offer, or the solicitation of any offer, to buy or sell the products or instruments referred herein. Any person placing reliance on this commentary to undertake trading does so entirely at their own risk.
Recommended Content
Editors’ Picks
EUR/USD consolidates gains below 1.0700 amid upbeat mood

EUR/USD is consolidating its recovery below 1.0700 in the European session on Thursday. The US Dollar holds its corrective decline amid improving market mood, despite looming Middle East geopolitical risks. Speeches from ECB and Fed officials remain on tap.
GBP/USD clings to moderate gains above 1.2450 on US Dollar weakness

GBP/USD is clinging to recovery gains above 1.2450 in European trading on Thursday. The pair stays supported by a sustained US Dollar weakness alongside the US Treasury bond yields. Risk appetite also underpins the higher-yielding currency pair. ahead of mid-tier US data and Fedspeak.
Gold appears a ‘buy-the-dips’ trade on simmering Israel-Iran tensions

Gold price attempts another run to reclaim $2,400 amid looming geopolitical risks. US Dollar pulls back with Treasury yields despite hawkish Fedspeak, as risk appetite returns.
Ripple faces significant correction as former SEC litigator says lawsuit could make it to Supreme Court

Ripple (XRP) price hovers below the key $0.50 level on Thursday after failing at another attempt to break and close above the resistance for the fourth day in a row.
Have we seen the extent of the Fed rate repricing?

Markets have been mostly consolidating recent moves into Thursday. We’ve seen some profit taking on Dollar longs and renewed demand for US equities into the dip. Whether or not this holds up is a completely different story.
