EUR/USD
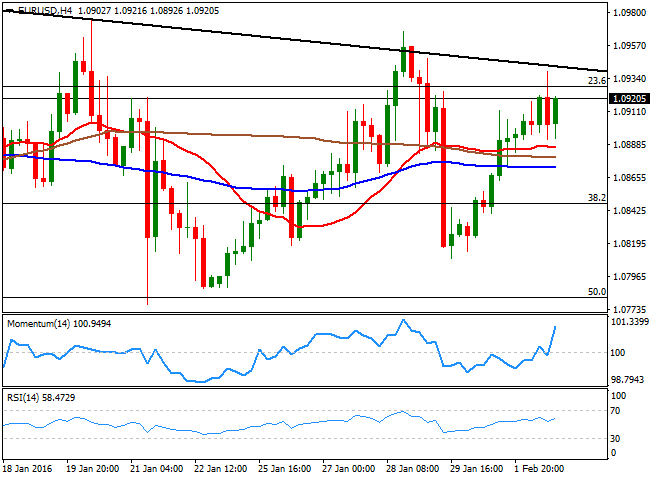
The American dollar traded broadly lower against most of its major rivals, as renewed oil's weakness spurred risk aversion across the board, resulting in a sharp decline in worldwide stocks. The TEUR/USD pair advanced up to a daily high of 1.0939 this Tuesday, but was unable to advance further beyond the top of its recent range, easing towards the 1.0890 region, where short term buying interest sent it back towards its highs. In Europe, the EU Producer Price Index in the region fell by 0.8% in December, compared to the previous month, and edged down to 3.0% compared to a year before. In Germany, however, unemployment fell to its lowest since German unification, down to 6.2% in January. In the US, Kansas FED's George repeated that upcoming rate hikes will depend on the economic outlook, and that the Central Bank should continue with a gradual pace of rate hikes. Also, oil prices plummeted, with WTI futures briefly falling below $30.00 a barrel, spurring some risk aversion and sending worldwide stocks into the red. As for the pair, the EUR/USD continues pressuring the top of its recent range, but remains unable to break higher, moreover as investors entered waitandsee mode ahead of the US Nonfarm Payroll report next Friday. Technically, the upside is favored according to the 4 hours chart, as the Momentum indicator heads sharply higher within bullish territory, while the RSI also heads north around 56, while the price stands above its moving averages. Nevertheless, the 1.0930/60 region has proved strong ever since mid December, and unless a strong break above it, the upside will remain limited.
Support levels:1.0880 1.0845 1.0810
Resistance levels: 1.0930 1.0960 1.1000
GBP/USD
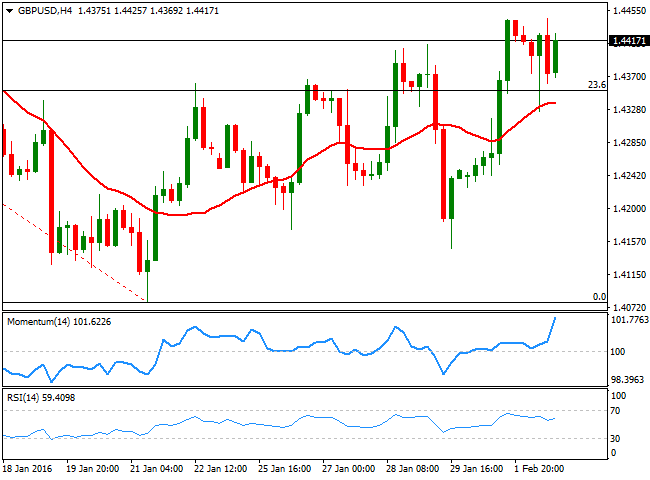
The British Pound looks quite constructive, having advanced up to 1.4445 against the greenback, and trading nearby at the end of the day. The GBP/USD fell down to 1.4325 in the European morning, weighed by worsethanexpected UK data, as the Construction PMI for January fell to 55.0 from 57.8 in December, showing the weakest expansion in the sector for nine months. The technical picture has become bullish in the short term, with the price now recovering above its 20 SMA and the technical indicators gaining bullish strength above their midlines in the 1 hour chart. In the 4 hours chart, the pair bounced earlier in the day from its 20 SMA which converges with the mentioned daily low, while the Momentum indicator heads sharply higher well above its 100 level and the RSI head slightly north around 59. Also, the pair seems to have broken above the 23.6% of its latest weekly decline, with the 38.2% retracement of the same rally converging with the 200 EMA in the 4 hours chart at 1.4530, being a probable bullish target in the case of further advances.
Support levels:1.4395 1.4360 1.4325
Resistance levels: 1.4445 1.4490 1.4530
USD/JPY
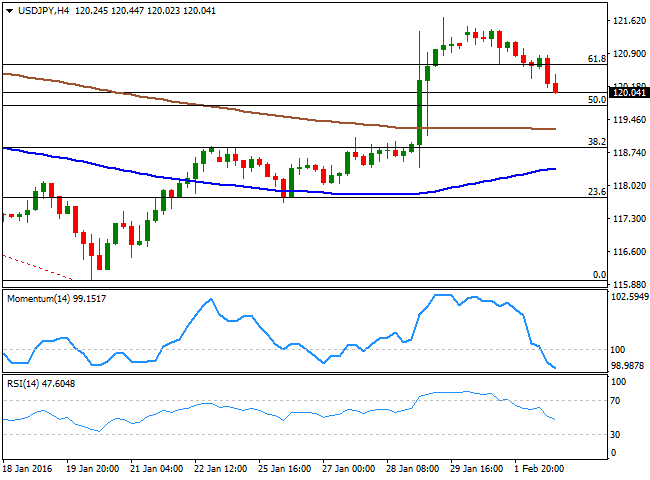
The USD/JPY pair sunk in the American session, as risk sentiment picked up following a triple digit decline in the DJIA. Crude oil prices fell towards $30.00 a barrel, and resume its roll of market leader, although China also had a part in ongoing riskaverse trading as the PBoC to intervene markets once again, by injecting 100bn Yuan. The 1 hour chart for the pair shows that the price is currently a couple of pips below its 100 SMA, while the technical indicators are giving signs of downward exhaustion near oversold territory, limiting chances of a downward acceleration. In the 4 hours chart, however, the pair presents a strong bearish tone, given that the technical indicators head sharply lower within bearish territory. The pair has now its next support around 119.75, the 50% retracement of the latest daily decline. A break below this last should signal further declines for this Wednesday, with 118.90 as a probable bearish target.
Support levels:119.75 119.35 118.90
Resistance levels:120.30 120.70 121.20
GOLD
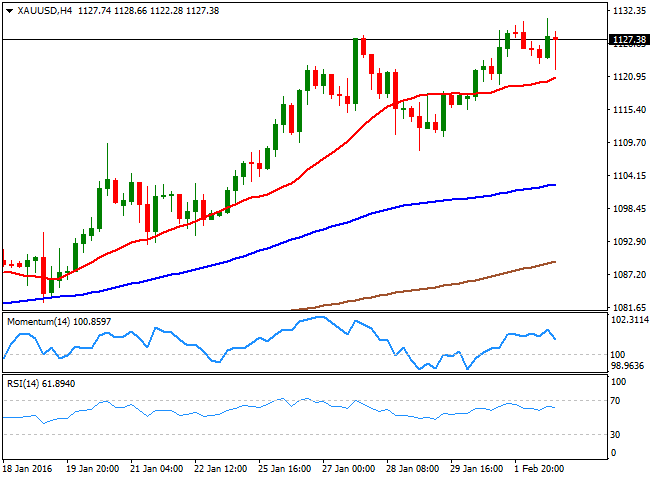
Gold prices fell at the beginning of the day, but managed to erase most of its intraday losses amid increasing demand for safe havens. Spot posted a higher high at $1,130.95 a troy ounce, and ends the day around 1,127.30, empathizing the increasing upward momentum of the bright metal, and supporting an even stronger rally. Daily basis, spot is well above its 200 DMA, while the 20 DMA is crossing above the 100 DMA below the larger one, supporting the positive bias, although the technical indicators have turned flat, well above their midlines. In the 4 hours chart, the price recovered sharply on an approach to a bullish 20 SMA, but the technical indicators are also losing upward strength within positive territory. This 20 SMA stands at 1,120.80, and as long as the level holds, the downside will remain limited, while the price needs to extend beyond 1,134.90 to confirm a new leg higher.
Support levels:1,120.80 1,115.70 1,109.60
Resistance levels:1,134.90 1,142.50 1,151.00
WTI CRUDE
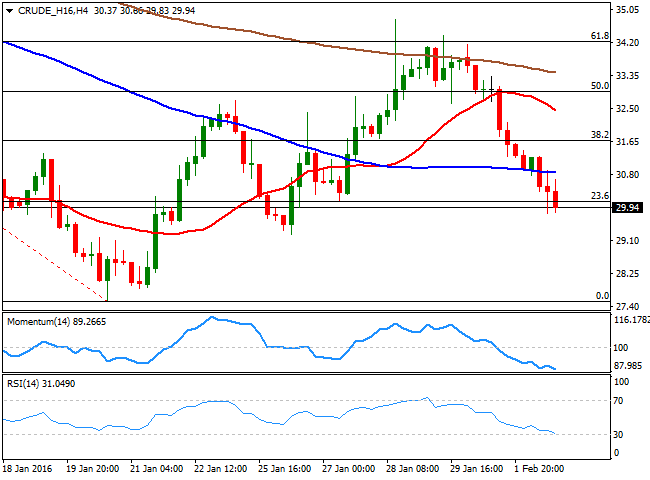
Crude oil prices fell for a second day inarow, still weighed by Chinese poor data that triggered concerns about decreasing global demand. West Texas Intermediate crude oil fell down to $29.70 a barrel during the American session, and remains stuck around $30.00. Adding to fresh markets concerns are expectations of larger stocks in the US, to be announced during the upcoming session, and fading hopes for an agreement on production cut. The daily chart shows that, after being rejected from the 61.8% retracement of the latest daily decline, the price is now struggling around the 23.6% retracement of the same rally, which suggests that further slides below the mentioned low can see the commodity returning to the 26.00 region. In the shorter term, and according to the 4 hour chart, the bearish momentum is strong, given that the technical indicators head sharply lower near oversold territory, while the 20 SMA is turning lower well above the current level, in line with further declines.
Support levels:29.75 29.20 28.60
Resistance levels:30.60 31.30 32.10
DAX
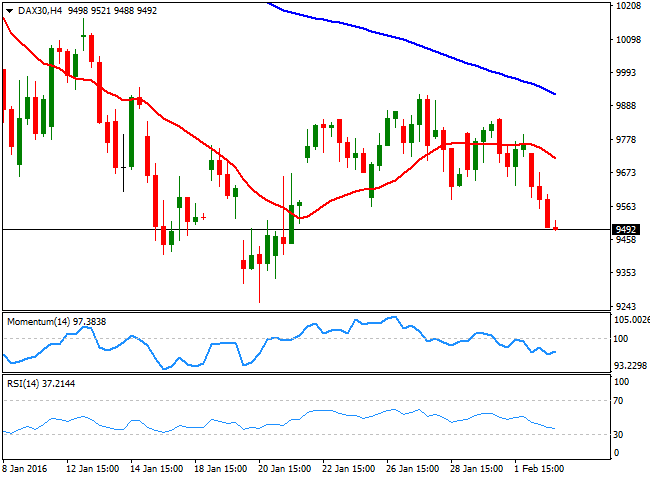
The German DAX fell alongside with all major European indexes, ending the day down by 1.81% at 9,581.04. The decline was led by commodityrelated equities as oil's prices came under renewed selling pressure. The benchmark fell further lower after the close as Wall Street sunk, and hovers around 9,490 ahead of the Asian session opening. The daily chart shows that the index fell sharply after faltering around a strongly bearish 20 SMA, and is back on the bearish track, given that the technical indicators have retreated from their midlines, and maintain their bearish slopes. In the 4 hours chart, the index is below a now bearish 20 SMA, while the technical indicators present limited bearish slopes within negative territory. The immediate support comes at 9,410 with a break below it opening doors for a retest of January low at 9,256.
Support levels:9,410 9,335 9,256
Resistance levels: 9,559 9,633 9,718
DOW JONES
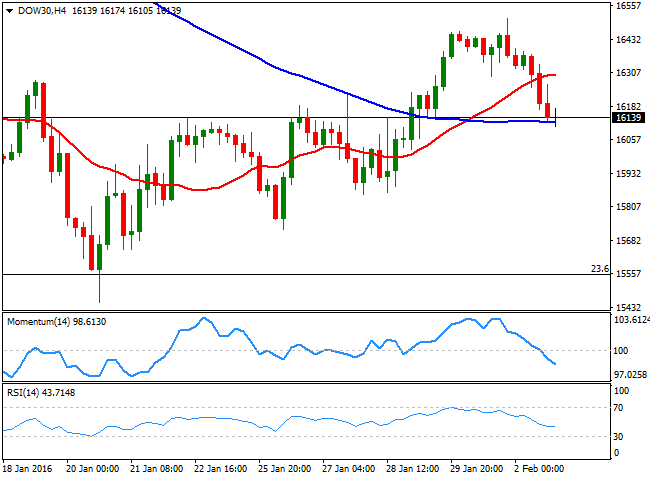
US indexes closed deep in the red, following a steep decline in oil's prices and global equity markets. The financial world ignored crude's woes on Monday, but resumed its correlation with the black gold this Tuesday. In the US, the energy sector plunged, offsetting earningsdriven gains by Alphabet, and Mattel. The DJIA lost 295 points and closed at 16,153.54. The Nasdaq lost 2.24% and closed at 4,516.95, while the SandP fell 36 points to 1,903.03. From a technical point of view, the daily chart shows that the index has stalled its decline around a horizontal 20 SMA, but remains slightly above it while the technical indicators have turned south around their midlines, increasing the risk of further declines. In the 4 hours chart, the index presents now a strong bearish momentum, as the technical indicators head south below their midlines, while the index has broken below its 20 SMA, supporting the longer term outlook.
Support levels:16,105 16,049 15,982
Resistance levels: 16,223 16,301 16,378
FTSE 100
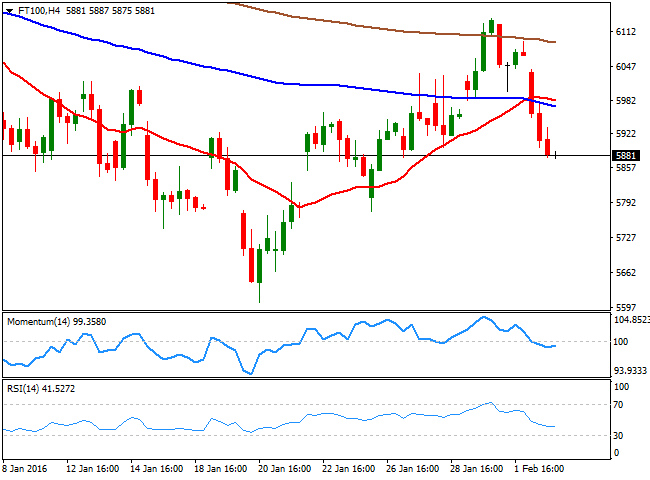
The FTSE 100 tumbled this Tuesday, losing 2.28% and ending the day at 5,922.01, with falling oil prices leading the way lower. Oil giants suffered the most with BP down 8.8% and Royal Dutch Shell shed 4.5%, as profits in both companies are expected to fall. Miners also traded lower, with Anglo American losing 8% amid reports it could be booted out of the FTSE 100 during the next index reshuffle in March. The pair has now a negative outlook, as in the daily chart, its back below a bearish 20 SMA, while the technical indicators have turned lower and are set to cross their midlines towards the downside. In the 4 hours chart, the index has accelerated its decline after breaking below the 20 SMA, while the technical indicators are mostly horizontal below their midlines, showing no certain directional strength. Nevertheless, the risk remains towards the downside, particularly with a downward acceleration below 5,876, the immediate support.
Support levels:5,876 5,820 5,765
Resistance levels:5,933 5,990 6,042
The information set forth herein was obtained from sources which we believe to be reliable, but its accuracy cannot be guaranteed. It is not intended to be an offer, or the solicitation of any offer, to buy or sell the products or instruments referred herein. Any person placing reliance on this commentary to undertake trading does so entirely at their own risk.
Recommended Content
Editors’ Picks
EUR/USD regains traction, recovers above 1.0700

EUR/USD regained its traction and turned positive on the day above 1.0700 in the American session. The US Dollar struggles to preserve its strength after the data from the US showed that the economy grew at a softer pace than expected in Q1.
GBP/USD returns to 1.2500 area in volatile session

GBP/USD reversed its direction and recovered to 1.2500 after falling to the 1.2450 area earlier in the day. Although markets remain risk-averse, the US Dollar struggles to find demand following the disappointing GDP data.
Gold climbs above $2,340 following earlier drop

Gold fell below $2,320 in the early American session as US yields shot higher after the data showed a significant increase in the US GDP price deflator in Q1. With safe-haven flows dominating the markets, however, XAU/USD reversed its direction and rose above $2,340.
XRP extends its decline, crypto experts comment on Ripple stablecoin and benefits for XRP Ledger

Ripple extends decline to $0.52 on Thursday, wipes out weekly gains. Crypto expert asks Ripple CTO how the stablecoin will benefit the XRP Ledger and native token XRP.
After the US close, it’s the Tokyo CPI

After the US close, it’s the Tokyo CPI, a reliable indicator of the national number and then the BoJ policy announcement. Tokyo CPI ex food and energy in Japan was a rise to 2.90% in March from 2.50%.
