EUR/USD
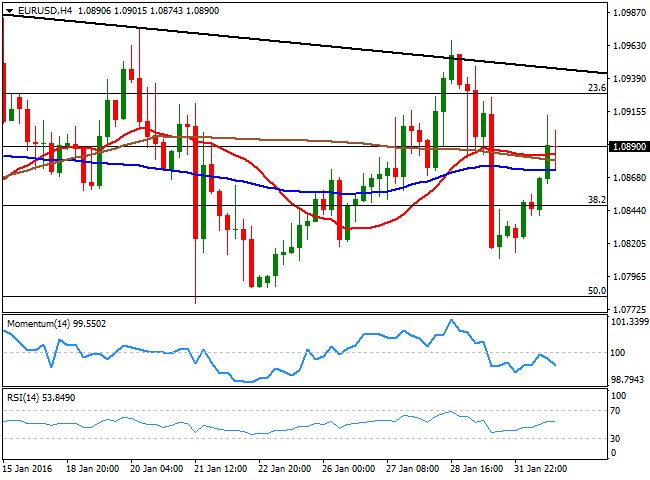
China spurred risk aversion at the beginning of the day, as the official manufacturing PMI was down to 49.4 in January from 49.7 in December. The Caixin Manufacturing PMI, also signaled a modest deterioration in operating conditions at the beginning of 2016, with both output and employment declining at slightly faster rates than in December, and resulting at 48.4 in January. In fact, PMI figures disappointed worldwide, with the exception of the UK figures, which came at a fresh 3month high. In the US, personal income surged by 0.3% in December, but consumption lacked, as spending was flat during December. The US manufacturing ISM for January was weakerthanexpected at 48.2, suggesting Friday's payrolls can be a miss, given that the employment component fell. The EUR/USD pair traded as high as 1.0912, as oil prices were under pressure ever since London opening, down towards $31.00 a barrel by the end of the US session. Nevertheless, the common currency was unable to gather enough momentum to rally, once again, meeting selling interest near the top of its range. Holding into gains, the pair trades below the 1.0900 level and the 4 hours chart shows that the price is a handful of pips above its moving averages that anyway remain flat and in a tight range. In the same chart, the Momentum indicator heads lower after failing to overcome its midline, while the RSI lacks directional strength around 54.
Support levels: 1.0845 1.0810 1.0770
Resistance levels: 1.0925 1.0960 1.1000
GBP/USD
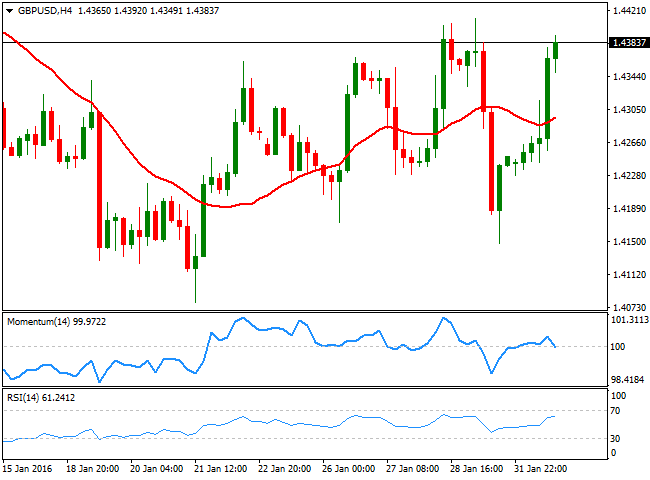
The British Pound outperformed its majors peers, having climbed to fresh daily highs against the dollar during the New York session. In spite of oil's decline, the GBP found support on a modest growth improvement in the UK as the Markit Manufacturing PMI for January reached a fresh 3month high of 52.9, up from December's 52.1. The pair retraced most of its Friday's losses, but lacked momentum to retest the 1.4400 area. Short term, the 1 hour chart shows that the technical indicators are losing upward strength, but hold within overbought territory, as the price remains near its daily high and far above a bullish 20 SMA, all of which supports some further advances. In the 4 hours chart, the price is steady above its 20 SMA, while the RSI indicator heads higher around 61, but the Momentum indicator lacks upward strength, and if fact turned lower around its 100 level. The pair established a high at 1.4412 last week, so it will take an acceleration beyond it to confirm additional gains towards the 1.4500 figure.
Support levels: 1.4360 1.4315 1.4270
Resistance levels: 1.4420 1.4460 1.4500
USD/JPY
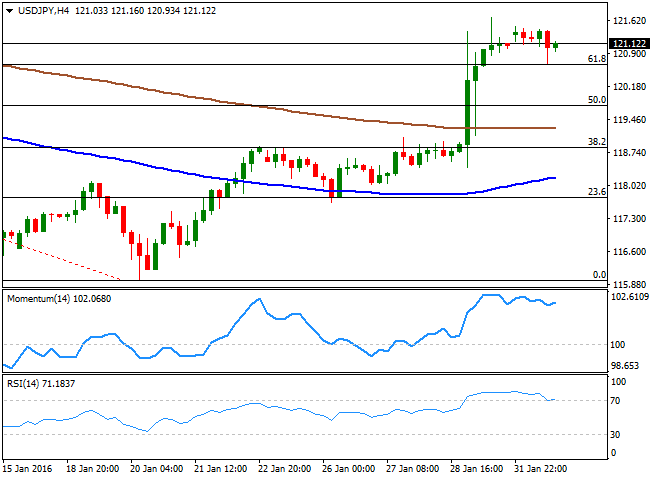
The USD/JPY pair showed little signs of life this Monday, falling down to 120.67 after the release of poor US data, but quickly recovering above the 121.00 level, ending the day around Friday's close. The daily chart shows that the pair remained trapped between its 100 DMA, offering support around the mentioned low, and the 200 DMA, at 121.50, maintaining the latest bullish trend in place. Shorter term the 1 hour chart shows that the technical indicators are horizontal within neutral territory, but the price remains well above its moving averages. In the 4 hours chart, the technical indicators have corrected partially extreme overbought readings, but are aiming back higher, whilst the price is above the 61.8% retracement of its latest bearish run at 120.60. As long as this last level holds, the downside will remain limited, albeit an advance above 121.70, last week high is required to confirm further gains for this Tuesday.
Support levels: 121.00 120.60 120.15
Resistance levels: 121.70 122.10 122.40
GOLD
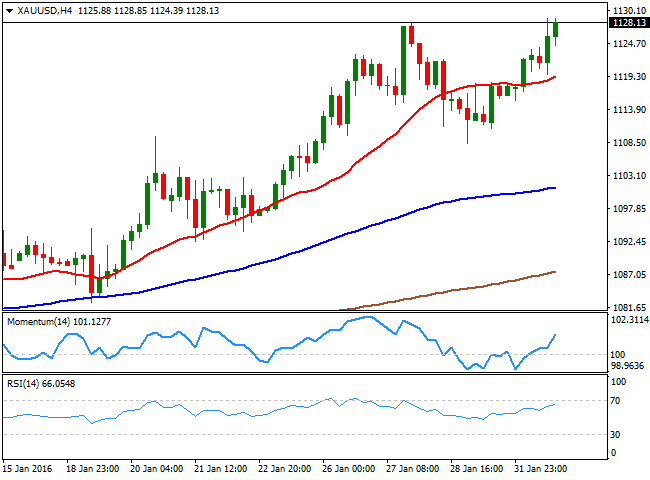
Gold prices climbed to a fresh threemonth high, with spot up to $1,128.85 a troy ounce. Chinese poor manufacturing readings spurred risk aversion ever since the day started, later fueled by tepid US figures, which led to a decline in stocks. Falling oil prices also sent investors towards the safehaven commodity that holds near its daily high by the end of the day. The daily chart shows that the bright metal recovered back above its 200 DMA, while the RSI indicator anticipates further gains by heading higher around 66. In the same chart, the Momentum indicator holds steady well above its midline, but lacks directional strength as the price is within last week range. Shorter term, the 4 hours chart shows that that the price has advanced above a bullish 20 SMA, while the technical indicators head north above their midlines, also in line with additional gains for the upcoming sessions.
Support levels: 1,122.10 1,115.70 1,109.60
Resistance levels: 1,134.90 1,142.50 1,151.00
WTI CRUDE
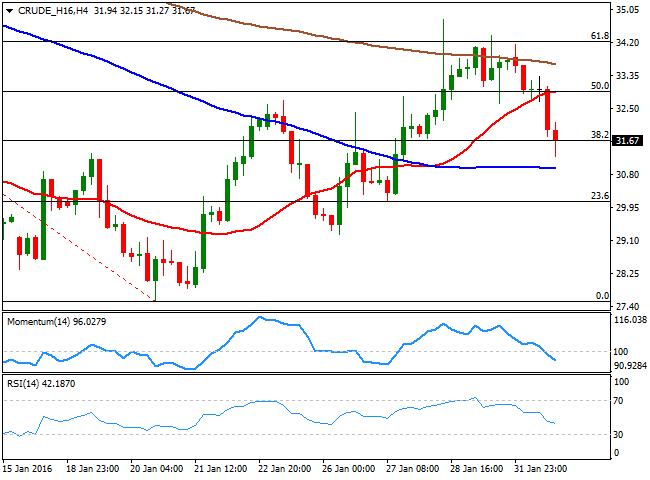
Oil prices fell on Monday, weighed by poor Chinese economic data and diminishing hopes of an agreement among OPEC and nonOPEC producers to cut output. Brent closed barely above $34.00 a barrel after briefly falling below the level, while WTI crude oil futures traded as low as $31.27 a barrel mid American session, bouncing roughly 50 cents by the end of the session. From a technical point of view, the price is currently trading around the 38.2% retracement of the latest daily decline, at 31.65, while the decline stalled a few cents above a horizontal 20 SMA in the daily chart. In the same chart, the technical indicators have turned south, with the RSI indicator already in bearish territory, all of which suggests further slides are likely. In the shorter term, the 4 hours chart, shows that the technical indicators head sharply lower below their midlines, while the price is well below the 20 SMA. A break below the mentioned daily low should signal further declines towards the 30.00 figure.
Support levels: 31.20 30.60 30.00
Resistance levels: 32.30 32.90 33.70
DAX
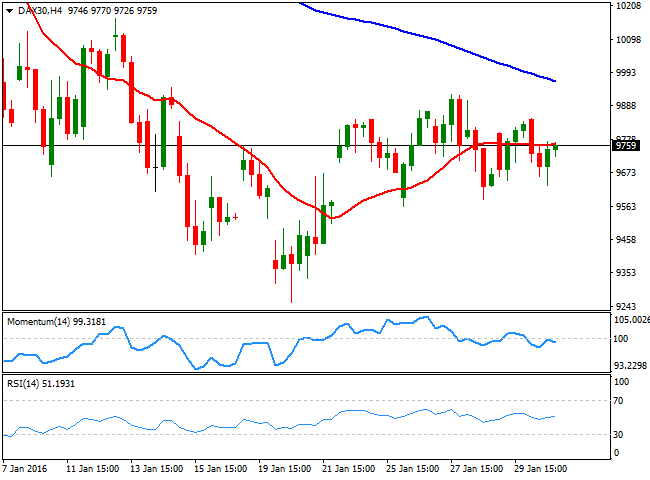
European indexes closed the day with some losses after a choppy journey, with the German DAX down by 40 points to 9,757.88. The release of the final Markit PMIs for January showed a slow start for the manufacturing session at the beginning of the year, as the German and EU figures came below December ones. The daily chart shows that the index is currently hovering around a bearish 20 SMA, whilst the technical indicators have gained tepid bearish slopes below their midlines, maintaining the risk towards the downside. In the 4 hours chart, the index presents a neutral stance, as its moving back and forth around a flat 20 SMA, while the technical indicators lack directional strength around their midlines. A recovery above 9,847, the daily chart, should signal easing bearish pressure, yet a rally towards 10,000 is still seen as unlikely, at least for this Tuesday.
Support levels: 9,712 9,648 9,588
Resistance levels: 9,847 9,921 10,000
DOW JONES
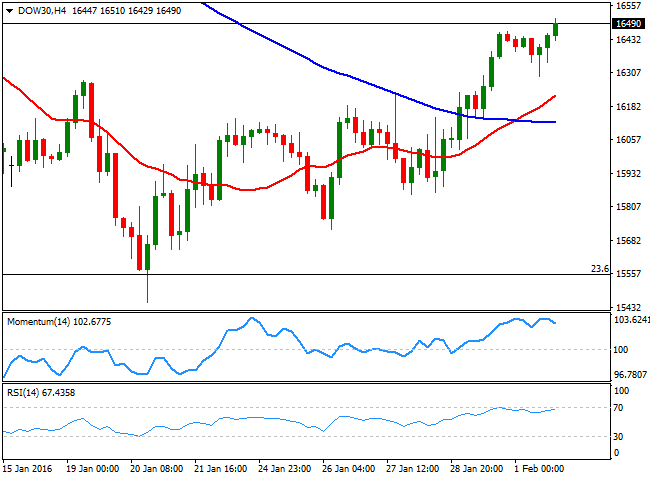
Wall Street ended the day mostly lower, after wobbling between gains and losses for most of the session, unable to set a clear directional trend. The DJIA retreated from a daily high of 16,510 right before the closing bell, to end the day at 16,449.18, down by 17 points. The Nasdaq added 6 points, while the SandP closed the day barely unchanged, down 0.04% at 1,939.38. Technically, the daily chart shows that the bullish tone seen on previous updates in the DJIA persists, given that the index erased most of its early losses, triggered by falling oil prices. In the mentioned chart, the 20 SMA is now flat, far below the current level, while the Momentum indicator heads higher at fresh 2month highs, while the RSI indicator has turned flat around 51. In the 4 hour chart, the 20 SMA has advanced above the 100 SMA, with both well below the current level, while the technical indicators turned south near overbought readings, rather reflecting the latest retracement than suggesting a bearish move ahead. Some earnings reports will be released after the close, which means the index can continue trading on local data. Nevertheless, overall market sentiment is turning negative, which means that if risk aversion resurges during the Asian session, the index will likely turn south, and will maintain the bearish bias for most of this upcoming Tuesday.
Support levels :16,387 16,310 16,240
Resistance levels: 16,510 16,545 16,619
FTSE 100
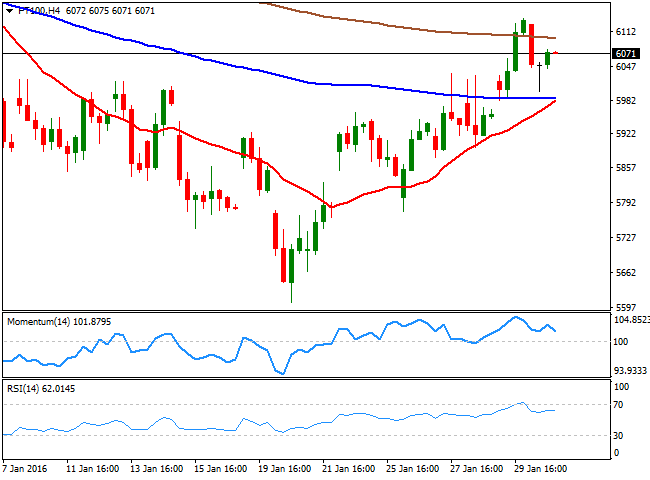
The FTSE 100 lost 23 points or 0.39% to close at 6,060.10 this Monday, trading slightly above the level in electronic trading. The early decline can be attributed to weaker oil prices, which resulted in strong losses in the energy sector, with BP down 2.43% and Royal Dutch Shell closing 1.38% lower. The mining sector fell following Chinese poor data, with Antofagasta down 1.63% and Rio Tinto 1.1%. Strong local data however, contained the decline, as local manufacturing started the year with a strong footing. The index traded within Friday's range, and the daily chart shows that while it still holds above a bearish 20 SMA, the technical indicators have turned south in positive territory. In the 4 hours chart, the index has recovered after approaching its 100 SMA, while remains above a bullish 20 SMA. Indicators in this last time frame however, diverge from each other well into positive territory, maintaining the upside limited as long as the index remains below 6,136, Friday's high.
Support levels: 6,042 5,983 5,918
Resistance levels: 6,136 6,169 6,210
The information set forth herein was obtained from sources which we believe to be reliable, but its accuracy cannot be guaranteed. It is not intended to be an offer, or the solicitation of any offer, to buy or sell the products or instruments referred herein. Any person placing reliance on this commentary to undertake trading does so entirely at their own risk.
Recommended Content
Editors’ Picks
AUD/USD risks a deeper drop in the short term

AUD/USD rapidly left behind Wednesday’s decent advance and resumed its downward trend on the back of the intense buying pressure in the greenback, while mixed results from the domestic labour market report failed to lend support to AUD.
EUR/USD leaves the door open to a decline to 1.0600

A decent comeback in the Greenback lured sellers back into the market, motivating EUR/USD to give away the earlier advance to weekly tops around 1.0690 and shift its attention to a potential revisit of the 1.0600 neighbourhood instead.
Gold is closely monitoring geopolitics

Gold trades in positive territory above $2,380 on Thursday. Although the benchmark 10-year US Treasury bond yield holds steady following upbeat US data, XAU/USD continues to stretch higher on growing fears over a deepening conflict in the Middle East.
Bitcoin price shows strength as IMF attests to spread and intensity of BTC transactions ahead of halving

Bitcoin (BTC) price is borderline strong and weak with the brunt of the weakness being felt by altcoins. Regarding strength, it continues to close above the $60,000 threshold for seven weeks in a row.
Is the Biden administration trying to destroy the Dollar?

Confidence in Western financial markets has already been shaken enough by the 20% devaluation of the dollar over the last few years. But now the European Commission wants to hand Ukraine $300 billion seized from Russia.
