EUR/USD
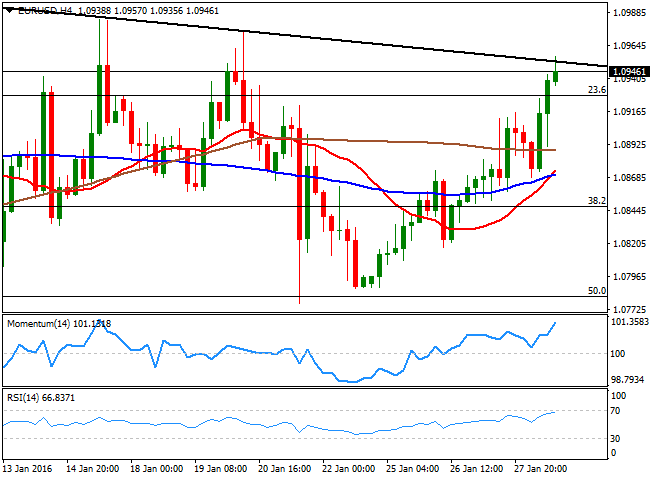
The macroeconomic calendar was pretty busy this Thursday, both in Europe and the US, but majors continued following crude's prices when it comes to set direction. The commodity soared on speculation oil producers were talking to reduce output, but the news was later denied. In the EU, the economic sentiment index fell for February, down to 105.0, below the expected 106.4 German inflation was up in January to 0.5% YoY, from 0.3% in December, on the back of higher food prices. On the month, German prices dropped by 0.8%, matching expectations. In the EU the economic sentiment index for February resulted at 105.0, below the expected 106.4. But the star of the day was indeed US Durable Goods Orders, much worsethanexpected as monthly basis it fell by 5.1%, while the US weekly unemployment claims came out at 278K for the week ending Jan 22. Crude prices were also in the eye of the storm, with WTI up to $34.80 a barrel before retreating towards $33.00 by the end of the day.The EUR/USD advanced for a fourth day in a row, and holds near a daily high set at 1.0957, where a daily descendant trend line coming from December high, finally halted the advance. The technical picture for the pair shows that it is at a brink of breaking higher, given that its ending the day above a Fibonacci level, and it's also above its 100 DMA, closing above it for the first time since last October. Short term, the 1 hour chart shows that the technical indicators hover near overbought levels, while the 20 SMA heads north around the 1.0900 figure, acting as an intraday support. In the 4 hours chart, the price has moved away from its moving averages, while the Momentum indicator presents a clear upward slope, supporting additional advances, particularly on an upward acceleration above 1.0960.
Support levels: 1.0930 1.0900 1.0860
Resistance levels: 1.0960 1.1000 1.1045
GBP/USD
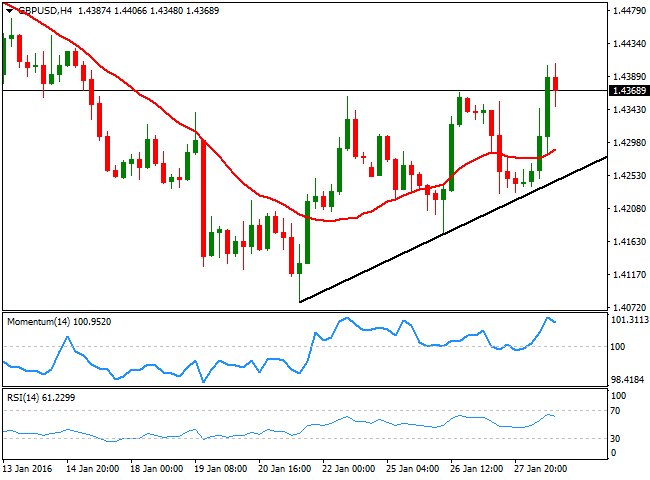
The British Pound is still having a hard time when it comes to recover ground against the greenback, although the pair advanced up to 1.4406 this Thursday, helped by the release of the first estimate of the UK Q4 2015 GDP that came in at 0.5%, in line with the consensus forecast and above previous quarter reading of 0.4%. The report also showed that the services sector continues to lead the economic advance, whilst manufacturing remained flat, still a drag. From a technical perspective, the pair is looking painfully bullish, as intraday rallies continue to attract selling interest. Nevertheless, higher highs are seen whilst a daily ascendant trend line coming from 1.0478 contains the downside. Short term, the 1 hour chart shows that the technical indicators have lost upward strength, now flat near overbought levels, while the price is above a bullish 20 SMA. In the 4 hours chart, the technical indicators have turned lower from overbought levels, but the price remains above a bullish 20 SMA. Renewed buying interest beyond 1.4400, should see the rally extending, particularly if oil continues recovering ground.
Support levels: 1.4360 1.4310 1.4270
Resistance levels: 1.4280 1.4315 1.4360
USD/JPY
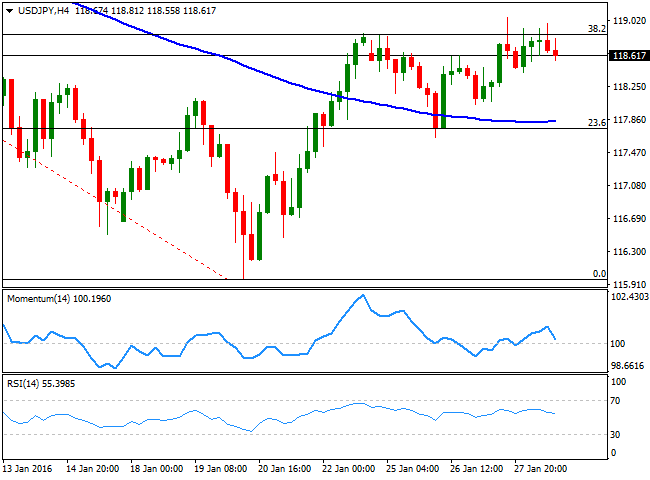
The USD/JPY pair traded around the 118.90 Fibonacci level for most of the day, with attempts to advance beyond it resulting in limited retraces. Even the release of disappointing US data was not enough to boost the yen, as investors are waiting for the BOJ's economic policy decision during the upcoming session, before establishing positions. Japan will also release its Tokyo and National CPI figures ahead of the meeting, generally expected to remain subdued. Short term, the 1 hour chart shows that the price has been confined to a tight intraday range above its 100 SMA, the immediate support now around 1118.50. In the same chart, the technical indicators have turned south around their midlines, lacking directional strength at the time being. In the 4 hours chart, the pair is halfway between its moving averages, while the technical indicators have turned south, but remain above their midlines. The JPY may likely appreciate if the BOJ remains on hold, with a break below 118.10 opening doors for a steady decline on Friday.
Support levels: 118.50 118.10 117.70
Resistance levels: 118.90 119.35 119.70
GOLD
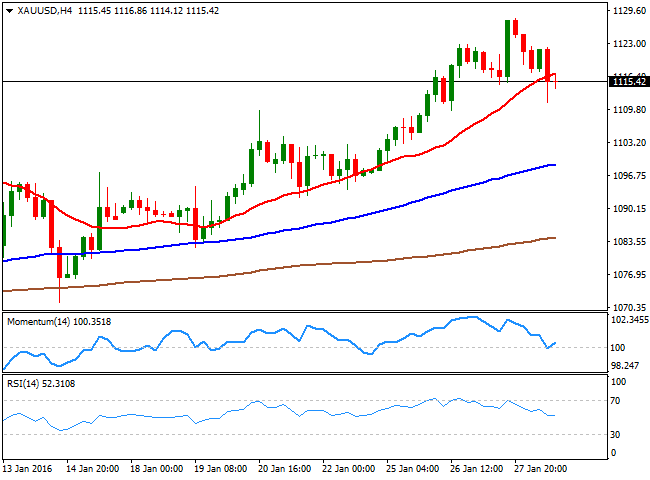
Gold prices slipped from multiweek highs, with spot down to $1,115.50 a troy ounce by the end of the American session. The recovery in oil prices spurred some risk appetite this Thursday, sending investors away from the bright metal. Also, uncertainty over what's next from the FED, after sending mixed signals last Wednesday, forced some profit taking in the metal. The upward potential has lost steam, as in the daily chart, the commodity is back below its 200 DMA, but remains far above the 20 and 100 DMAs, whilst the technical indicators have turned slightly lower, but remain well above their moving averages. Shorter term, the price is currently below its 20 SMA, which offers an immediate short term resistance at 1,116.90, while the Momentum indicator is attempting to bounce from its midline, and the RSI indicator heads lower around 51, not yet suggesting further declines. The key support stands at 1,109.60 a major static level, and if it's broken, the commodity may well accelerate its decline ahead of the weekend.
Support levels: 1,109.60 1,100.20 1.093.50
Resistance levels: 1,116.90 1,123.10 1,128.00
WTI CRUDE
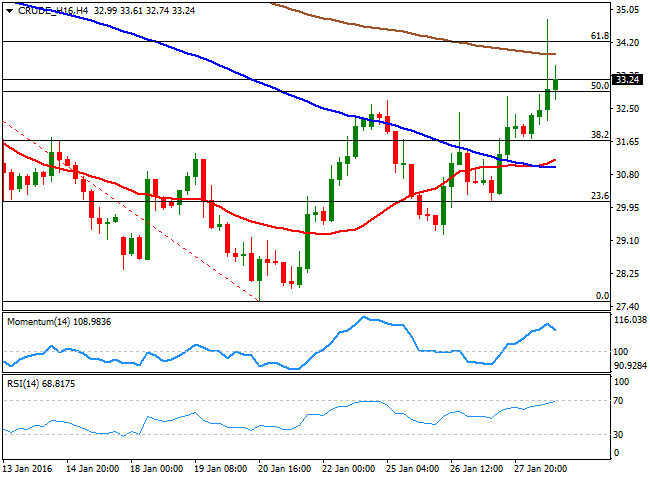
Crude oil prices soared temporarily during London trading hours, finding support in some talks of a deal to cut output. Russian Energy Minister, Alexander Novak, revealed the proposed reductions in output, which would amount to about 500,000 barrels a day of cuts by Russia, one of the largest producers outside OPEC. But the news was denied by an OPEC delegate that said that Saudi Arabia had made no such proposal. Brent rose to $35.82 a barrel, and WTI reached $34.80, but both retreated afterwards, ending however, the day with gains. As for WTI futures, the daily chart shows that the price has advanced further above a still bearish 20 SMA, and currently hovers around the 50% retracement of its latest decline, while the technical indicators head strongly higher well above their midlines, supporting some additional gains for this Friday. Shorter term and according to the 4 hours chart, the upside is also favored, as the 20 SMA is crossing above the 100 SMA well below the current level, while the technical indicators are losing upward strength near overbought territory, but remain far from suggesting a bearish movement ahead.
Support levels: 32.40 31.70 31.20
Resistance levels: 33.90 33.80 34.50
DAX
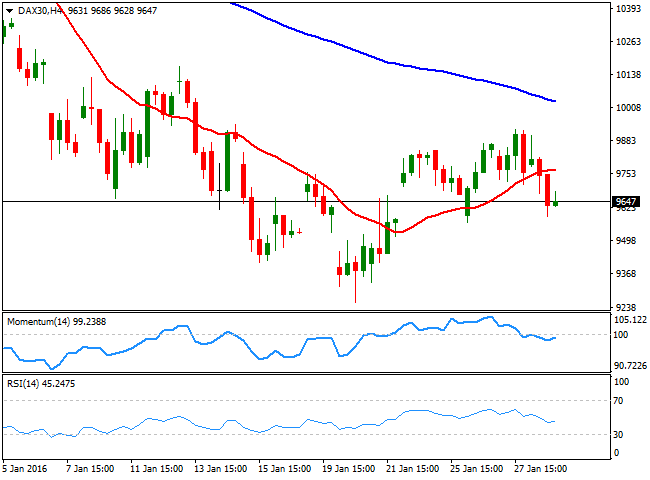
The German DAX plummeted 2.44% or 235 points, closing the day at 9,639.59 amid poor EU data and a stronger EUR. The decline was led by Deutsche Bank, down by 5.44% after the bank reported its first fiscalyear loss since the global financial crisis. Also under pressure were automakers, with Volkswagen, Daimler and BMW all down around 2.0%. The daily chart shows that the index met selling interest once again around a sharply bearish 20 SMA, while the Momentum indicator has turned flat below its 100 level and the RSI turned south, now around 41, increasing the risk of further declines. In the 4 hours chart, the index is below its 20 SMA, while the technical indicators have crossed their midlines towards the downside, but lack bearish strength, giving little clues on what's next for the index.
Support levels: 9,588 9,510 9,435
Resistance levels: 9,712 9,782 9,870
DOW JONES
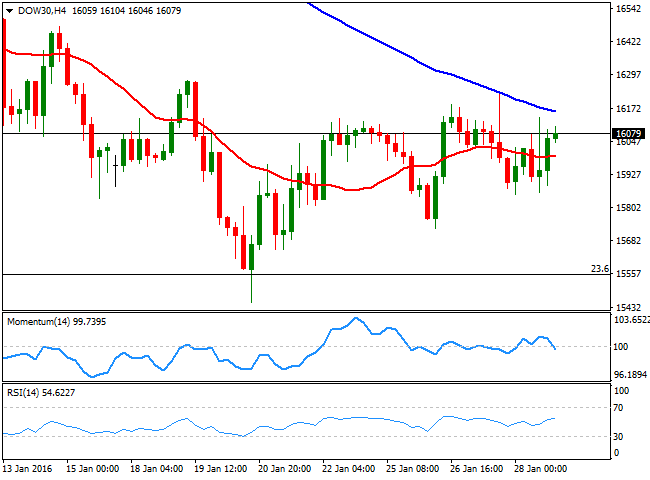
US stocks struggled for direction, as the US FED offered a mixed statement during the previous session, leaving investors with no clear clues. Oil prices rose sharply, but retreated before the closing bell assuring a volatile ride, amid reports, later denied, that Saudi Arabia proposed a 5% output cut. The three US indexes closed in the green, with the DJIA up 124 points, to end at 16,069.44, the Nasdaq up 0.86% to 4,506.68 and the SandP 10 points up at 1,893.36. The technical picture for the DJIA presents a mild positive tone, as in the daily chart, the index advanced again towards its 20 SMA, still capping advances and now around 16,163 while the RSI indicator continued recovering from oversold territory and the Momentum indicator turned back north, but remains below its midline. In the 4 hours chart, however, the index has no clear directional strength, as it has been trading back and forth around a flat 20 SMA, while the technical indicators hover around neutral territory, giving no clear signs of upcoming direction. The weekly high of 16,235 seems to be the key, as some additional gains beyond it should put the index in the bullish track during the upcoming sessions.
Support levels: 16,024 15,952 15,873
Resistance levels: 16,107 16,180 16,230
FTSE 100
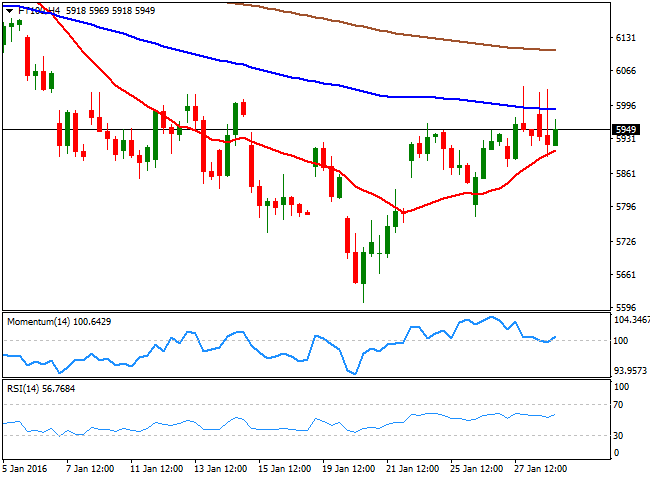
The FTSE 100 closed the day at 5,931.78, down by 0.98%, following the decline in European share markets, although the energy related sector hold in positive territory by the close, amid crude's recovery. Among the winners were Royal Dutch Shell up by 2.33% and BP which added 1.53%. Anglo American was the best performer, surging 8.73% after posting its fourthquarter output report, showing that iron ore production was up 8.4%, but diamond production declined. The index, however, managed to recover above its 20 SMA in the daily chart, where the technical indicators have turned flat around their midlines. In the 4 hours chart, the technical picture is bullish, as the index continues developing above a bullish 20 SMA, whilst the technical indicators head higher after bouncing from their midlines. The weekly high stands at 6,034, and it will take an upward acceleration beyond it, to confirm further gains for the upcoming sessions.
Support levels: 5,942 5,880 5,830
Resistance levels: 5,968 6,034 6,090
The information set forth herein was obtained from sources which we believe to be reliable, but its accuracy cannot be guaranteed. It is not intended to be an offer, or the solicitation of any offer, to buy or sell the products or instruments referred herein. Any person placing reliance on this commentary to undertake trading does so entirely at their own risk.
Recommended Content
Editors’ Picks
EUR/USD climbs to 10-day highs above 1.0700

EUR/USD gained traction and rose to its highest level in over a week above 1.0700 in the American session on Tuesday. The renewed US Dollar weakness following the disappointing PMI data helps the pair stretch higher.
GBP/USD extends recovery beyond 1.2400 on broad USD weakness

GBP/USD gathered bullish momentum and extended its daily rebound toward 1.2450 in the second half of the day. The US Dollar came under heavy selling pressure after weaker-than-forecast PMI data and fueled the pair's rally.
Gold rebounds to $2,320 as US yields turn south

Gold reversed its direction and rose to the $2,320 area, erasing a large portion of its daily losses in the process. The benchmark 10-year US Treasury bond yield stays in the red below 4.6% following the weak US PMI data and supports XAU/USD.
Here’s why Ondo price hit new ATH amid bearish market outlook Premium

Ondo price shows no signs of slowing down after setting up an all-time high (ATH) at $1.05 on March 31. This development is likely to be followed by a correction and ATH but not necessarily in that order.
Germany’s economic come back

Germany is the sick man of Europe no more. Thanks to its service sector, it now appears that it will exit recession, and the economic future could be bright. The PMI data for April surprised on the upside for Germany, led by the service sector.
