![]() TradingDaze
TradingDaze
Aisys Technologies Inc.
A general note. I'm expecting volatility and possibly a big move in the markets in the April to mid-June timeframe. There are also some violent aspects which could be pointing to war-like activity or terrorist event. These are mainly mid-month as are geophysical events and potential violent weather.
SP500
For the SP500, cycle-wise Feb 11 was the Primary cycle trough. 1 that started on Aug 24th. Feb 11th was a slightly lower low than Jan 20th low. Jan 20th was the low for a number of other indices. Feb 11th starts a new nominal 18 week cycle in the SP500 and we are entering the 9th week. We most often see a nominal 6 week cycle to start a new nominal 18 week cycle and this time was no exception. The crest is MT and the trough is MB on the following daily chart. The nominal 6 week cycles has a range of 5 to 7.
Normally we would expect the SP500 to continue up in the 2nd nominal 6 week cycle in the primary cycle. In the current case we have a number of difficult transits and Astrological events that may directly effect the markets or a world event that indirectly effects the market. One that stands out is the Jupiter/Uranus parallel which is in aspect most of the month of April. On the surface this would be interpreted as being very positive and potentially very sudden good fortune. Jupiter however is in Virgo which is Jupiter's detriment. The sign it works with the least power. A parallel is an aspect of declination. We may have seen the crest for this nominal 18 week cycle and the end would be approx. mid-June 2016. That's a long time to be going down and I expect volatility. This coming week is the start of the 1st QTR earnings season and it is not expected to be good. We may see a rise in the indices during this week, or the early part of the week, before a more major move down.
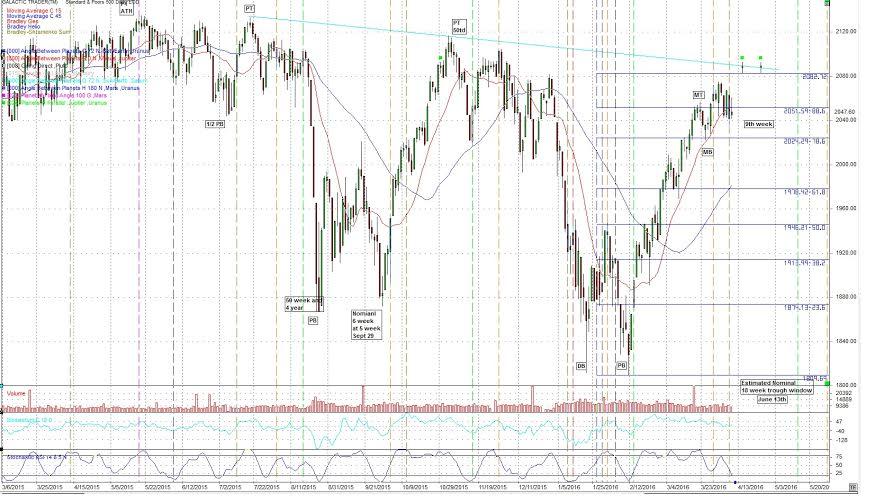
Price just broken through the 15 day sma (red moving average). The 15 day sma is above the 45 day. This looks like a setup for a move down.
My outlook is bearish going into the Spring due to the Astrological aspects being formed, namely the Saturn/Neptune square and the Jupiter/Saturn square. There are others. These 3 planets will be forming a powerful T-Square in mutable signs.
I mentioned an unusual/possibly explosive environment in April and the dates and potential events will be included in the April monthly subscribers report. For purposes here watch out early in the month and near the 3rd week of April.
The Uranus/Pluto square is still in orb but will soon be fading. March through June of 2016 looks troublesome and very volatile. I'm looking for two and possibly 3 lows from now into June with one of the lows coinciding with the current nominal 18 week cycle. The new nominal 18 week cycle which started on Feb 11 is therefore forecast to end as a trough approx. 18 weeks hence. That puts us in the week of June 13 with a range from May 30 to July 4th.
Feb 11 was an important low. Subscribers look at your list of forecast dates and you will find Feb 10th. This is from the 6 month forecast dates originally forecast in November 2015.
The week of June 13th, just discussed is the week for the next Saturn/Neptune waning square with Neptune going retrograde earlier in the week. This is a potential time for a more significant low. It could also be a time that epidemics break out or lingering disease. This could also involve water.
Two weeks ago we had the Jupiter square to Saturn on March 23 which is 2 days before Saturn turns retrograde and we got the turn down in many markets we were expecting.
There was also a Saturn parallel Pluto aspect on Feb 9, 2 days away from the important Feb 11 date. Watch the days around April 28 for a possible low or start of a move down when Saturn is parallel Pluto once again.
Mars leaves Scorpio, where it has given Gold a huge thrust up and entered Sagittarius on March 5. This results in both Mars and Saturn in Sagittarius , a signature for a religious conflict or the amplification of one.
I'll be watching the U.S.A financial system / currency in follow up to the video from the February 29 post. This should be a long process. Note in the video the last similar occurrence took almost one year to see an effect.
With the longer term market cycles we use the Astrological aspects and Astrological events to determine a more exact time. Note: I have taken off the brief description of the Uranus/Pluto waning square. Longer term geocentric Astrological cycles that are coming up include:
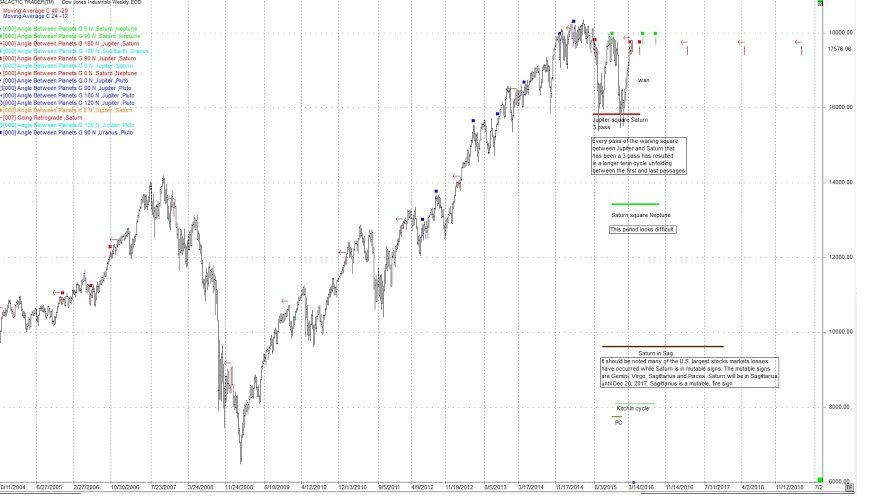
Jupiter waning square Saturn
- in the middle of a 3 pass, 2 exact hits to come this year
"The business cycle and direct effect on European history. Major changes will be occurring in Europe as result of the refuge migration. There is a major sign change coming up when Jupiter and Saturn are conjunct in 2020. More on this 240 year conjunction in a future post."
Saturn square Neptune
- in the middle of a 3 pass, 2 exact hits to come this year
Saturn is about social order, structure and regulations. Neptune can be politically unrealistic and a desire to avoid confrontation. It can be devious, underhanded and use subversive tactics.
"This aspect is often present near times when there is a change in trend for interest rates or inflation. It can also be a period of epidemics, pandemics suffering, depression and money valuation problems. This could be a change in the world's reserve currency or issues around it. A large increase in precious metals is also possible as it is a money valuation issue. This 36 year aspect has been associated with political changes, reforms and development of socialism. One wonders in regards to epidemics and sickness, would this be natural illnesses or man-made." If you feel depressed or not at ease this aspect may be the cause. One of these planets may be hitting a planet in your horoscope.
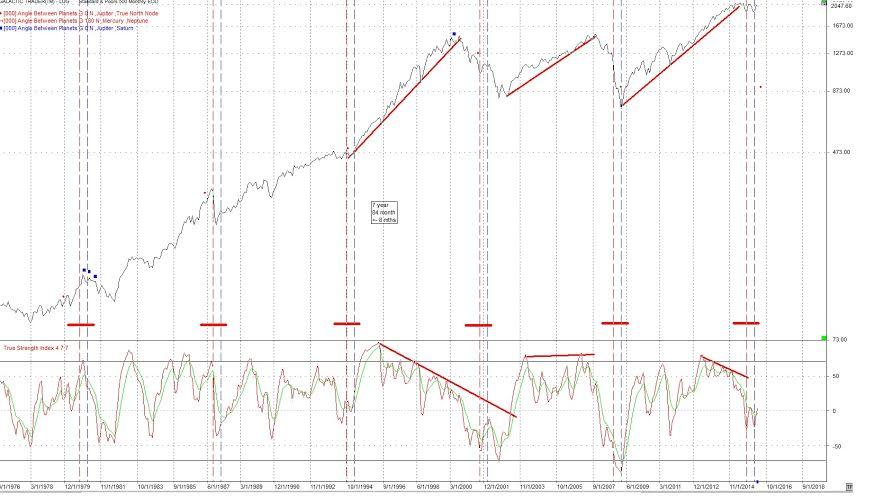
On the following weekly chart of the DJIA, the red squares are Jupiter square Saturn and the green squares are Saturn square Neptune.
For 2016 we have Jupiter, Saturn, Neptune and the North Node in mutable signs. In addition both eclipses are in mutable signs. Mutable signs are about flexibility and the ability or need to change. They are also about things that are not in control and extremes. We are in for a wild ride for the next couple of months in the markets and other areas of life.
With all these planets in mutable signs one might expect a fast changing, exciting, fun environment. Let's not forget that Saturn is the focal point of a T-Square, with a square to Neptune. Amongst other things Saturn is fear. This could be pointing to life threatening epidemics and with Neptune this could mean water borne diseases. Natural or man-made?
For April, Mars and Pluto will be turning retrograde within a day of each other. This will probably be the most important Astrological event for the month. This time frame is also tied to the Jan 11, 2011 Solar Eclipse. That's right 2011. In my opinion this eclipse kicked off the "Arab Spring". From that eclipse date Uranus has moved to now square Mars position in the Jan 11, 2011 eclipse.
Following is a link to a post and picture of that eclipse. If there is going to be a major world event in the mid-April time frame (April 15-20) it will probably be within the area covered by this eclipse. Note it's coverage, the Mid East and Europe.
http://trading-daze.blogspot.ca/2011/02/jan-4-2011-partual-solar-eclipse.html
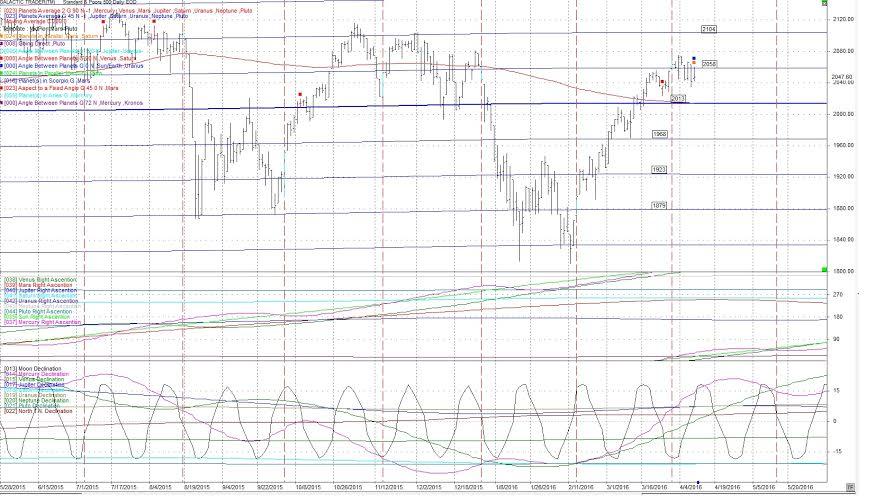
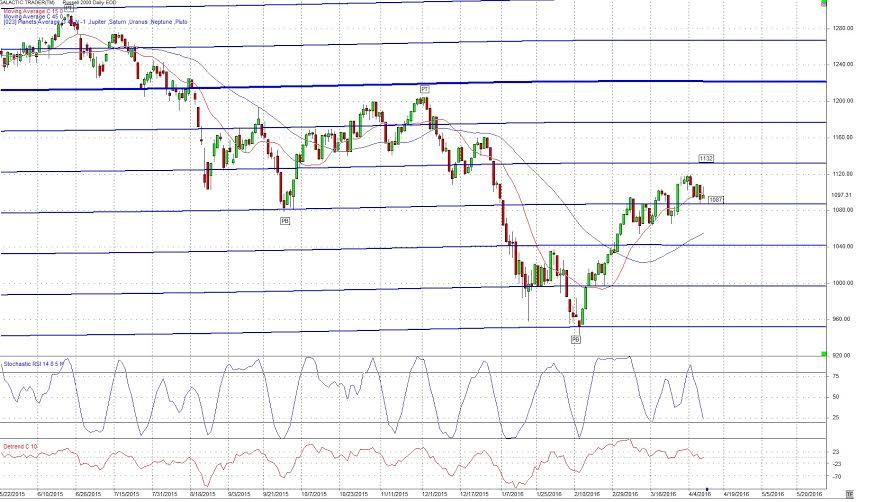
The next 2 charts are daily charts of the SP500, and the Russell 2000. The horizontal blue lines are the average longitude of the planets Jupiter, Saturn, Uranus, Neptune and Pluto on all 3 charts This average is converted to price and displayed on the charts. Notice how well they have acted as support and resistance. The SP500 is sitting on one of the averages (2058) which is based on planetary longitude. We'll see over the next couple of days whether this is support or resistance. I'm still thinking resistance.
The red vertical lines on the chart are the 45 cd cycle. This cycle has been accurate since May 20, 2015, the all time high. It appears to have run it's course as there was little movement around the date of the 45 cd.
The second chart is the Russell 2000. This index is subject to far less manipulation than the SP500. Notice how well it respects the Astrological average price lines. It's too bad we have to bring up manipulation but the reality is, it happens.
Other longer term cycles that may be close to seeing their lows in the next couple of months are the 6.5 - 7 year cycle. I'm looking at the period from now through the spring of 2016 as a potential time period for these cycles. They are long term cycles and need a broad orb. Assuming the 2009 low was an 18 year cycle low, we may be looking at a 9 year cycle low late 2017 - 2018.
I was asked for my long term view and here it is. I'm looking for the world wide economy to be basically down until 2020. This coincides with a long term Astrological phenomenon known as Tigonalis which involves the Jupiter/Saturn conjunctions. Every 240 years the conjunction of these planets changes elements. In 2020 the Jupiter/Saturn conjunction will occur in Aquarius, a fixed, air sign. I expect dramatic technological developments leading into this time which should be, like the internet, life-changing developments.
"Every movementin the market is the result of a natural law and of a Cause which exists longbefore the Effect takes place and can be determined years in advance. Thefuture is but a repetition of the past, as the Bible plainly states…"
-- W D Gann
This blog will cover the stock market from a timing perspective. As such there will be no coverage of fundamental analysis. The approach will be to look for market cycles which are timed with Astrological cycles. When found technical analysis will be used to fine tune entries and exits. Most articles will include examples. For those who are dubious because it "just should not work", read a few posts. You may be very surprised. I am a certified accountant, computer programmer and astrologer. NORMAL STUFF The projections and information provided does not constitute trading advice, nor an invitation to buy or sell securities. The material represents the personal views of the author. Anyone reading this blog should understand and accept they are acting at their own risk. Each person should seek professional advice in view of their own personal finances.
Recommended Content
Editors’ Picks
EUR/USD clings to daily gains above 1.0650

EUR/USD gained traction and turned positive on the day above 1.0650. The improvement seen in risk mood following the earlier flight to safety weighs on the US Dollar ahead of the weekend and helps the pair push higher.
GBP/USD recovers toward 1.2450 after UK Retail Sales data

GBP/USD reversed its direction and advanced to the 1.2450 area after touching a fresh multi-month low below 1.2400 in the Asian session. The positive shift seen in risk mood on easing fears over a deepening Iran-Israel conflict supports the pair.
Gold holds steady at around $2,380 following earlier spike

Gold stabilized near $2,380 after spiking above $2,400 with the immediate reaction to reports of Israel striking Iran. Meanwhile, the pullback seen in the US Treasury bond yields helps XAU/USD hold its ground.
Bitcoin Weekly Forecast: BTC post-halving rally could be partially priced in Premium

Bitcoin price shows no signs of directional bias while it holds above $60,000. The fourth BTC halving is partially priced in, according to Deutsche Bank’s research.
Week ahead – US GDP and BoJ decision on top of next week’s agenda

US GDP, core PCE and PMIs the next tests for the Dollar. Investors await BoJ for guidance about next rate hike. EU and UK PMIs, as well as Australian CPIs also on tap.