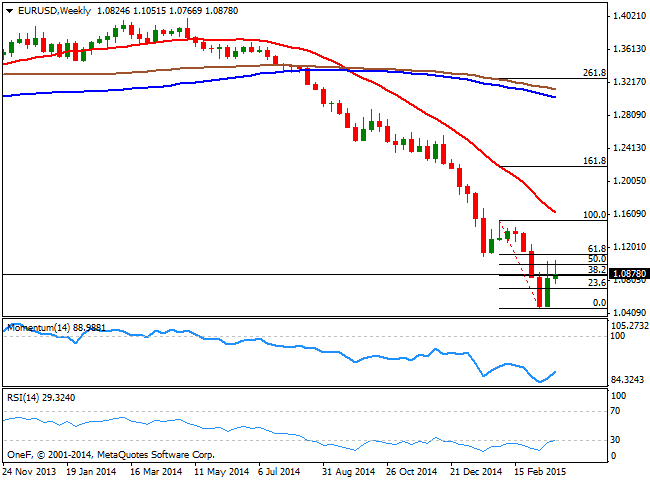
The pair seems to have lost part of its upward strength this past week, ending it barely 50 pips above the opening. The strong rejections on spikes above 1.1000 suggest that selling interest is just waiting for a better entry, rather than capitulate. Besides, the weekly chart shows long upper wicks in the last two candles, reinforcing the idea. Technically and in the same chart, the RSI has turned flat in oversold territory, still below 30, whilst the Momentum indicator managed to stage a tepid recovery from oversold territory, but remains well into the red. The 20 SMA maintains a strong bearish slope, but too far away to be relevant at this point.
In the daily chart, the price holds above a bearish 20 SMA, currently around 1.0760, whilst the Momentum indicator heads strongly higher in positive territory, but the RSI indicator already capitulated and turned lower at 48. Considering the day will likely end into the red, the Momentum indicator will likely turn lower before next candle opening. Anyway, the immediate resistance stands around the 1.0950 level, where the pair stalled several times intraday these last weeks, with a break above it favoring a continuation up to the mentioned highs around 1.1050, in route to the critical 1.1120 level. It would take a weekly close above it to confirm EUR bulls are here to stay.
To the downside, the mentioned 1.0760 is the first level to watch, with additional declines below it exposing the 1.0600 area for next week, whist if this last level gives up, the dollar will be positioned to retest its year high around 1.0460.
View Live Chart for EUR/USD

Recommended Content
Editors’ Picks
AUD/USD remained bid above 0.6500

AUD/USD extended further its bullish performance, advancing for the fourth session in a row on Thursday, although a sustainable breakout of the key 200-day SMA at 0.6526 still remain elusive.
EUR/USD faces a minor resistance near at 1.0750

EUR/USD quickly left behind Wednesday’s small downtick and resumed its uptrend north of 1.0700 the figure, always on the back of the persistent sell-off in the US Dollar ahead of key PCE data on Friday.
Gold holds around $2,330 after dismal US data

Gold fell below $2,320 in the early American session as US yields shot higher after the data showed a significant increase in the US GDP price deflator in Q1. With safe-haven flows dominating the markets, however, XAU/USD reversed its direction and rose above $2,340.
Bitcoin price continues to get rejected from $65K resistance as SEC delays decision on spot BTC ETF options

Bitcoin (BTC) price has markets in disarray, provoking a broader market crash as it slumped to the $62,000 range on Thursday. Meanwhile, reverberations from spot BTC exchange-traded funds (ETFs) continue to influence the market.
US economy: slower growth with stronger inflation

The dollar strengthened, and stocks fell after statistical data from the US. The focus was on the preliminary estimate of GDP for the first quarter. Annualised quarterly growth came in at just 1.6%, down from the 2.5% and 3.4% previously forecast.