This week the pound unfolded towards the upside reaching both targets and after reaching the specified targets, the pound continued moving towards the upside exceeding the main count`s upper invalidation point.
The structure of the latest move alongside the bullish indications -which we will discuss shortly- suggest that the pound is preparing to make new highs for the year.
We are modifying the main count according to the latest price action and as well presenting an alternate count which expects the pound to continue moving towards the downside.
It should be noted that MACD readings on the 6-hours chart does not provide enough data to confirm or refute the main count`s view unlike the hourly MACD readings which provide us with indications of the direction of Cable`s next move.
As always we will let price action decide for us which count is the highly probable count by waiting for either count`s confirmation point to be reached.
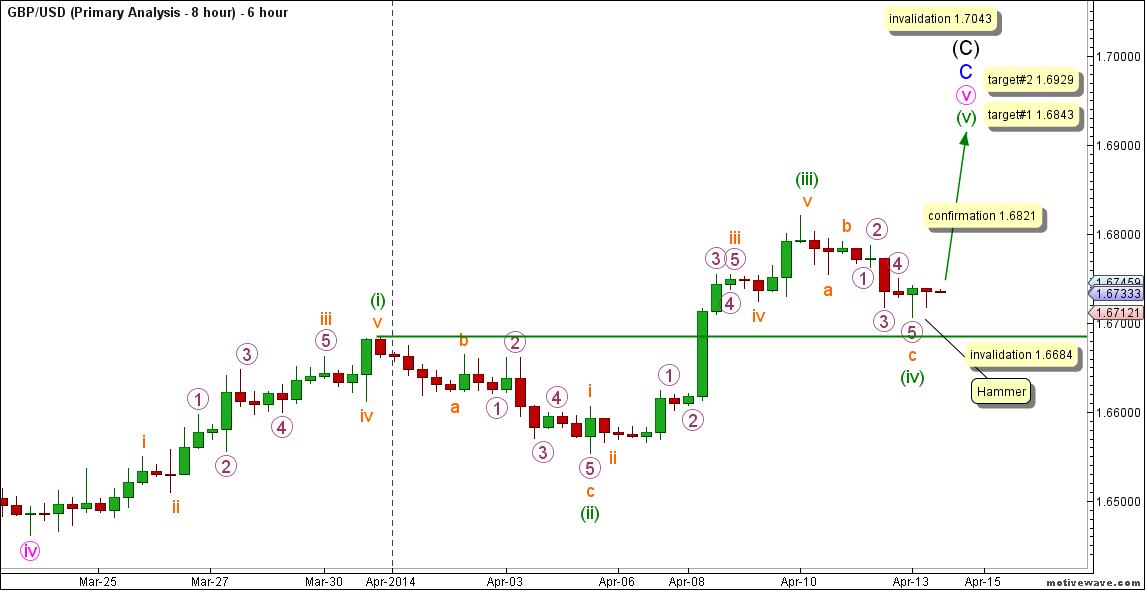
6-Hours Main Count
- Invalidation Point: 1.6684 -- 1.7043
- Confirmation Point: 1.6821
- Upwards Targets: 1.6843 -- 1.6929
- Wave number: (v) green
- Wave structure: Motive
- Wave pattern: Impulse/Ending diagonal
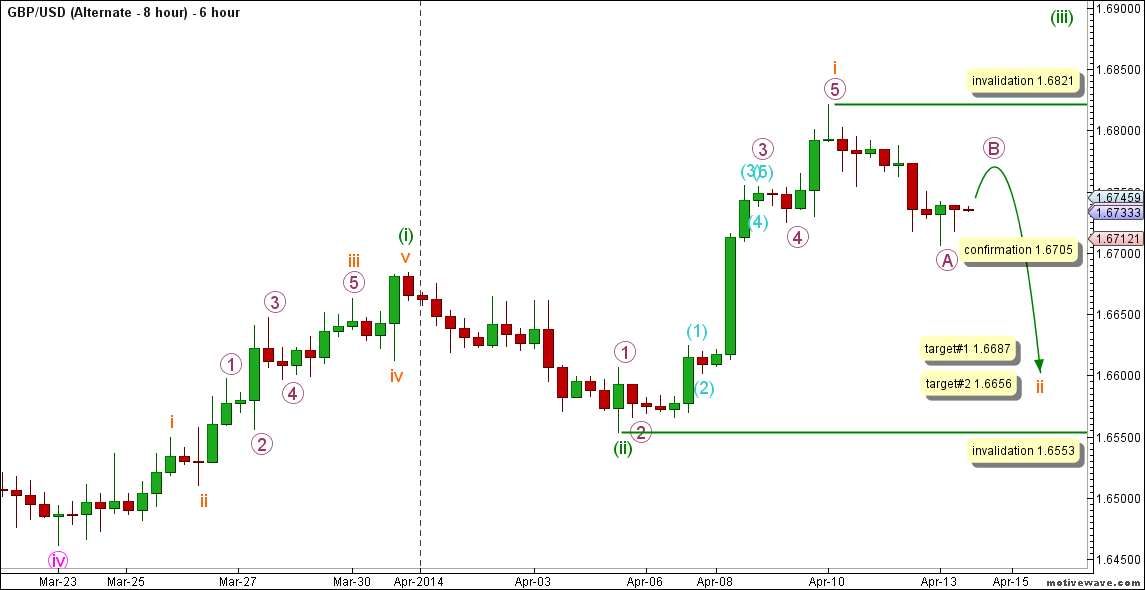
6-Hours Alternate Count
- Invalidation Point: 1.6553 -- 1.6821
- Confirmation Point: 1.6705
- Downwards Targets: 1.6687 -- 1.6656
- Wave number: ii orange
- Wave structure: Corrective
- Wave pattern: Double Zigzag
Main Wave Count
This count expects that wave B maroon is unfolding as a triangle labeled waves (A) through (E) black with waves (A) and (B) black complete and wave (C) black is unfolding towards the upside.
Within wave (C) black waves A and B blue are complete and wave C blue is unfolding towards the upside.
Wave C blue is unfolding as an impulse labeled waves i through v pink with waves i through iv pink complete and wave v pink is unfolding towards the upside.
Wave iv pink unfolded as a double zigzag labeled waves (w), (x) and (y) green and this count expects that wave v pink is unfolding towards the upside.
Within wave v pink waves (i) through (iv) green are expected complete and wave (v) green is unfolding towards the upside.
Wave (iii) green unfolded as an impulse labeled waves i through v orange with wave iii orange extending into waves 1 through 5 purple.
Wave (iv) green unfolded as a zigzag labeled waves a, b and c orange with wave c orange unfolding as an impulse labeled waves 1 through 5 purple and this count expects that wave (v) green is unfolding towards the upside.
As far as Japanese candlesticks study goes, presence of a "Hammer" pattern on the 6 hours chart supports the main count`s view.
As far as MACD study goes, the lack of a MACD divergence on the 6 hours chart does not confirm or refute the main count`s view.
This count would be confirmed by movement above 1.6821.
At 1.6843 wave (v) green within wave v pink will reach 0.618 the length of wave (i) green and at 1.6929 wave (v) green will reach equality with wave (i) green.
This count would be invalidated by movement above 1.7043 as wave (C) black may not exceed the end of wave (E) black within a contracting triangle, as well this count would be invalidated by movement below 1.6684 as wave (iv) green may not enter the price territory of wave (i) green and it should be noted that the invalidation point will be moved to the end of wave (iv) green once we have confirmation on the hourly chart that wave (v) green is underway.
Alternate Wave Count
This count expects that wave (iii) green is extending towards the upside with wave i orange complete and wave ii orange is underway.
Wave i orange unfolded as an impulse labeled waves 1 through 5 purple with wave 3 purple extending into waves (1) through (5) aqua.
Within wave ii orange wave A purple is expected complete and wave B purple is underway.
This count would be confirmed by movement below 1.6705.
At 1.6687 wave ii orange would reach 0.5 the length of wave i orange and at 1.6656 wave ii orange would reach 0.618 the length of wave i orange.
This count would be invalidated by movement above 1.6821 as wave B purple may not retrace more than 100 % the length of wave A purple, as well this count would be invalidated by movement below 1.6553 as wave ii orange may not retrace more than 100 % the length of wave i orange.
Note: All information on this page is subject to change. The use of this website constitutes acceptance of our user agreement. Please read our privacy policy and legal disclaimer. Opinions expressed at FXstreet.com are those of the individual authors and do not necessarily represent the opinion of FXstreet.com or its management. Risk Disclosure: Trading foreign exchange on margin carries a high level of risk, and may not be suitable for all investors. The high degree of leverage can work against you as well as for you. Before deciding to invest in foreign exchange you should carefully consider your investment objectives, level of experience, and risk appetite. The possibility exists that you could sustain a loss of some or all of your initial investment and therefore you should not invest money that you cannot afford to lose. You should be aware of all the risks associated with foreign exchange trading, and seek advice from an independent financial advisor if you have any doubts.
Recommended Content
Editors’ Picks
AUD/USD failed just ahead of the 200-day SMA

Finally, AUD/USD managed to break above the 0.6500 barrier on Wednesday, extending the weekly recovery, although its advance faltered just ahead of the 0.6530 region, where the key 200-day SMA sits.
EUR/USD met some decent resistance above 1.0700

EUR/USD remained unable to gather extra upside traction and surpass the 1.0700 hurdle in a convincing fashion on Wednesday, instead giving away part of the weekly gains against the backdrop of a decent bounce in the Dollar.
Gold stays firm amid higher US yields as traders await US GDP data

Gold recovers from recent losses, buoyed by market interest despite a stronger US Dollar and higher US Treasury yields. De-escalation of Middle East tensions contributed to increased market stability, denting the appetite for Gold buying.
Ethereum suffers slight pullback, Hong Kong spot ETH ETFs to begin trading on April 30

Ethereum suffered a brief decline on Wednesday afternoon despite increased accumulation from whales. This follows Ethereum restaking protocol Renzo restaked ETH crashing from its 1:1 peg with ETH and increased activities surrounding spot Ethereum ETFs.
Dow Jones Industrial Average hesitates on Wednesday as markets wait for key US data

The DJIA stumbled on Wednesday, falling from recent highs near 38,550.00 as investors ease off of Tuesday’s risk appetite. The index recovered as US data continues to vex financial markets that remain overwhelmingly focused on rate cuts from the US Fed.

