Pick up any book or head over to one of the hundreds of trading education websites out there and you’ll be sure to see plenty of thoughts and instruction with how to deal with market trends. The vast majority of opinions out there will no doubt quote the same famous message: ”The trend is your friend.” I thought it would be interesting this week to offer my own perspective on this topic and give you a good idea of how we regard the concept of trend within the educational environment of Online Trading Academy and how it features within our simple rules based patented core strategy.
Firstly, let’s face facts. The concept of following the trend is a simple one and makes a great deal of sense on paper. I guess you could compare it to swimming against the current. Do this and firstly, you are unlikely to travel very far and secondly you’ll more than likely exhaust yourself in the process. When we look at trend within the confines of currency trading we can apply the very same logic. A trend is nothing more than a sentiment gauge, or another way of looking at it would be to regard it as the thought process of the masses that are trading that particular currency pair of financial instrument. The trend is the dominant direction that the marketplace is trading and is the result of a bias to either buying or selling taking place.
When we think about it like this, it makes little sense to fight a trend and every sense to go with it. Trends can often last a very long time, especially in Forex trading. I would say this is one of the many reasons why people find this particular market so attractive. However, as any of the readers who’ve been active in the markets for quite some time now will know, trends aren’t always our friends and knowing when to join one or avoid one is one of the more challenging aspects of trading. I have met many students of mine who’ve actually found trends to be a rather frustrating component of their trading. Often the case is the same, with those students being able to recognise a trend but then not really knowing what to do with it. Sometimes they go to join it, only to have it change direction on them, or they attempt to join it, get stopped out and then watch it go without them. The main priority always tends to be the same: attempt to go with the trend and don’t try to catch a falling knife or stand in front of a freight train. As we all know however the idea is simple but not often easy. So let us shed a little bit more light on the situation.
A trend may last a very long time. Sometimes being up to months or even years the one thing we must recognize is that no matter how long a trend runs for overall, it won’t go in that dominant direction forever. It has to make pullbacks and corrections to give other institutions and traders a chance to join it. The key is knowing when to join it safely and when to anticipate a low risk, high reward opportunity to go against it. I often say to my students and colleagues alike, that I love nothing more than being part of a trend and I always do my best to be a part of that trend from its very start. If I can’t be in it from the start, I must objectively ask myself if it’s worth joining that trend, as is it something that already happened and may not have much room to go. The real lack of understanding trend in my humble opinion, is knowing when you’re leaning against the big enough brick wall to cause a reversal in a trend and then knowing when that ride is over and it’s time to get back on board the big move. Let’s take a look at the recent example of an XLT session I taught, with some analysis on the EURUSD currency pair.
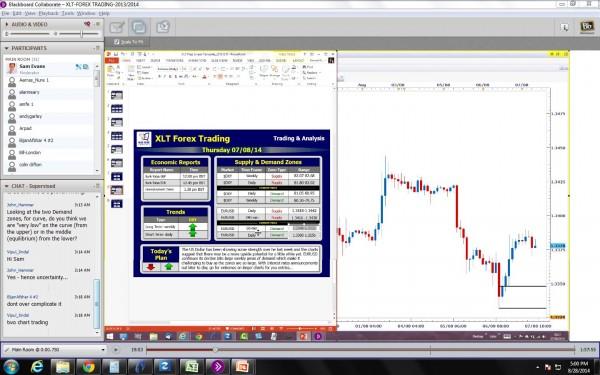
The above screenshot is taken from a live trading and analysis session during the London open. On the left hand side you will see our preparation screen, with short-term income trades and longer-term wealth trades marked out accordingly. The price chart on the right is a short-term opportunity based off of a one hour chart and was suggesting to me a short term buying opportunity in the EURUSD. During the XLT sessions the instructors like myself, place the specific entries and exits on the preparation screen, so that the students can draw the lines themselves and then watch the instructor do the same thing in real time. In this example we had an opportunity to buy at a demand zone between 1.3348 and 1.3332, as marked on the preparation screen to the left. After noting a strong imbalance between the willing buyers and the willing sellers at the demand zone, we drew in our lines for our entry, stop loss and target and then simply waited for price to come to us. An important note about this trade though, is that we were not looking for a huge move to the upside. Rather, the market was offering us a short-term buying opportunity while we waited for the much longer term shorting opportunity. Let us take a look at how the trade worked out:
From the graphic above, you’ll see that the trade did trigger a few hours later and gave us a decent risk to reward ratio. Yet an even more important aspect of this trade was making sure that we took a profit, due to the fact that the market was in a much longer term downward trend and we wanted to take an opportunity to join that too. Below is a screenshot of the long-term Wealth setup:
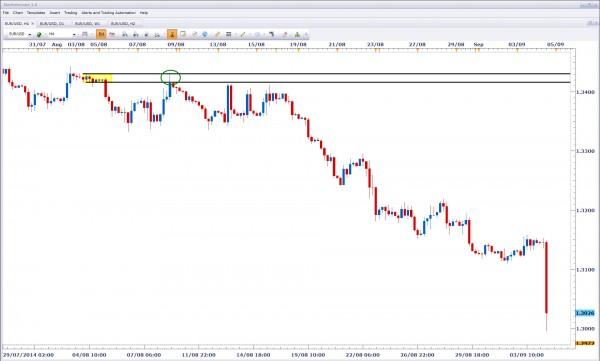
For this trade, we had a supply zone marked off between 1.3416 and 1.3430. Much more patience was required to wait for this setup as it was based off of the larger timeframes and had a much bigger risk to reward ratio. The reason we took the original long trade was because we were expecting a correction in the marketplace but the real trade we were looking for the big move, was the short at a higher price. As I said earlier in this article, we need to be aware that trends can continue but they need corrections to be able to continue. After the long trade triggered and hit the target, the supply zone entry was then triggered and worked out like this:
An important note to take when looking at the result of this trade, is that it required time and patience to wait for an entry and also to allow the trade to work out. A professional trader with a solid plan knows the difference between going with the trend and going against it. They then learn how to time the markets across different timeframes, and recognize different stages of different trends. After a while of getting consistent with your trading, you’ll begin to realize that you can catch a falling knife from time to time but you need to learn how to catch it by the handle. All this means is that we have to be aware of where trend corrections can occur and then also when the best time to join that trend is, if it does have room to continue. This is a skill learned over time and with much practice and is well beyond the scope of an article such as this. However, if anything we should remember that simply believing that the trend will always be our friend, is rather a dangerous assumption to make and will lead to much frustration for someone lacking the ability to truly time the markets.
It is important to remember that if trading was as simple as just following a trend, that is what everybody would do and therefore everybody would make money. In the real world of trading this is not the case and the novice will often find frustration in attempting to join a trend, only to find themselves on the wrong side of the markets against a professional with a stop out on their account and then having to watch the market go without them. My advice is to be aware of the bigger picture and the important part the larger timeframe charts play. You will always see a trend on some timeframes and what looks like a range on another timeframe, only to then see it look like a full-blown trend on a different setting. The key to consistency is to not overcomplicate and stick to a plan. Follow your rules, execute flawlessly, and monitor your results. In two weeks we will continue this discussion further. I hope you found this useful.
This report is prepared solely for information and data purposes. Opinions, estimates and projections contained herein are those of FXTechstrategy.com own as of the date hereof and are subject to change without notice. The information and opinions contained herein have been compiled or arrived at from sources believed to be reliable but no representation or warranty, express or implied, is made as to their accuracy or completeness and neither the information nor the forecast shall be taken as a representation for which FXTechstrategy.com incurs any responsibility. FXTstrategy.com does not accept any liability whatsoever for any loss arising from any use of this report or its contents. This report is not construed as an offer to sell or solicitation of any offer to buy any of the currencies referred to in this report.
Recommended Content
Editors’ Picks
EUR/USD hovers around 1.0700 after German IFO data

EUR/USD stays in a consolidation phase at around 1.0700 in the European session on Wednesday. Upbeat IFO sentiment data from Germany helps the Euro hold its ground as market focus shifts to US Durable Goods Orders data.
USD/JPY refreshes 34-year high, attacks 155.00 as intervention risks loom

USD/JPY is renewing a multi-decade high, closing in on 155.00. Traders turn cautious on heightened risks of Japan's FX intervention. Broad US Dollar rebound aids the upside in the major. US Durable Goods data are next on tap.
Gold price trades with mild negative bias, manages to hold above $2,300 ahead of US data

Gold price (XAU/USD) edges lower during the early European session on Wednesday, albeit manages to hold its neck above the $2,300 mark and over a two-week low touched the previous day.
Worldcoin looks set for comeback despite Nvidia’s 22% crash Premium

Worldcoin price is in a better position than last week's and shows signs of a potential comeback. This development occurs amid the sharp decline in the valuation of the popular GPU manufacturer Nvidia.
Three fundamentals for the week: US GDP, BoJ and the Fed's favorite inflation gauge stand out Premium

While it is hard to predict when geopolitical news erupts, the level of tension is lower – allowing for key data to have its say. This week's US figures are set to shape the Federal Reserve's decision next week – and the Bank of Japan may struggle to halt the Yen's deterioration.


