![]() Richard Perry
Richard Perry
Independent Analyst
Market Overview
A hawkish set of FOMC minutes have reflected the committee’s view that a rate hike in June is a very real possibility which is driving dollar strength. This now means that traders will need to significantly re-assess positioning on the dollar. According to the minutes “most participants judged that if the incoming data was consistent with economic growth picking up in the second quarter, lar markets continue to strengthen and inflation making progress towards the committee’s 2% objective, then it likely would be appropriate for the committee to increase the target range of the federal funds rate in June”. This means that the data will be crucial in the coming weeks. Already the CME Fed Watch indicator has increased it probability of a Fed hike in June from 4% to 33% in two days. The dollar is also drastically strengthening against forex majors, whilst commodities are also lower.
The negative correlation between the dollar and equities also meant that Wall Street was also weaker with the S&P 500 paring gains into the close where it was basically flat on the day. Asian markets have been fairly settled with the Nikkei +0.1%, but European markets have taken account of the weakness into the close on Wall Street, and are trading lower in early moves today. Forex markets are showing mild dollar strength in the Asian session but it will be interesting to see if the Europeans react to buy the dollar today. With the oil price over a percent lower today the commodity currencies are the biggest underperformers, whilst the Aussie is also reacting to the Australian unemployment data. Gold and silver are again weaker as yesterday’s declines seem to be confirming.
Traders will be looking out for UK Retail Sales at 0930BST with an expected slight pick up to 1.9% for the adjusted Year on Year data. US Weekly Jobless Claims are at 1330BST (275,000 exp) whilst the Philly Fed Business Index is at 1330BST and is expected to improve to +3.5 (from -1.6 last month).
Chart of the Day – S&P 500
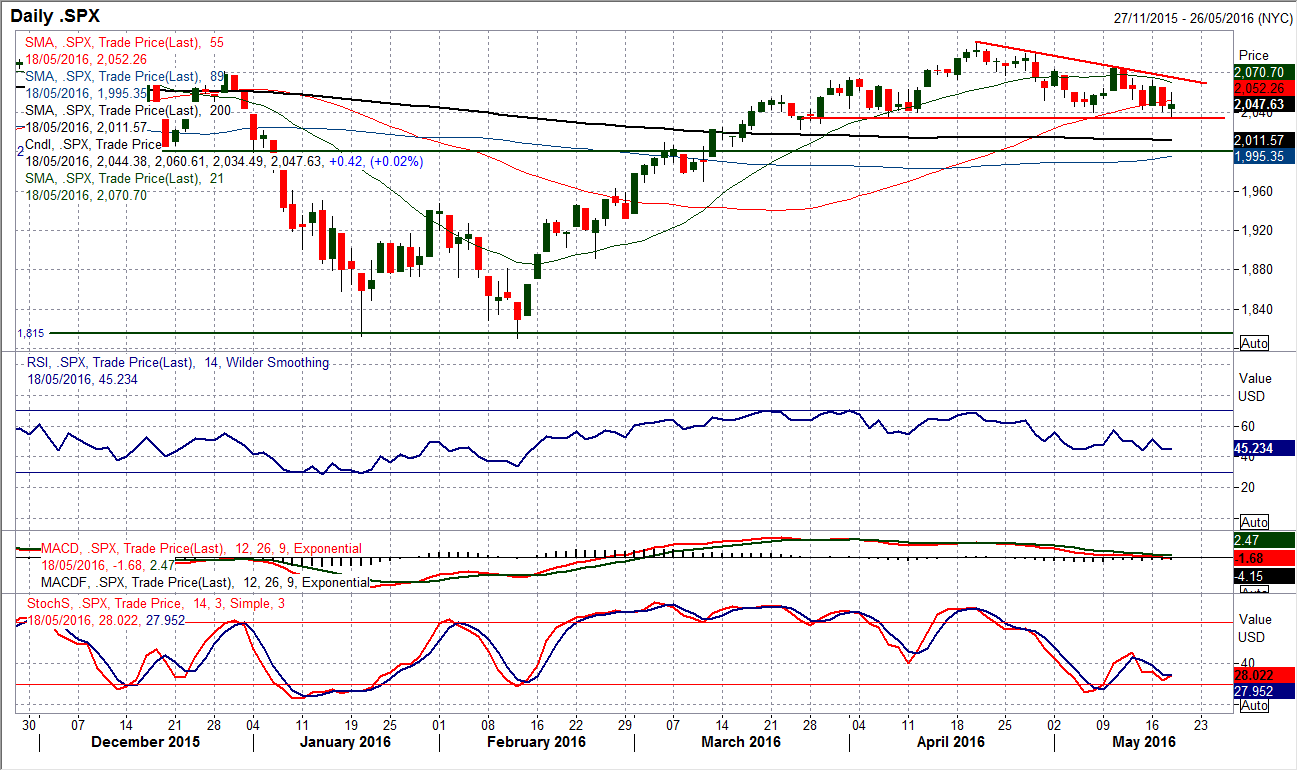
I do not often talk about the S&P 500 however it is a market of huge importance and it is on the brink of forming a big head and shoulders top pattern. Since topping out at 2111 in April, the S&P 500 has been making a succession of lower highs in the formation of a four week corrective downtrend. The momentum indicators have rolled over and are looking increasingly corrective with the RSI around 3 month lows and the MACD lines on the brink of turning negative. The 21 day moving average (currently 2070) which had done a good job of supporting during the run higher, has now rolled over and is becoming the basis of resistance. The chart looks to be coming towards a test of the key support at 2033, a level that was tested on an intraday basis last night. A breach of 2033 would complete the head and shoulders top pattern which would imply a target of 1955, whilst the pattern would be confirmed on a move below the late March low at 2022. The hourly chart also reflects the corrective outlook, whilst the near term resistance is at 2072. The outlook will be under pressure until a breach of 2085.
EUR/USD
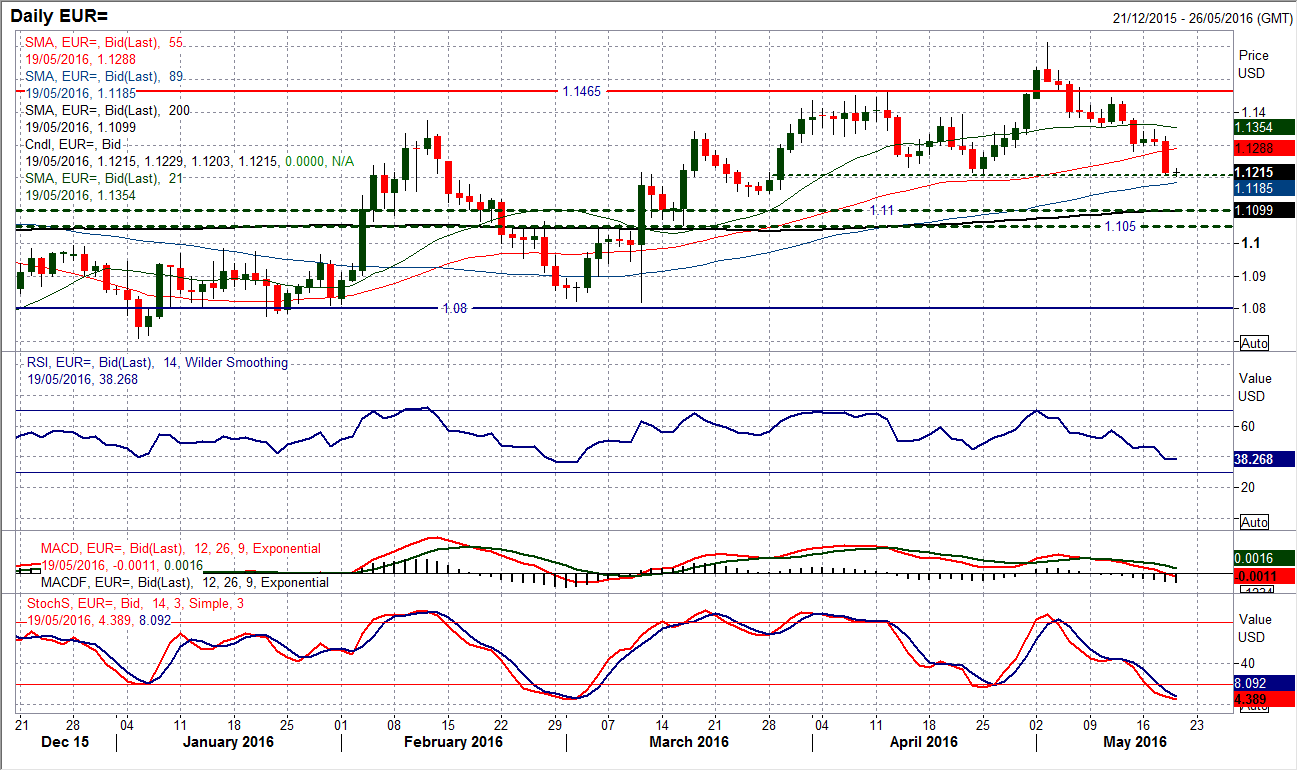
The dollar has continued to strengthen in the wake of the Fed minutes and the pair remains under corrective pressure as the key April low is now being breached. A close below $1.1213 would confirm the breakdown but now it looks increasingly likely that there will be a pullback all the way at least to the $1.1100 long term pivot. So many of the major turning points on EUR/USD in the past 16 months have come in a 50 pip band between $1.1050/$1.1100 so this has to be the next reference point for this correction. Momentum indicators are increasingly corrective with RSI and Stochastics at an 11 week low but also with further downside potential. Rallies are a chance to sell, with the hourly chart showing a continued sequence of lower highs and unwinding moves on the hourly RSI failing between 50/60. The hourly chart also shows the initial resistance band now $1.1255/$1.1290 today. The resistance at $1.1345 is now key.
GBP/USD
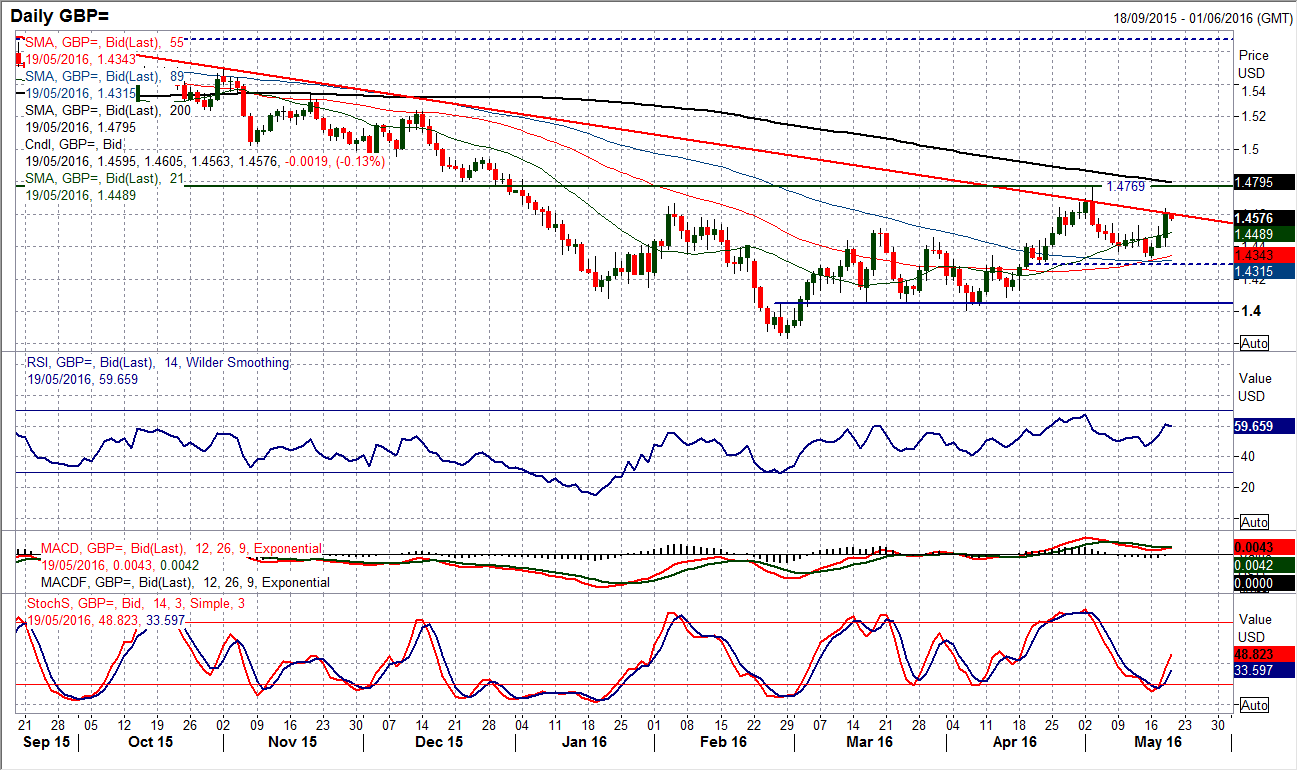
A huge upside surge on Cable yesterday came in the wake of mixed UK employment data but was driven predominantly by a surprisingly strong poll for the Remain camp in the Brexit debate. This move took out a series of near term resistance levels above $1.4530. Even the hawkish Fed minutes failed to make too much of a dent. Technically the outlook is improving once more with the confirmed buy signal on the Stochastics and the RSI picking up again. The big question is whether the European traders will come in to pull the pair back lower in reaction to the Fed minutes today. Clearly there are now two fundamental forces potentially pulling Cable in different directions and this will make for elevated levels of volatility in the coming days and weeks. For now though watch out for $1.4530 being supportive for a retracement today, with once more $1.4400 back in play as a near support. Resistance is now yesterday’s peak at $1.4635 and the key May high at $1.4770.
USD/JPY
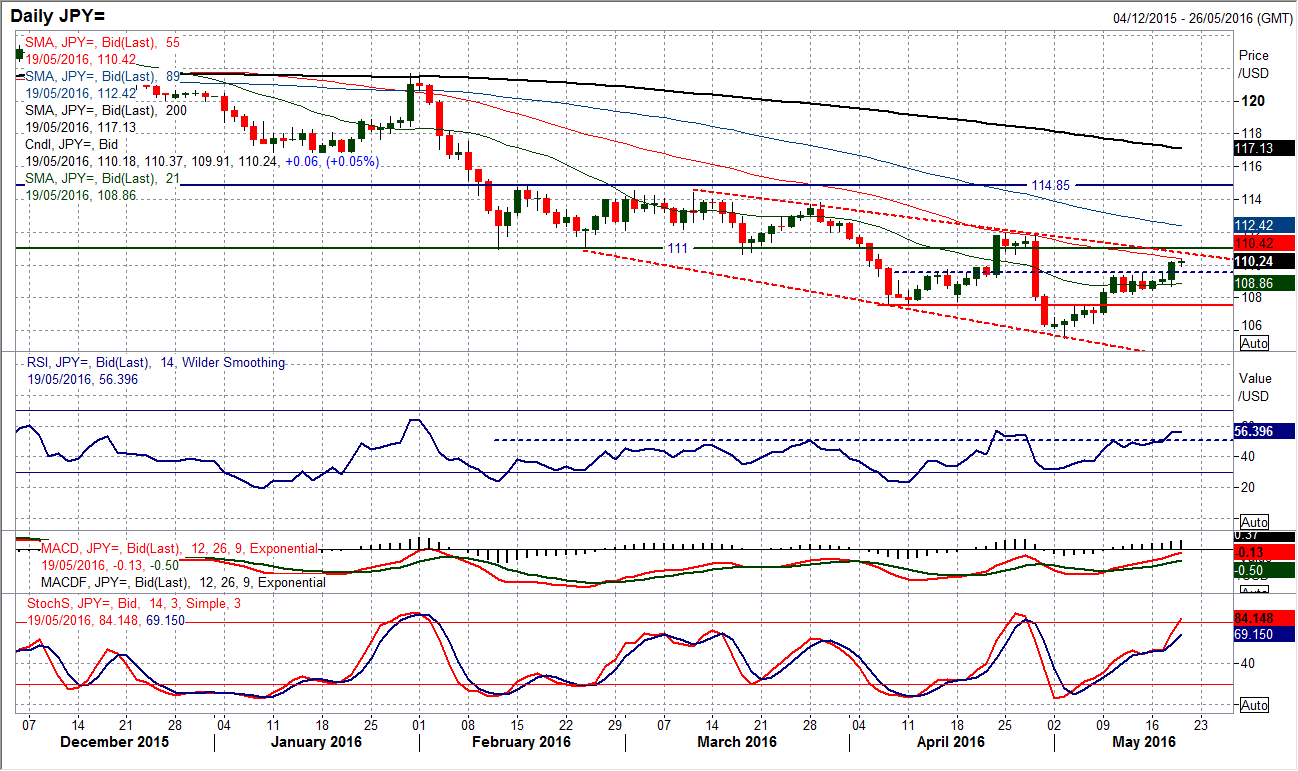
After over a week of consolidation the upside breakout above 109.50 has been confirmed. This implies a 130 pip bull target to 110.80, a level which also coincides with the top of the near three month downtrend channel. The momentum indicators are now certainly picking up with some real traction in the Stochastics, but it will be interesting to see if the RSI can breakout above 60 (a signal for medium term stronger momentum).
With the top of the trend channel approaching at 110.80 and also the resistance of the falling 55 day moving average (currently 110.42) this is becoming a key moment for the technical outlook. The hourly chart shows strong near term momentum whilst 109.50 is already becoming supportive for a near term correction. The overnight low was 109.90. The next key resistance is 111.00 which was the old key floor through February/March, whilst 111.90 was the April rebound high.
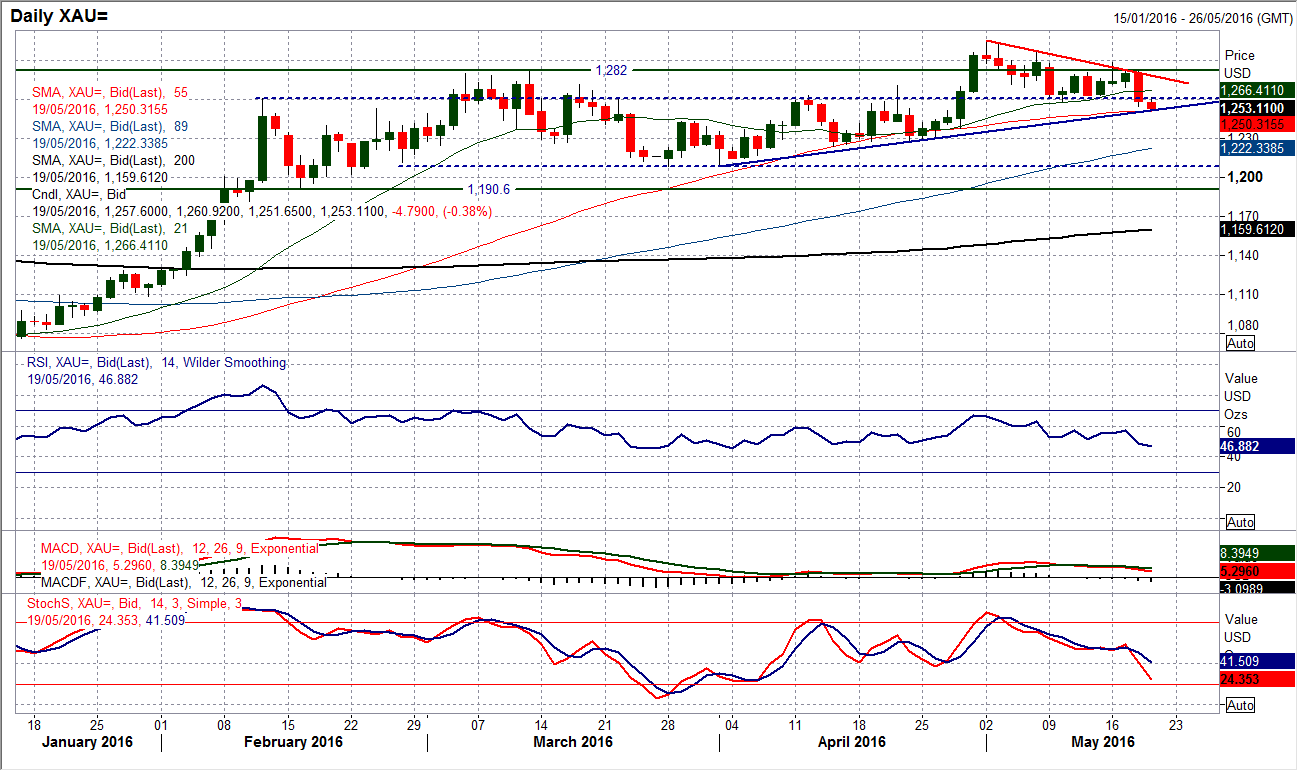
Gold
The negative correlation between gold and the dollar is alive and well, as the gold price reacted negatively to the hawkish Fed minutes. A strong bear candle has breached and closed below the support around $1260 and now the medium term positive outlook is under threat. The uptrend in place for the past seven weeks (currently around $1251) is now being tested with the continuation of the selling pressure today, whilst the 55 day moving average (currently $1250) is also under threat. The RSI has dropped below 50 and a close below 45 tonight would be its lowest in 2016. The Stochastics are also accelerating lower in bearish configuration. If the trend is broken then there are serious questions being asked of the bull control, with the next serious support now until $1227, whilst the old key range low at $1208 would also become a possibility. The hourly chart already shows the old support between $1257.25/$1263.10 is becoming a band of resistance and this would certainly need to be reclaimed by the bulls today otherwise they would have lost control.
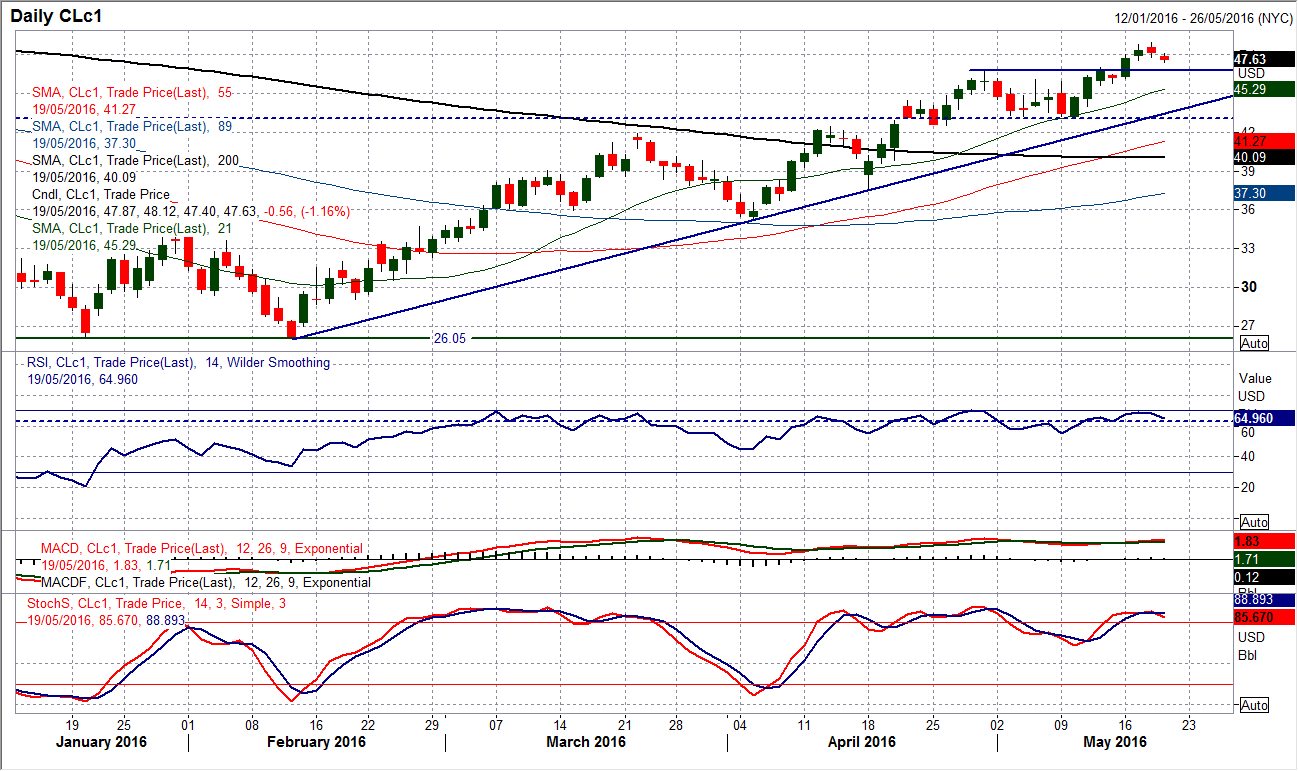
WTI Oil
The impetus of the recent bull run higher was starting to look a bit leggy yesterday and now with the early weakness today a near term correction is building. A surprise EIA inventory build of +1.3m barrels (-3.1m exp) and the stronger dollar in the wake of the Fed minutes has put the pressure on. Daily momentum indicators had been reaching extreme levels again, with the RSI again close to 70 yesterday, a level at which the profit-takers have often started to move in. This could mean that with the price rolling over today, a short period of correction is seen.
The last three times the RSI has peaked around 70 a corrective phase has resulted that has lasted anything from two days to two weeks. The hourly chart shows the support band $45.60/$46.80 seems to be prime retracement for a near term correction, around which the potential next opportunity to buy could be seen. Yesterday’s high at $48.95 now protects the big resistance at $50.92 from the October high. The medium term uptrend is at $43.45 with the May low at $43.00 now key support.
Note: All information on this page is subject to change. The use of this website constitutes acceptance of our user agreement. Please read our privacy policy and legal disclaimer. Opinions expressed at FXstreet.com are those of the individual authors and do not necessarily represent the opinion of FXstreet.com or its management. Risk Disclosure: Trading foreign exchange on margin carries a high level of risk, and may not be suitable for all investors. The high degree of leverage can work against you as well as for you. Before deciding to invest in foreign exchange you should carefully consider your investment objectives, level of experience, and risk appetite. The possibility exists that you could sustain a loss of some or all of your initial investment and therefore you should not invest money that you cannot afford to lose. You should be aware of all the risks associated with foreign exchange trading, and seek advice from an independent financial advisor if you have any doubts.
Recommended Content
Editors’ Picks
EUR/USD clings to daily gains above 1.0650

EUR/USD gained traction and turned positive on the day above 1.0650. The improvement seen in risk mood following the earlier flight to safety weighs on the US Dollar ahead of the weekend and helps the pair push higher.
GBP/USD recovers toward 1.2450 after UK Retail Sales data

GBP/USD reversed its direction and advanced to the 1.2450 area after touching a fresh multi-month low below 1.2400 in the Asian session. The positive shift seen in risk mood on easing fears over a deepening Iran-Israel conflict supports the pair.
Gold holds steady at around $2,380 following earlier spike

Gold stabilized near $2,380 after spiking above $2,400 with the immediate reaction to reports of Israel striking Iran. Meanwhile, the pullback seen in the US Treasury bond yields helps XAU/USD hold its ground.
Bitcoin Weekly Forecast: BTC post-halving rally could be partially priced in Premium

Bitcoin price shows no signs of directional bias while it holds above $60,000. The fourth BTC halving is partially priced in, according to Deutsche Bank’s research.
Week ahead – US GDP and BoJ decision on top of next week’s agenda

US GDP, core PCE and PMIs the next tests for the Dollar. Investors await BoJ for guidance about next rate hike. EU and UK PMIs, as well as Australian CPIs also on tap.