Market Overview
With negative sentiment sweeping through markets, classic bear market assets such as the yen and gold have soared in the past 24 hours. However, in truth there is not one specific catalyst that can be the cause. Concerns about global growth slowing down is the usual excuse, whilst the $100bn reduction in Chinese FX reserves is also a red warning light, however it is just a negative swarm of bear pressure through markets that is a real concern. This is resulting in an enormous flight away from anything risk based and into safe haven plays. The big bearish signals are now flashing with Dollar/Yen falling to its lowest in more than 2 years and gold continuing to make considerable gains. US Treasury yields also continue to slide back. The market is posing Janet Yellen as many questions as Congress will tomorrow. Equity markets are losing key levels of support and until there is something tangible for investors to hang a positive argument on (such as signs of economic improvement, or perhaps a bullish signal on the oil price) it is difficult to see what will stop the malaise.
Wall Street closed another 1.4% lower whilst overnight in Asia with the yen strengthening sharply, the Nikkei has shed 5.4%. European markets are slightly higher at the open but it will be interesting to see if this can last. Forex markets are showing real strain too, with the Japanese yen again very strong, whilst the higher risk commodity currencies are under pressure. A weaker sterling is also reflective of the general set up on a risk-off day in the forex markets. The gold price is around flat currently, something that has been a feature of recent trading, with the sharp gains tending to come as the European session gets going. Oil looks to be relatively settled with the key near term support at $29.25 on WTI holding.
Again there is little really on the economic calendar with UK Trade Balance at 0930GMT expected to improve slightly to -£10.4bn (-£10.6bn last month), whilst the US JOLTS job openings at 1500GMT are expected to show a marginal slip to 5.40m (5.43m last month).
Chart of the Day – FTSE 100
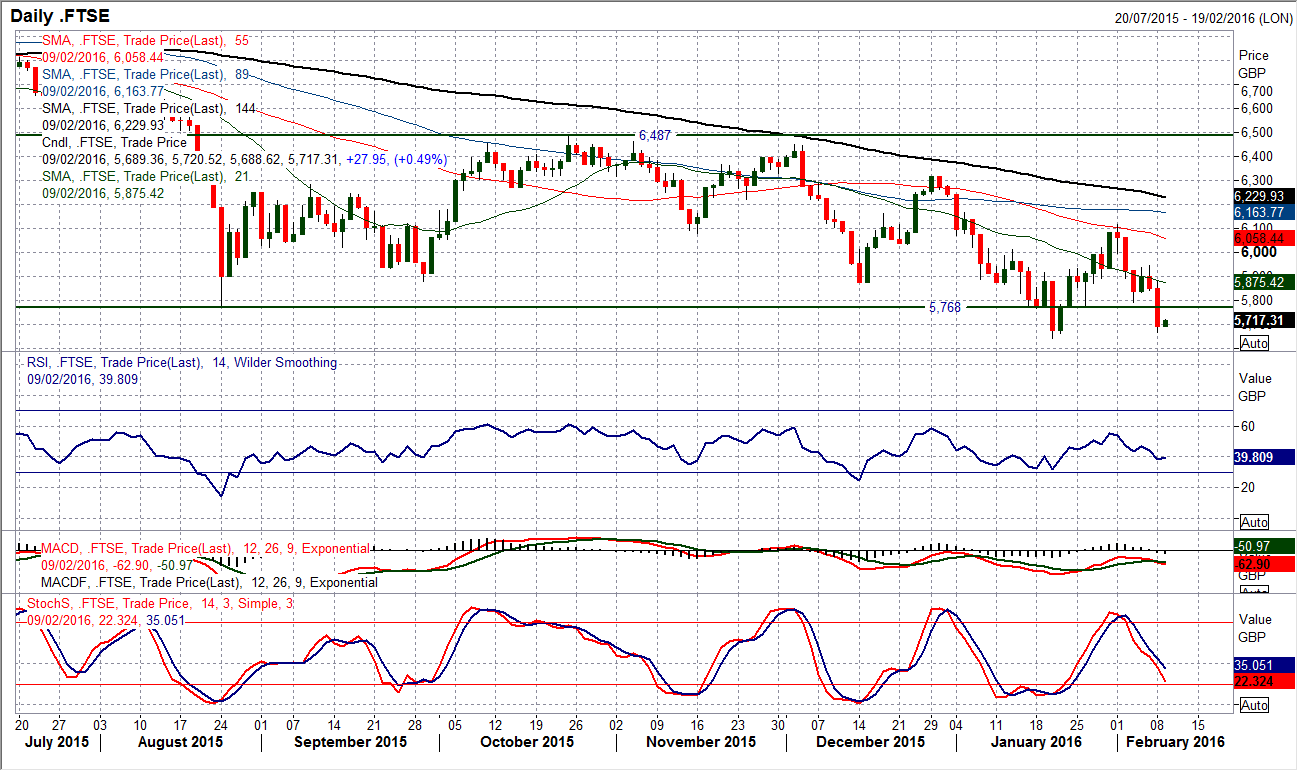
With the DAX breaking down through a massive support to post the lowest level since October 2014, the FTSE 100 is not trailing too far behind. Yesterday’s breakdown of FTSE 100 below the old key floor at 5768, re-opened the key January low at 5640. This is a level which loosely protects further weakness in the FTSE towards levels not seen since November 2012 when the index bounced off 5600. The concern is that there is plenty of downside potential in the momentum still with the RSI closing at 38 last night, but also the MACD lines are just above to bearishly cross again, whilst the Stochastics are also extremely bearishly configured near term. The old floor at 5768 becomes the basis of resistance for any attempted near term rally now but rallies will be seen as a chance to sell with little if anything positive to hang on to from a technical perspective. There is so much overhead supply that houses the next clutch of short sellers that selling into strength is the only viable strategy now. Below 5600 is 5478 but there is a real prospect of a retreat to the 5230 June 2012 low now.
EUR/USD
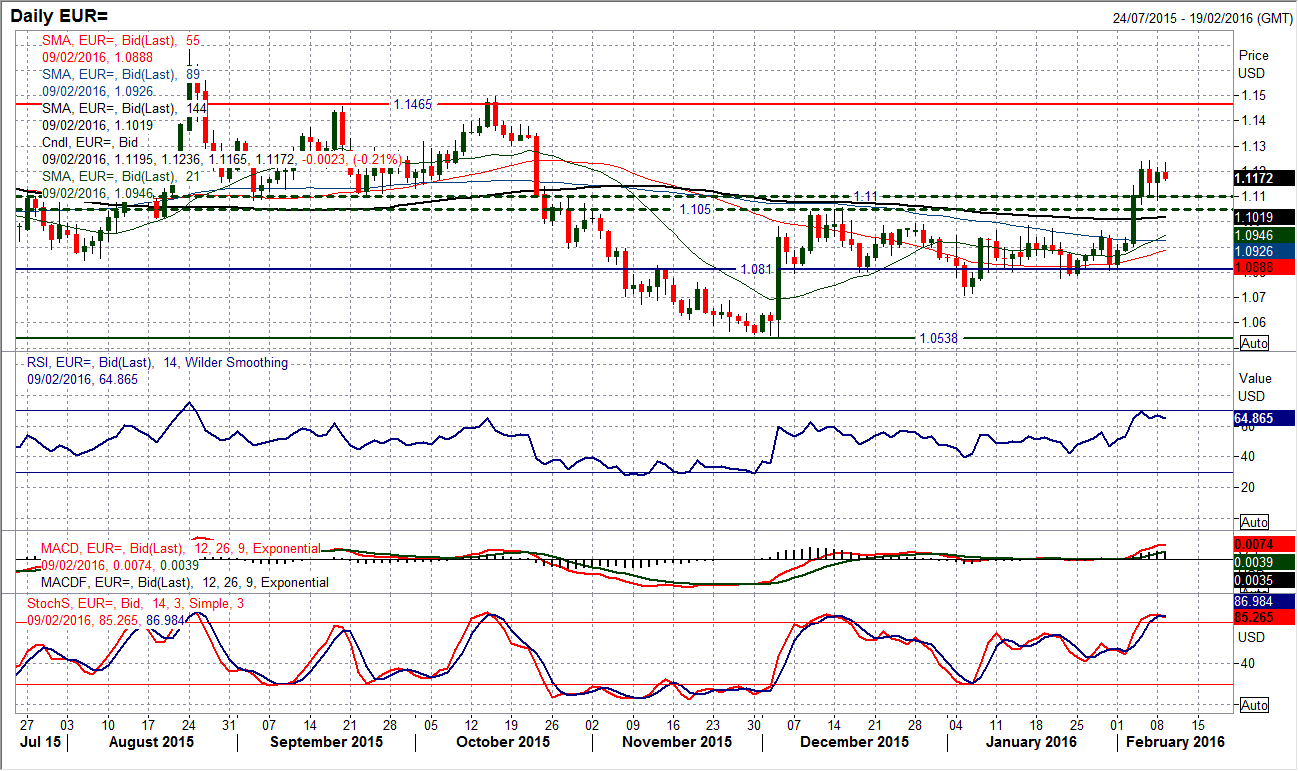
I continue to see the breakout above the pivot band $1.1050/$1.1100 as a bullish move that will result in a push higher towards the $1.1460 long term range highs again. I also believe that this pivot band will act as a basis of support now for the bulls and an opportunity to buy. This is what we saw yesterday as a dip into the support found the buying pressure coming back in at $1.1084 (just above the intraday support at $1.1070) before pulling back towards the day highs again. The momentum on the euro is still positive with the RSI solidly in the high 60s and Stochastics bullishly configured. The resistance around $1.1240 is just holding back the move higher for now but once this is cleared I expect the euro to continue its progress towards the next resistance around $1.1300. The hourly chart shows the recent $1.1070/$1.1240 is a consolidation band, but the daily chart suggests the next move is likely to be an upside break.
GBP/USD
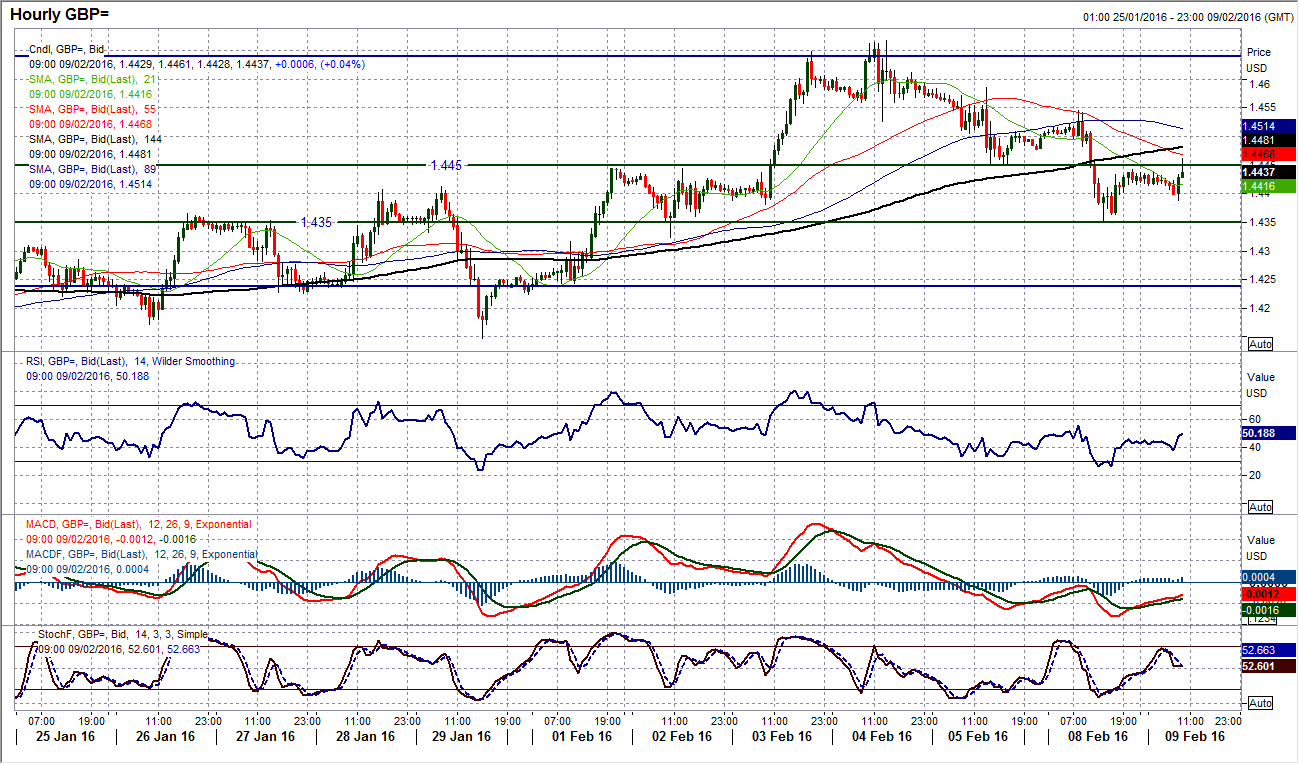
My argument for a positive outlook is being stretched. I spoke yesterday about there being a minor near term correction that was fine until a breach of the $1.4350 price support and the 23.6% Fibonacci retracement of $1.4353. These levels are being increasingly tested now, with yesterday’s low almost hitting $1.4350 to the pip before an intraday bounce. This is clearly a level therefore that is being watched in the market. The concern is that momentum is now looking to be in reverse with the Stochastics in decline and RSI now falling away. The hourly chart shows a series of lower highs, with the latest being at yesterday’s high of $1.4545, whilst hourly moving averages are rolling over and providing resistance. The hourly momentum is now more negatively configured too and the danger is that a failure to break back above the pivot band resistance at $1.4445 will add to the downside pressure. A breach of $1.4350 would put the bears back in control and open $1.4235 support.
USD/JPY
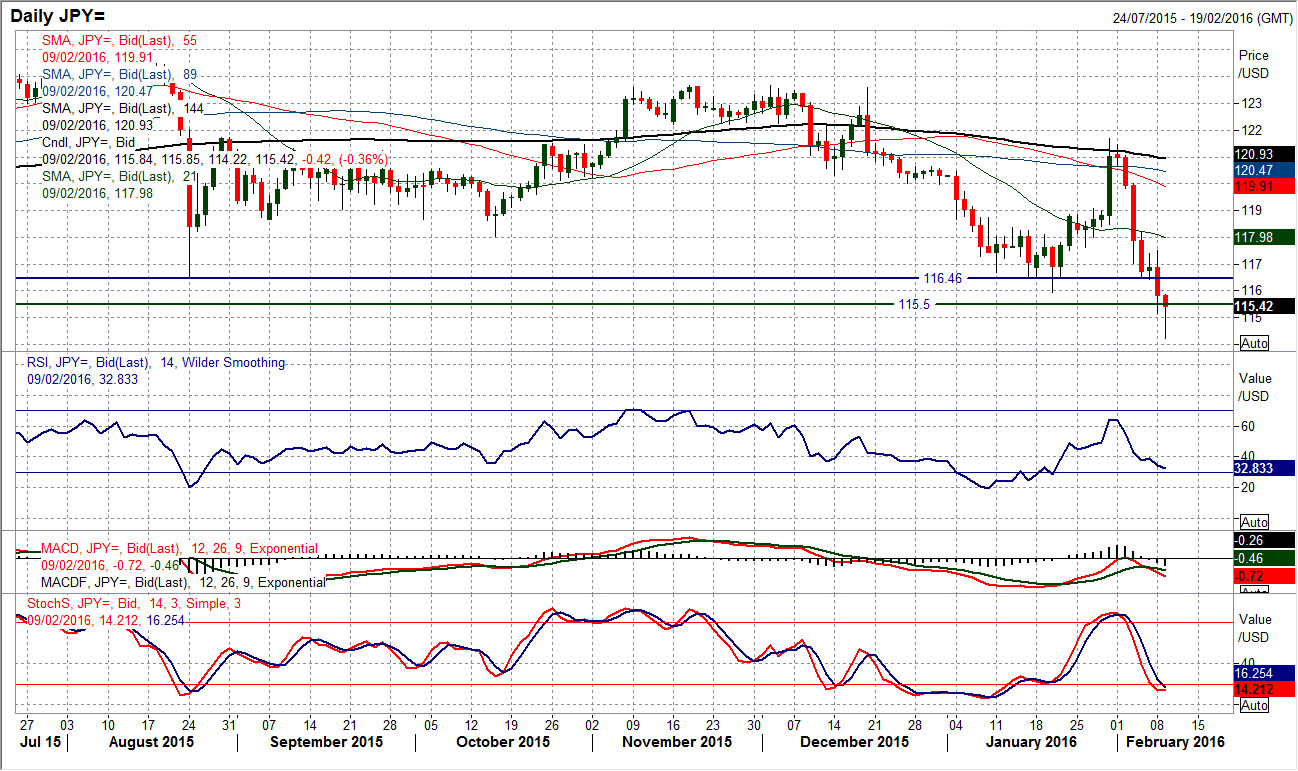
Dollar/Yen has become the most remarkable chart of all the forex chart I look at. Having gone from over 121.50 in the wake of the Bank of Japan devaluation, the yen has strengthened to pull the pair lower by a remarkable 700 pips in just 7 sessions. This is a move that has shattered the old floor around 116.50 during yesterday’s sharply bearish candle only to continue lower today to so far hit a low at 114.22. If, as it seems increasingly likely, Dollar/Yen closes below the old December 2014 low at 115.55 then this would complete a huge top pattern. Depending upon how the downside target is calculated, conservative predictions could have the pair back down at around 107.50 area. It would not get there in a straight line though. For now the volatility remains huge and the momentum is still showing further downside potential. However on a near term basis the hourly chart looks fairly stretched and this could induce a technical rally near term. There is resistance at 115.70/115.85 before the old support becomes new resistance at 116.50.
Gold
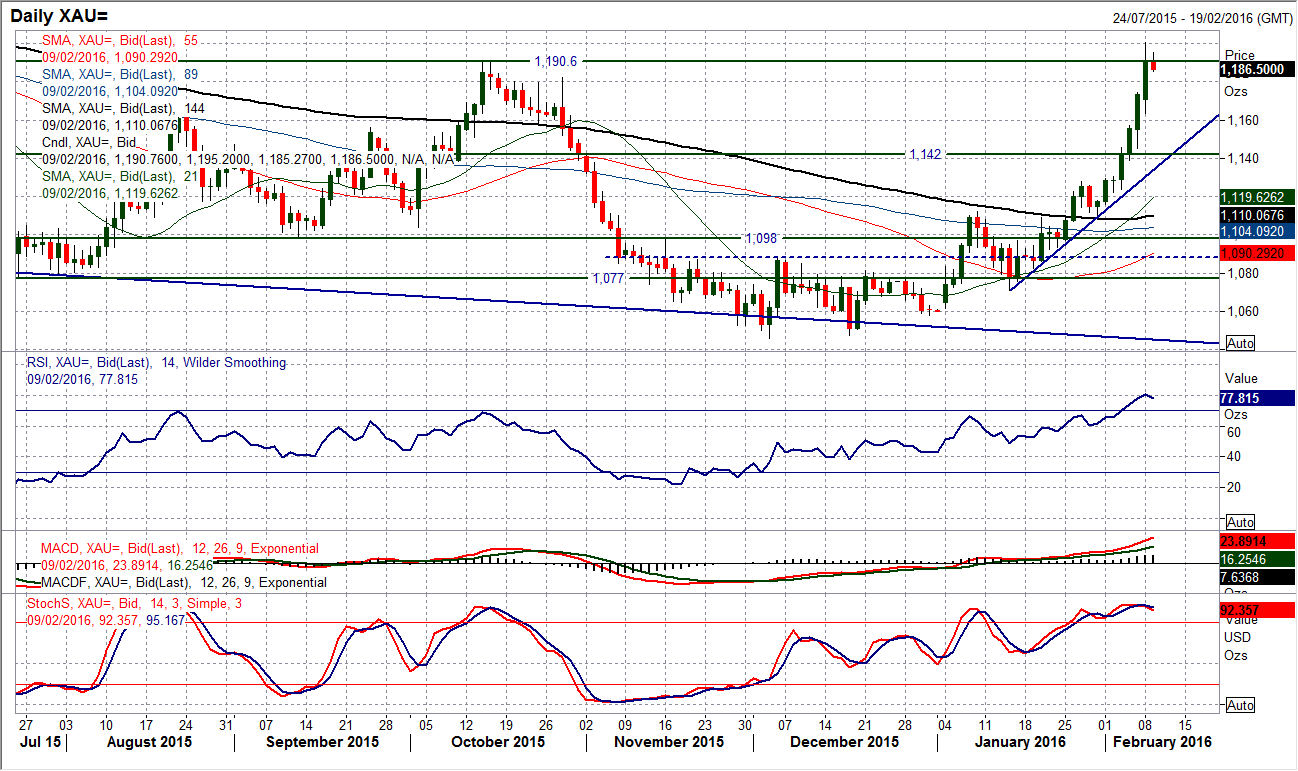
Another chart on an incredible run is gold. The recovery in gold has been so positive that it is changing the longer term outlook. On a technical basis, the definition of a downtrending market is one which posts a series of lower key reaction highs. With the breakout above the October 2015 highs of $1190.60, the gold price can no longer be considered to be in a long term downtrend. This also means that my upper price prediction on gold for 2016 (which was for a choppy range between $1000 and $1200) has already been seen. The bulls are certainly with the run higher for now and the momentum is so strong that it would be difficult to bat against it. The move is now adding between $15 to $20 per day and the June2015 high at $1205 and the May 2015 high at $1232 should not be ruled out. The concern I have in these situations is that the market gets ahead of itself and when the rug is pulled out from under the feet there is a sizeable correction. Today’s candle is currently entirely outside the Bollinger Bands and the move is really looking stretched now. A close back inside the Bollinger Bands (top band at $1187 currently) could be a signal now to take profits. Initial support is at $1188 with Friday’s high at $1174.50 further support.
WTI Oil
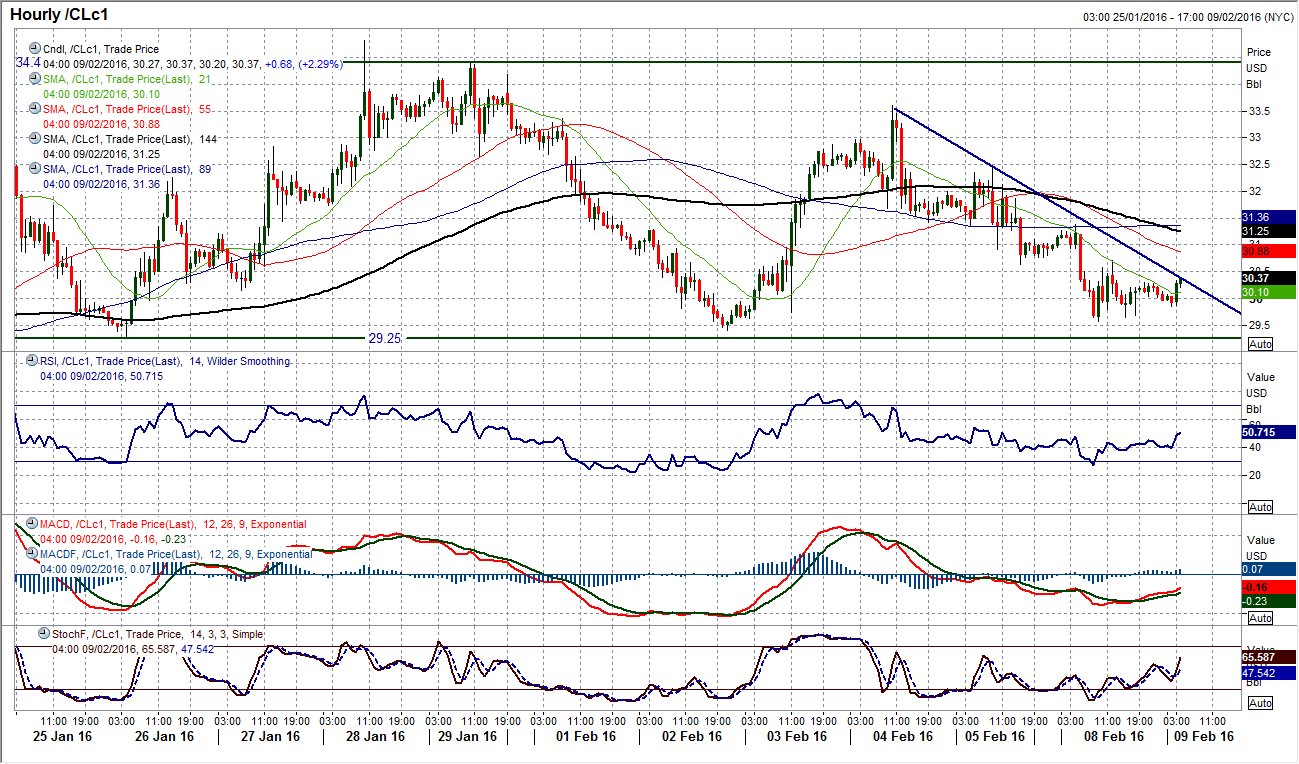
Bull traders are hanging on by their fingertips as the pressure on the key near term supports between $29.25 and psychological $30 continues. However, with the 3 month downtrend intact and near term momentum indicators deteriorating, the pressure is mounting. The Stochastics already having given a bearish cross last week, the momentum study continues to deteriorate. The $29.25 support marks the lows of the past couple of weeks and would in fact mean a completed head and shoulders top pattern is the breakdown were to be seen. This would imply at least a retest of the $26.20 key January low, but with momentum indicators showing renewed downside potential the concern would be for much further losses. The hourly chart shows a series of lower highs now forming under the key resistance at $33.60, with highs at $32.45 and $31.40. The hourly moving averages are also now falling in bearish sequence whilst the momentum is bearishly configured to suggest rallies are a chance to sell.
Note: All information on this page is subject to change. The use of this website constitutes acceptance of our user agreement. Please read our privacy policy and legal disclaimer. Opinions expressed at FXstreet.com are those of the individual authors and do not necessarily represent the opinion of FXstreet.com or its management. Risk Disclosure: Trading foreign exchange on margin carries a high level of risk, and may not be suitable for all investors. The high degree of leverage can work against you as well as for you. Before deciding to invest in foreign exchange you should carefully consider your investment objectives, level of experience, and risk appetite. The possibility exists that you could sustain a loss of some or all of your initial investment and therefore you should not invest money that you cannot afford to lose. You should be aware of all the risks associated with foreign exchange trading, and seek advice from an independent financial advisor if you have any doubts.
Recommended Content
Editors’ Picks
AUD/USD posts gain, yet dive below 0.6500 amid Aussie CPI, ahead of US GDP

The Aussie Dollar finished Wednesday’s session with decent gains of 0.15% against the US Dollar, yet it retreated from weekly highs of 0.6529, which it hit after a hotter-than-expected inflation report. As the Asian session begins, the AUD/USD trades around 0.6495.
USD/JPY finds its highest bids since 1990, approaches 156.00

USD/JPY broke into its highest chart territory since June of 1990 on Wednesday, peaking near 155.40 for the first time in 34 years as the Japanese Yen continues to tumble across the broad FX market.
Gold stays firm amid higher US yields as traders await US GDP data

Gold recovers from recent losses, buoyed by market interest despite a stronger US Dollar and higher US Treasury yields. De-escalation of Middle East tensions contributed to increased market stability, denting the appetite for Gold buying.
Ethereum suffers slight pullback, Hong Kong spot ETH ETFs to begin trading on April 30

Ethereum suffered a brief decline on Wednesday afternoon despite increased accumulation from whales. This follows Ethereum restaking protocol Renzo restaked ETH crashing from its 1:1 peg with ETH and increased activities surrounding spot Ethereum ETFs.
Dow Jones Industrial Average hesitates on Wednesday as markets wait for key US data

The DJIA stumbled on Wednesday, falling from recent highs near 38,550.00 as investors ease off of Tuesday’s risk appetite. The index recovered as US data continues to vex financial markets that remain overwhelmingly focused on rate cuts from the US Fed.
