Market Overview
I still see the economic data as extremely important for the direction of the dollar and yesterday’s reaction to the weaker than expected Retail Sales was this case in point. A sharp move against the dollar in the next few hours. However with so much economic data to look for this week the move only lasted a few hours, which I see as being a feature of the moves in the coming days. An initial reaction before the market looks ahead to the next release. On the agenda today are a couple of industrial pieces and some housing data. The choppy trading is likely to continue.
Wall Street closed mildly higher, perhaps boosted by a weaker dollar (dollar strength continues to be seen as a problem, with Johnson & Johnson yesterday citing it as a problem in its outlook statement), but also helped higher by a decent earnings report from banking giant JPMorgan Chase. The S&P 500 closed 0.2% higher. Asian markets overnight have been focusing on crucial Chinese data. A whole raft of data has been released and it has not made especially positive reading. GDP came in line with expectations at 7.0% (down from 7.3% last quarter), but there was also further releases on industrial output and retail sales which both missed expectations. Perhaps not enough to drive the immediate requirement for further easing from the People’s Bank of China, Asian markets have been mixed in their response. Shanghai has flitted between losses and slight gains, with the Nikkei 225 off 0.2%. European markets are mixed to slightly higher today.
In forex trading, after suffering some heavy intraday losses yesterday, the dollar has begun to stabilize again and is edging some slight gains once more, albeit marginal. There has been little significant reaction to the Chinese data amongst the commodity currencies. Although the Aussie is the worst performing of the majors against the dollar today, perhaps there is an element of relief as it could have been much worse if there had been a 6 handle to the Chinese GDP.
Traders will be watching out initially for the ECB monetary policy decision at 1245BST. Although no change is expected to the rates, the press conference will be watched for news on the central bank’s monetary easing programme and volatility on the euro will often result. There is also a raft of US data, with the New York Fed Manufacturing data at 1330BST (+7.0 expected), although be mindful that 5 of the past 6 months have all missed expectations. Then at 1415BST there is the Industrial Production which is expected to deteriorate by -0.3% on the month, whilst Capacity Utilization is expected to also pull back slightly to 78.7 (from 78.9). Then at 1500BST the NAHB housing market index is expected to improve slightly to 55 (from 53) after having dropped for the past 3 months. Then finally the US oil inventories are at 1530BST which are expected to drop back to 4.1m barrels (from 8.2m last week).
Chart of the Day – DAX Xetra
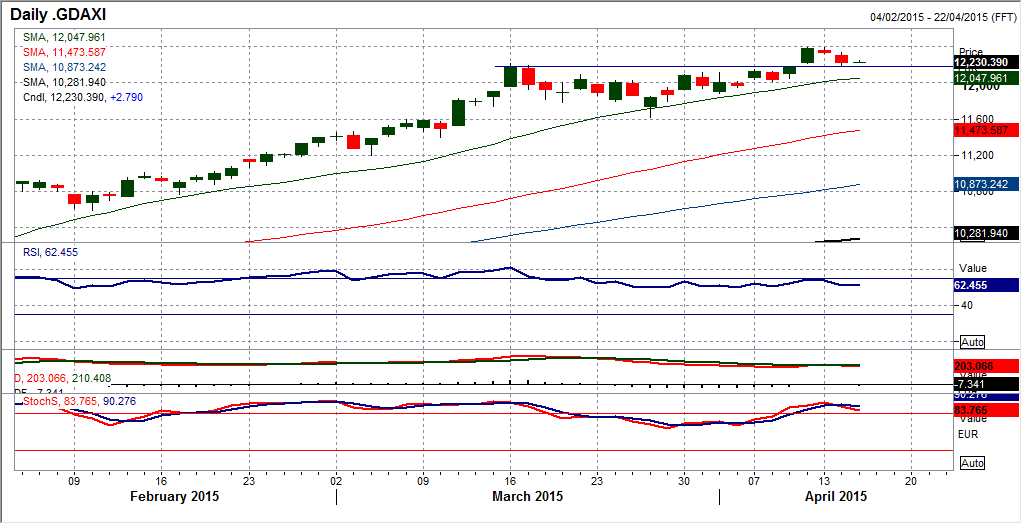
As part of a move that reconfirms the bullish outlook, yesterday’s corrective candle can still be considered as constructive. In a strong move higher, it is good to occasionally have a quick shakeout to help to reinvigorate the bulls and I see yesterday’s correction as just that. The gap higher from 12,166 that was left last Friday has been all but filled yesterday (only short by a mere 15 points) and today’s support suggests that the bulls are ready once more. I continue to see the rising 21 day moving average (currently 12,032) as a good gauge for the support of the move higher, whilst momentum indicators are also positive, especially the RSI and the MACD. The intraday hourly chart is also very interesting as through this bull run the RSI has been continually retreating back to around the 40 level to find support for the next push higher. Also the MACD lines are also continually coming back to neutral to help renew upside potential in the uptrend. This would all suggest that corrections such as yesterday are a chance to buy. Just as an aside, watch for the negative correlation between the strength of the euro and the strength of the DAX, which I also continue to find interesting.
EUR/USD
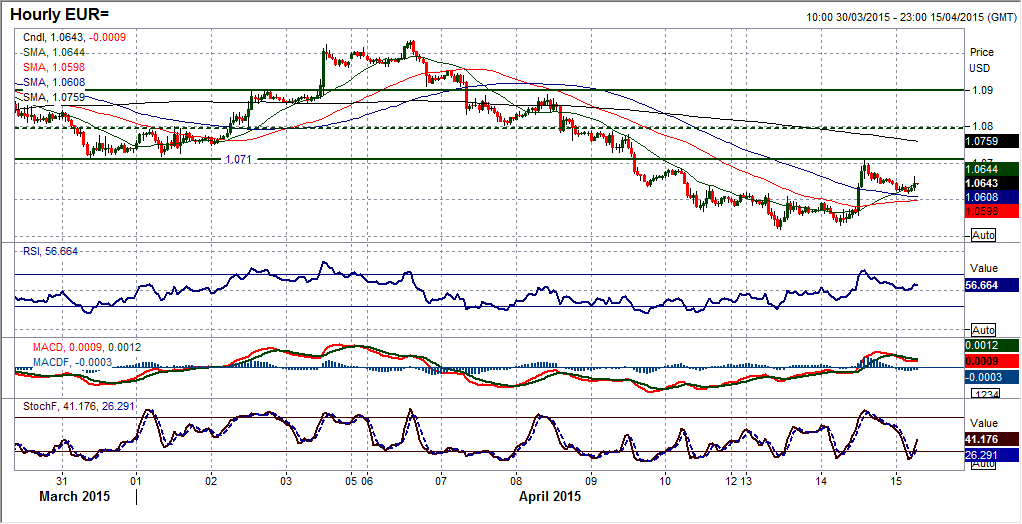
There was a very interesting move yesterday on the Euro, one which does confuse the outlook to a certain extent, but also one which I believe gives another opportunity to sell. After six straight sessions of declines, the euro rallied. The move came on the back of weaker than expected US Retail Sales and means that from Monday’s low at $1.0520 there has been a rally of almost 190 pips. However, in the outlook of the selling pressure since the FOMC minutes, this is not a significant move. The initial resistance at $1.0712 (the old support of the previous breakdown which is now resistance) held up the recovery yesterday which has since begun to lose momentum. The daily chart shows the Stochastics crossover but for now, this is the only real signal that suggests upside. The intraday hourly chart shows a drift back from yesterday’s peak at $1.0707, and it will be interesting to watch the hourly momentum indicators now. The RSI and MACD have improved but need to sustain upside impetus. The initial support around $1.0615 needs to hold to prevent the near term bulls from seeing their work undone. My expectation is that rallies will be sold into and I see this being part of that process. The resistance is now set around $1.0710 and I would look to use any move higher as a selling opportunity as I do not see enough in this rally to suggest it is sustainable. A second day of confirmed gains would begin to improve the near term outlook but much still needs to be done.
GBP/USD
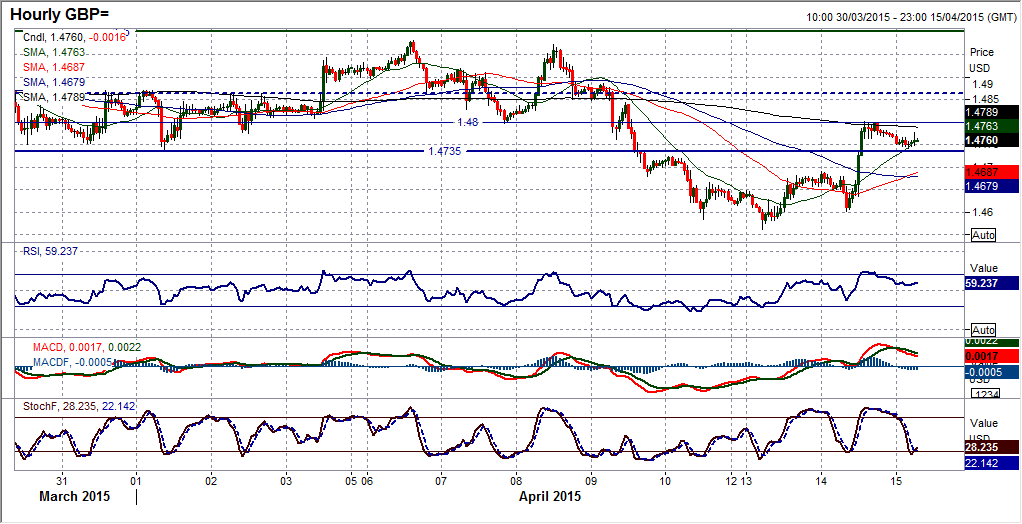
The rally on Cable looks to be a little better set than it does on the euro. The small hammer candle of Monday was backed up by the strong reaction yesterday. However, as with the euro there is still lots that needs to happen to convince me that this is anything more than yet another opportunity to sell. I have long seen the 21 day moving average on Cable as a guide for the outlook and as the selling pressure has taken Cable lower again it has become a basis of resistance (currently at $1.4826). Daily momentum indicators suggest that the outlook remains medium term negative with rallies being seen as a chance to sell. The intraday hourly chart is interesting as the resistance band between $1.4735/$1.4800 capped the gains yesterday and the rally has since rolled over. This rolleing over has also resulted in the hourly momentum indicators losing impetus. As with the euro, I see the overhead resistance as significant (in the 200 pip band between $1.4800/$1.5000) and I think this is a rally that will be sold into. It may be a choppy ride but ultimately I see sterling back down and testing the lows once more. A breach of the initial support band $1.4725/35 would re-open the downside once more for a test of $1.4563.
USD/JPY
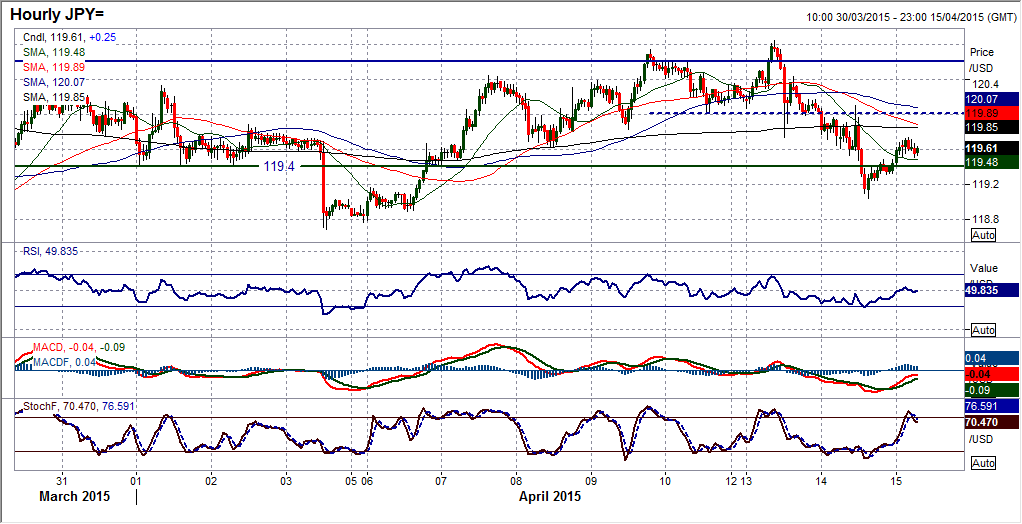
The dollar had a weak day yesterday followed by an element of support returning overnight, which plays into this whole choppy consolidation theme on Dollar/Yen. I continue to see just two or three days of any one direction before a retracement and once more it is possible that this is what we are seeing. Taking a step back and in the past few weeks, lows have been posted at 118.30 (the big near/medium term support), then at 118.77 and now potentially overnight at 119.04. This shows a gradual creep of higher lows. In that time there have also been a gradual creep of higher highs, so there is a slight bullish bias to the outlook, but due to the lack of any real decisive trading it is very choppy, as the past few days have proven. Back above 119.40 (which I see as a pivot level despite a move below yesterday), means that there is a slightly improved outlook in the past 12 hours and if the dollar can push through the near term resistance at 119.60/120.00 then the bulls can begin to regain confidence once more. Otherwise the outlook will remain very mixed and difficult to play near term. Above 120.00 re-opens the 120.84 high once more.
Gold
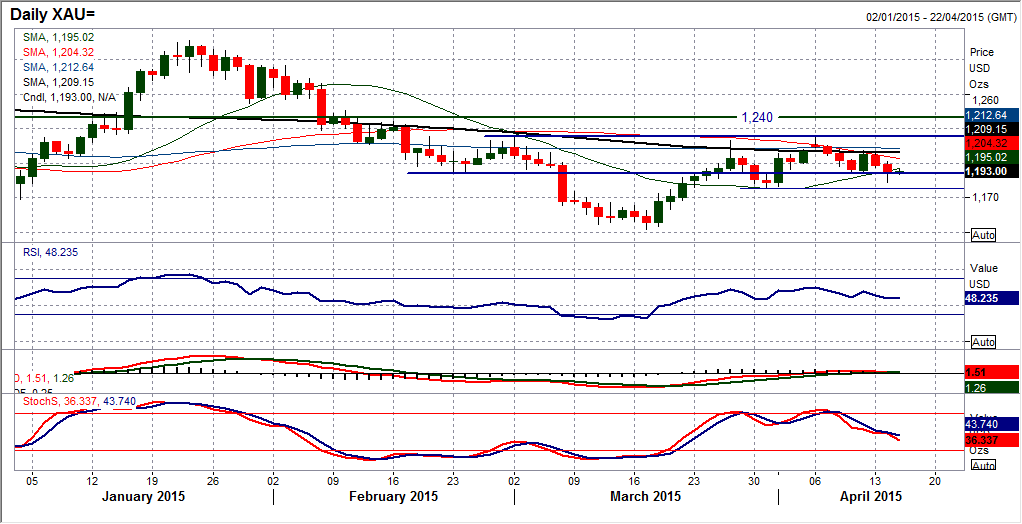
For now, I continue to see gold as a near to medium term range play and the choppy price action yesterday has again played into that outlook. I find it interesting that although the yesterday’s candle tail reached a low at $1183.70, the body of yesterday’s candle (and so far today’s candle) remains above the $1191 support. In any case the key support at $1178 which means that I retain my outlook also remains intact. Momentum indicators are fairly neutral, however I am beginning to be slightly concerned by the falling Stochastics which may begin to weigh on the price. The intraday hourly chart suggests that there is a sequence of lower highs over the past few days that the bulls will need to break. The latest level is at $1198.80 and failure again today to breach this level could add to the slight downside pressure building up on the daily chart. A move above $1200 would confirm the continuation of the range between $1178/$1224.
WTI Oil
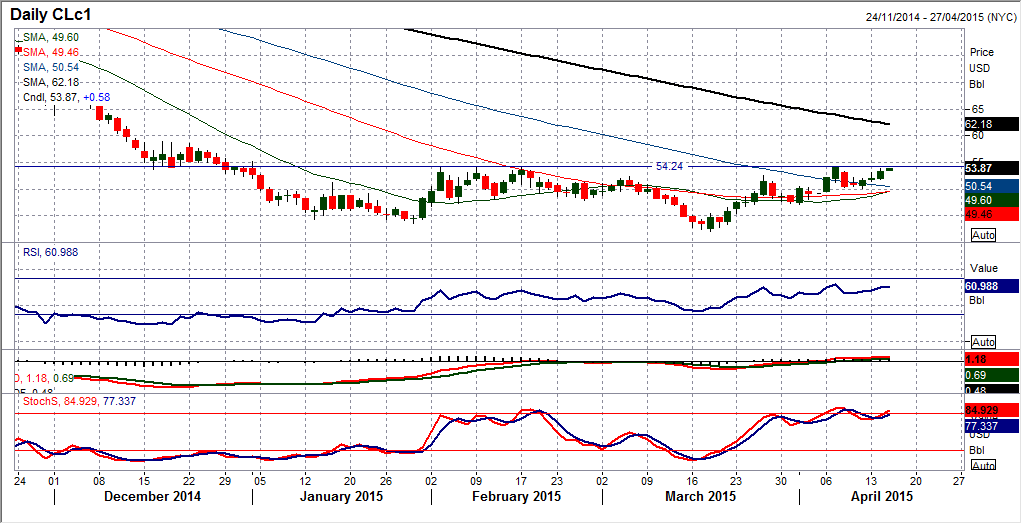
After a couple of uncertain trading of tentative control, the bulls are making a case once more and look to be making a move. A rally to a 5 day high has turned the outlook within the range more positive once again. This now re-opens a test of the key resistance in place at $54.24. The 3rd February high has been tested on 3 occasions subsequently, but each time the bulls have failed to make the breakout. Now with a move above the initial resistance around $52.50 the bulls are well positioned for another test of $54.24. The momentum on the daily chart is beginning to turn more positive once more and it is interesting to see the RSI pushing back towards the 60s which is suggesting that momentum continues to improve. The intraday hourly chart shows a higher low has been left at $51.50 above the key support around $50.00. It is interesting to note also that the drive higher yesterday was taken from the weaker than expected US retail sales data which also suggests that watching the US economic announcements could be key near term.
Note: All information on this page is subject to change. The use of this website constitutes acceptance of our user agreement. Please read our privacy policy and legal disclaimer. Opinions expressed at FXstreet.com are those of the individual authors and do not necessarily represent the opinion of FXstreet.com or its management. Risk Disclosure: Trading foreign exchange on margin carries a high level of risk, and may not be suitable for all investors. The high degree of leverage can work against you as well as for you. Before deciding to invest in foreign exchange you should carefully consider your investment objectives, level of experience, and risk appetite. The possibility exists that you could sustain a loss of some or all of your initial investment and therefore you should not invest money that you cannot afford to lose. You should be aware of all the risks associated with foreign exchange trading, and seek advice from an independent financial advisor if you have any doubts.
Recommended Content
Editors’ Picks
EUR/USD retreats below 1.0700 after US GDP data

EUR/USD came under modest bearish pressure and retreated below 1.0700. Although the US data showed that the economy grew at a softer pace than expected in Q1, strong inflation-related details provided a boost to the USD.
GBP/USD declines below 1.2500 as USD rebounds

GBP/USD declined below 1.2500 and erased the majority of its daily gains with the immediate reaction to the US GDP report. The US economy expanded at a softer pace than expected in Q1 but the price deflator jumped to 3.4% from 1.8%.
Gold drops below $2,320 as US yields shoot higher

Gold lost its traction and turned negative on the day below $2,320 in the American session on Thursday. The benchmark 10-year US Treasury bond yield is up more than 1% on the day above 4.7% after US GDP report, weighing on XAU/USD.
XRP extends its decline, crypto experts comment on Ripple stablecoin and benefits for XRP Ledger

Ripple extends decline to $0.52 on Thursday, wipes out weekly gains. Crypto expert asks Ripple CTO how the stablecoin will benefit the XRP Ledger and native token XRP.
After the US close, it’s the Tokyo CPI

After the US close, it’s the Tokyo CPI, a reliable indicator of the national number and then the BoJ policy announcement. Tokyo CPI ex food and energy in Japan was a rise to 2.90% in March from 2.50%.
