Market Overview
With currency pairs still unsure of how to digest the latest instalment of Federal Reserve monetary policy, the equity markets have made a useful rebound. After weekly jobless claims in the US fell to multi-year lows, Wall Street rebounded following two days of sharp losses. The VIX Index of volatility also fell sharply by 8% and back below 20. The S&P 500 closed 1% higher, with Asian markets also following suit. The European markets have also opened slightly higher today. However, the extension of European Union sanctions on Russia may take some of the shine off potential gains.
In forex trading there remains a sense of consolidation on the euro, whilst Dollar/Yen also continues to be range bound. It would appear that even though Japanese inflation came in slightly worse than expected (the national core figure came in at an unadjusted 2.5% from 2.6% expected), there has been little discernible reaction on the yen. The Aussie dollar has bounced slightly after yesterday’s breakdown to a multi-year low.
Traders today will be looking out for the Eurozone flash CPI inflation data that is released at 1000GMT. The expectation is for deflation in the region to have fallen to -0.5% from last month’s -0.2%, whilst there must be a fear of an undershoot of this after German inflation was also worse than expected yesterday. The big announcement of the day comes at 1330GMT with the advance reading of Q4 2014 US GDP. The expectation is for growth of 3.0% (keep in mind though that last quarter the advance number came in at 3.5% before twice being revised higher to 5.0%). There is also the final number of the University of Michigan Sentiment at 1455GMT which is expected to come in at 98.5.
Chart of the Day – AUD/USD
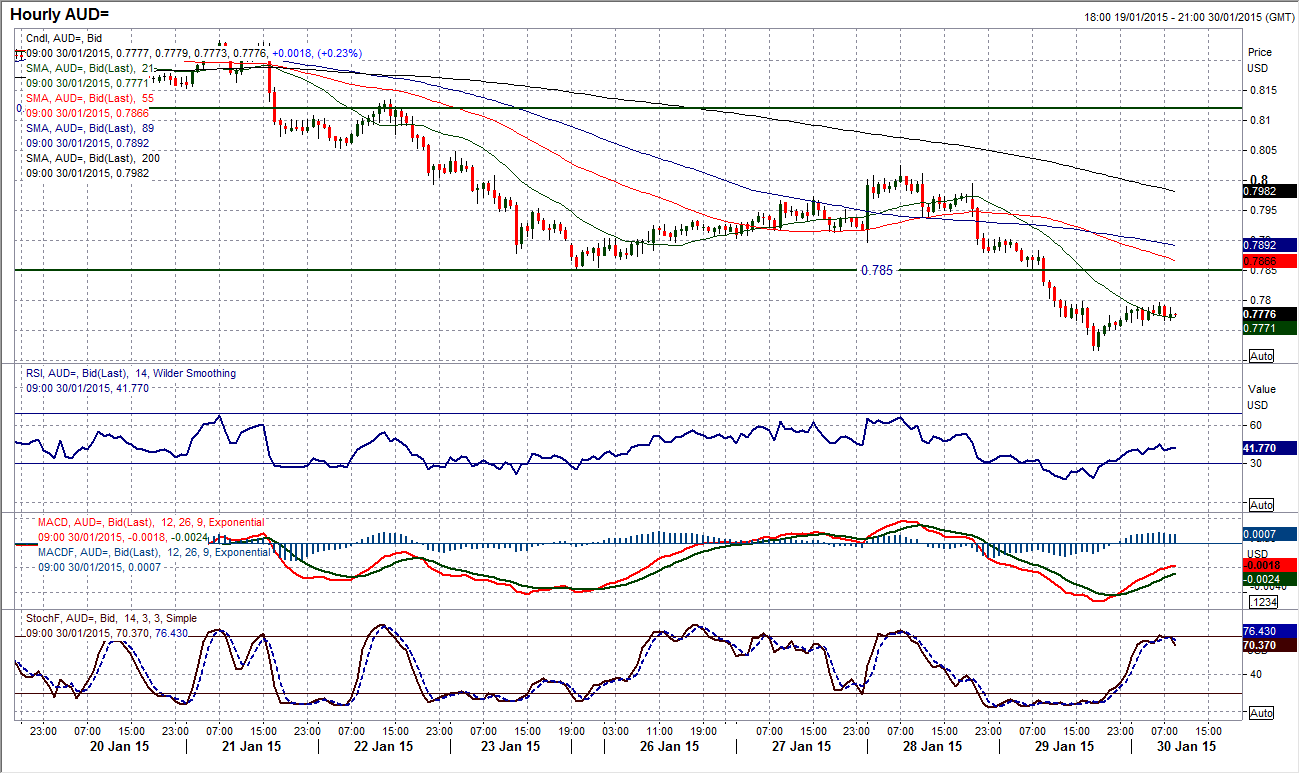
Following a bearish outside day on Wednesday, the Aussie dollar has fallen to its lowest level since July 2009. Although a low of 0.7719 has been found overnight there is now serious pressure on the next key support of 0.7700 which is the July 2009 low (below that is 0.7450). It might seem incredible to suggest it, but the way this sell-off is progressing, the ferocity of the downside pressure suggests that the chances of a complete retracement back to the October 2008 low at 0.6000 should not be dismissed out of hand. For now though we must look for selling opportunities and any rebound (even intraday) will now be viewed as a chance to sell. The intraday hourly chart shows there to be minor breakdown resistance now at 0.7850, whilst there is further resistance at 0.7900. The hourly momentum indicators are simply unwinding from an overstretched near term position and look to be getting ready for a renewed assault on 0.7700.
EUR/USD
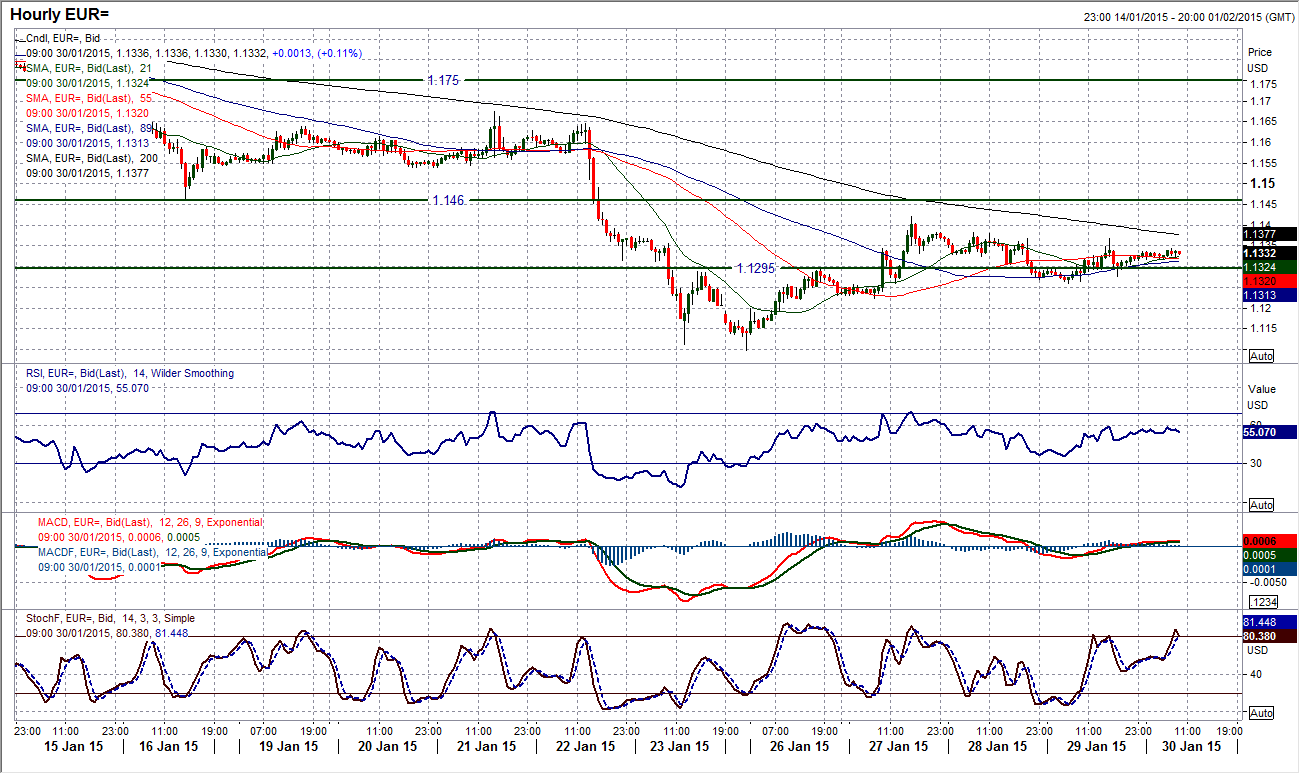
The euro has been consolidating ever since the FOMC announcement on Wednesday but looking at the daily chart this simply looks to be another instance of the bears renewing their downside potential for another sell-off. The resistance of the 6 week downtrend today comes in at $1.1430. The daily RSI has unwound to over 30 but this is indicative of a bear market rally. In the absence of any real buying pressure the sellers look to be biding their time. The intraday hourly chart looks to be a little more of a mixed outlook near term but having completed the small base pattern, the bulls have not been able to gain any real upside traction for a recovery. For now the euro is trading sideways but the weight of the bearish technical factors is still weighing strong and I expect a retest of the $1.1098 low in due course. I am looking for a sell signal to kick things off. There is initial resistance at $1.1382 and then $1.1422.
GBP/USD
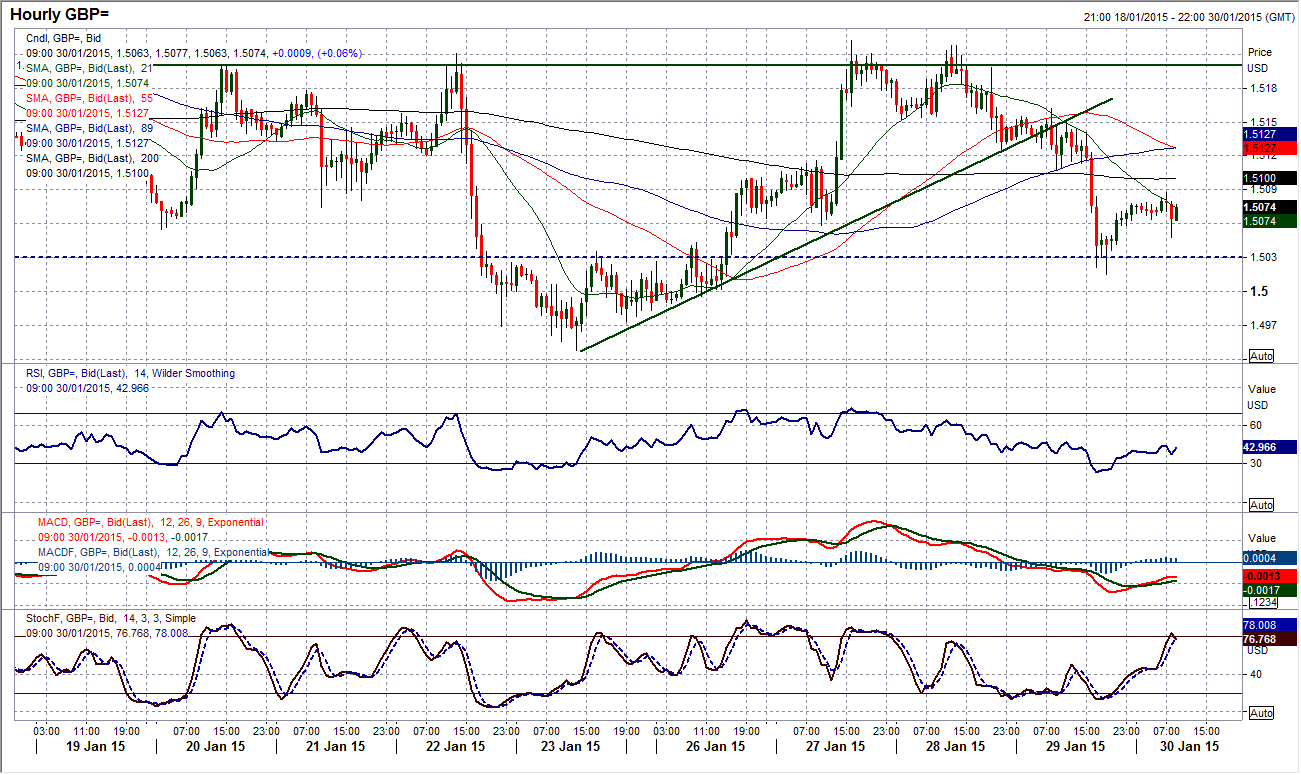
The selling pressure has returned for Cable as the crossroads that I spoke above a few days ago has resulted in an about turn in the rally and the sellers to resume control. The falling 21 day moving average (c. $1.5140) continues to act as a good basis of resistance, whilst the RSI once again cannot breach the mid-40s and the $1.5200 resistance area shown on the intraday hourly chart has provided the ceiling. Broken 4 day uptrend on the intraday hourly chart reflects the deterioration, as do the hourly momentum indicators which are now in bearish configuration. There has been a slight rebound overnight but I would now be looking at strength as a chance to sell again, with resistance around $1.5120. The bulls will point to the support that has formed around $1.5030 which was an old key resistance and could become supportive, however I would expect further pressure on this level today once the rebound runs out of steam. I expect a retest of the $1.4948 low in due course. Resistance comes in also around $1.5160 before $1.5200 again.
USD/JPY
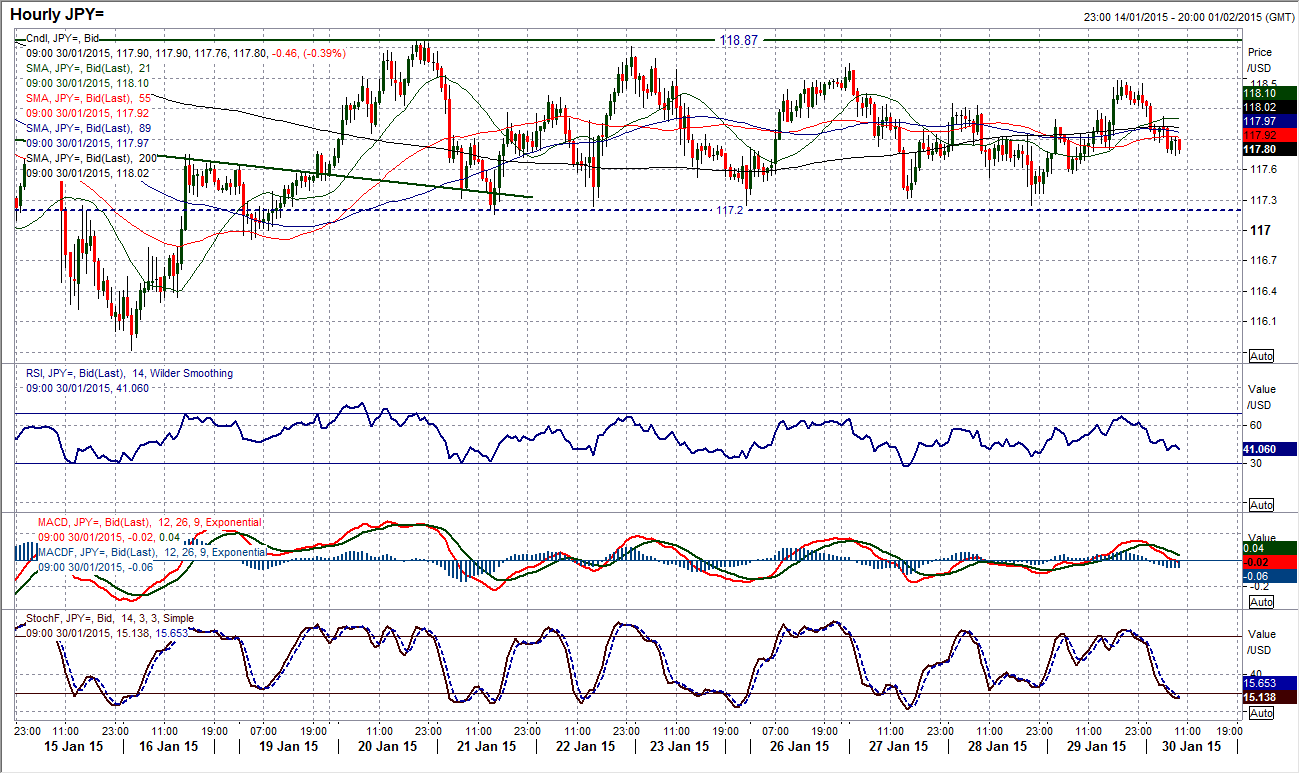
The consolidation between 117.20/118.90 is into its 9th day and is showing very little sign of ending any time soon. Daily technical indicators remain neutral and whilst the range is intact it remains likely that this will remain the case until a decisive break is seen. It seems that perhaps I was a little quick to dismiss the RSI as a viable trading tool on the intraday hourly chart yesterday, as once more the rally of yesterday afternoon took the RSI up towards 70 at which point the reversal kicked in once more The outlook is neutral but playing the range is the only viable way to trade for now, buy when RSI is towards 30 and sell when it is towards 70. The only real support of any relevance is 117.20, whilst the only real resistance of relevance is 118.87. Once either of these are broken we can talk about a new move, but for now Dollar/Yen remains rangebound.
Gold
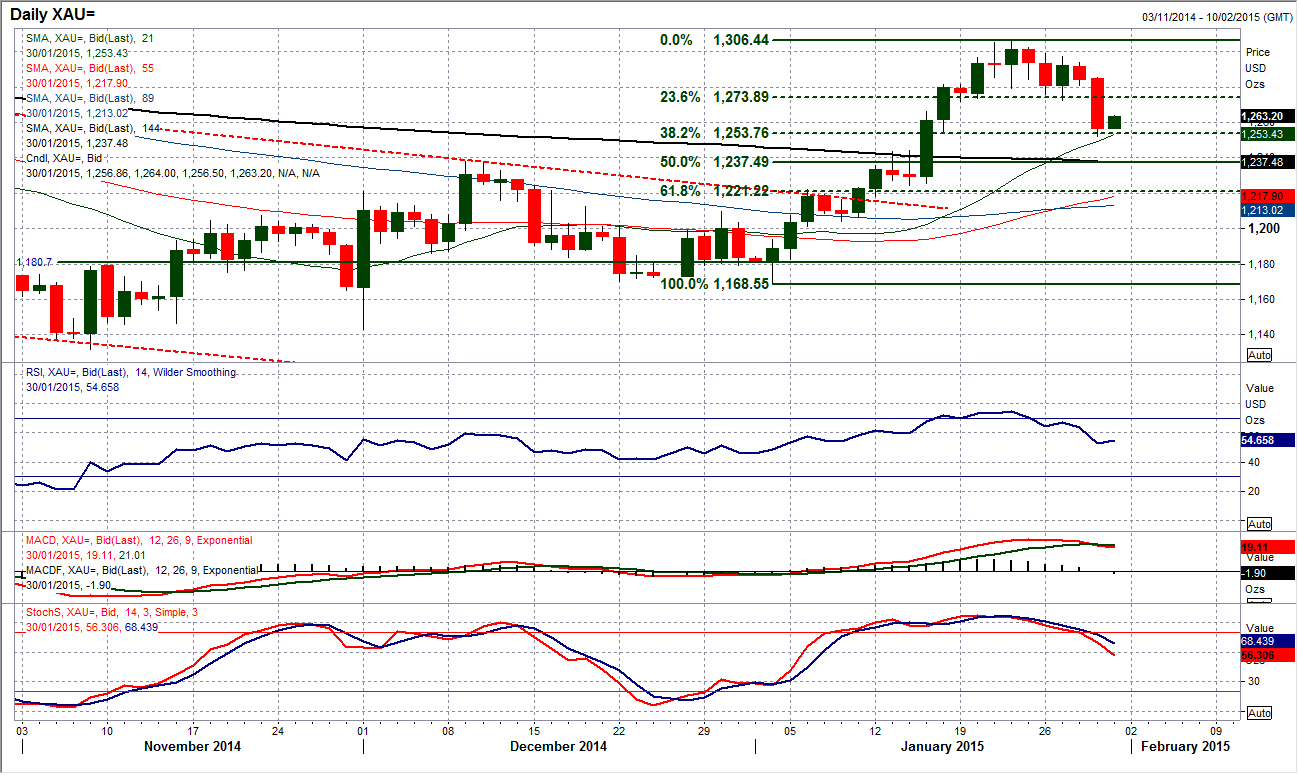
Anyone who wants to see an excellent example of Fibonacci retracements at work can look at the move of gold yesterday. I have been talking about the fact that once the support at $1271.85 had been breached the loss of the 23.6% Fibonacci retracement (around $1274) of the bull run $1168.25/$1306.20 would mean that the gold price would subsequently fall back to the 38.2% Fib line at $1254. Yesterday the price did exactly that. Te implied target from the intraday top pattern of $1252 has also been hit and since then we have seen a consolidation. I see this as a good development for the bulls as the price has pulled back to the breakout support around $1255 (the old key October high) which I see as a medium term buying level. The next job is for the bulls to form some support around these levels (next support is at $1243.60) and if it can build then the unwinding can be seen as a positive development. For now I am turning neutral near term, but I am now hoping for the bulls to find their feet once more.
WTI Oil
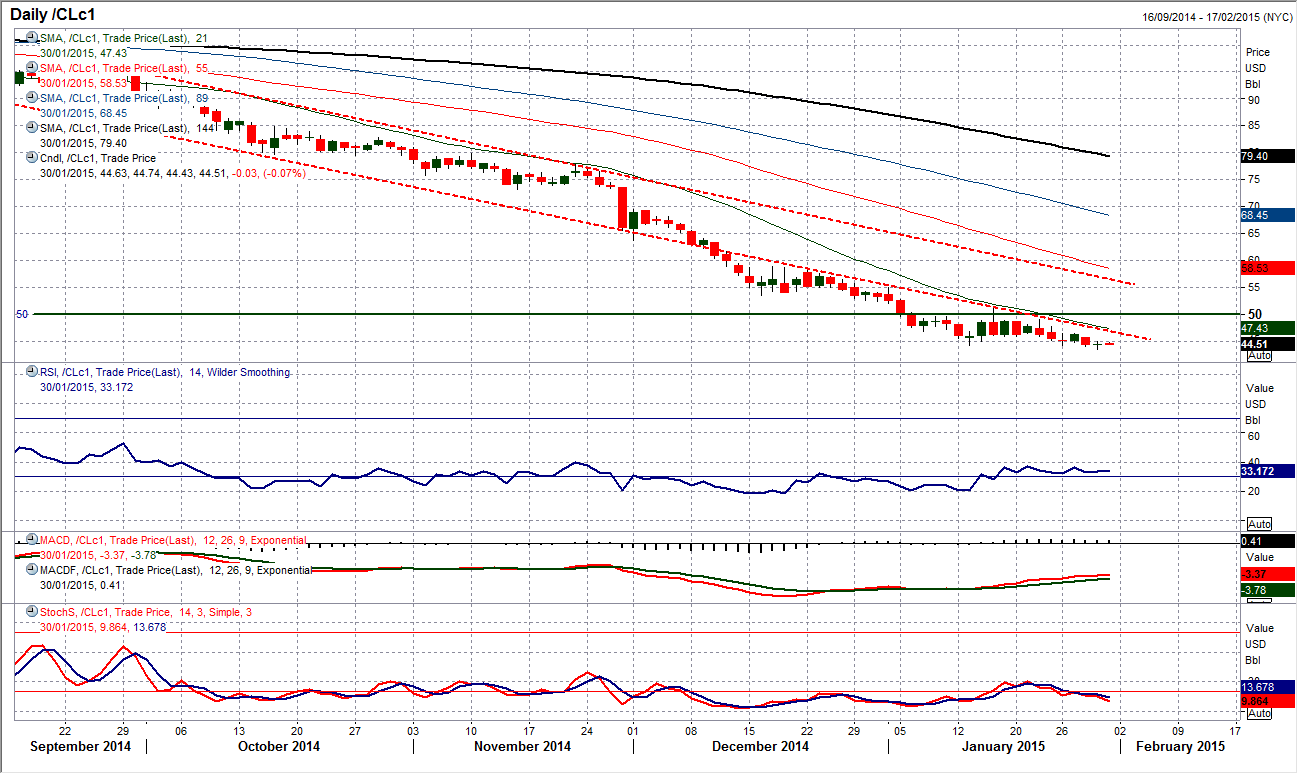
Yesterday the WTI Oil price broke to levels not seen since March 2009. The outlook is once more deteriorating and despite the fact that the selling pressure has not been overwhelming yet, the break below support at $44.20 has opened the next support at $40. The problem is that the daily momentum indicators have unwound, with the RSI unwound to just above 30 which suggests that within the bearish configuration there is renewed downside potential. On the intraday hourly chart the last week of trading has been characterised by a sequence of lower and whilst the daily chart shows the falling 21 day moving average is capping the major rallies, however trading nearer term, using the intraday chart for the less significant rallies, the 89 hour moving averages is currently the basis of resistance c. $45.00. The near term bulls would be looking more positive on a rally above $46.55, however using any strength as a chance to sell remains the best strategy.
Note: All information on this page is subject to change. The use of this website constitutes acceptance of our user agreement. Please read our privacy policy and legal disclaimer. Opinions expressed at FXstreet.com are those of the individual authors and do not necessarily represent the opinion of FXstreet.com or its management. Risk Disclosure: Trading foreign exchange on margin carries a high level of risk, and may not be suitable for all investors. The high degree of leverage can work against you as well as for you. Before deciding to invest in foreign exchange you should carefully consider your investment objectives, level of experience, and risk appetite. The possibility exists that you could sustain a loss of some or all of your initial investment and therefore you should not invest money that you cannot afford to lose. You should be aware of all the risks associated with foreign exchange trading, and seek advice from an independent financial advisor if you have any doubts.
Recommended Content
Editors’ Picks
EUR/USD holds gains near 1.0650 amid risk reset

EUR/USD is holding onto its recovery mode near 1.0650 in European trading on Friday. A recovery in risk sentiment is helping the pair, as the safe-haven US Dollar pares gains. Earlier today, reports of an Israeli strike inside Iran spooked markets.
GBP/USD recovers toward 1.2450 after UK Retail Sales data

GBP/USD is rebounding toward 1.2450 in early Europe on Friday, having tested 1.2400 after the UK Retail Sales volumes stagnated again in March, The pair recovers in tandem with risk sentiment, as traders take account of the likely Israel's missile strikes on Iran.
Gold price defends gains below $2,400 as geopolitical risks linger

Gold price is trading below $2,400 in European trading on Friday, holding its retreat from a fresh five-day high of $2,418. Despite the pullback, Gold price remains on track to book the fifth weekly gain in a row, supported by lingering Middle East geopolitical risks.
Bitcoin Weekly Forecast: BTC post-halving rally could be partially priced in Premium

Bitcoin price shows no signs of directional bias while it holds above $60,000. The fourth BTC halving is partially priced in, according to Deutsche Bank’s research.
Geopolitics once again take centre stage, as UK Retail Sales wither

Nearly a week to the day when Iran sent drones and missiles into Israel, Israel has retaliated and sent a missile into Iran. The initial reports caused a large uptick in the oil price.
