Market Overview
Coming into today’s trading, market sentiment is again fairly positive after a strong handover from both Wall Street and Asian trading in front of what could be a crucial ISM manufacturing read. This comes despite the mixed data coming out of Asia overnight. The official China manufacturing PMI actually came in slightly higher than expected at 49.8 which was slightly higher than last month’s 49.7 and also beat expectations of 49.6. However this is tempered by the news that the final Caixin China Manufacturing PMI (unofficial data) remained deeply negative at 47.2 which is a six and a half year low. Furthermore there was data out of Japan with the government’s Tankan manufacturing survey which fell to 12 from 15 last month and below the 13 than had been expected. However the feeling is that this is another data point that may steer the Bank of Japan towards further monetary easing, so markets have taken this as a positive. After a strong close on Wall Street with the S&P 500 up 1.9% the Asian markets were again strong across the board with the Nikkei was up 1.9% overnight. European markets are also taking the lead today and are again positive.
The outlook on forex markets shows the US dollar slightly stronger, with gains versus the euro and the yen, however the commodity currencies are performing well in the wake of the better than expected official China manufacturing PMI. Gold is again weaker whilst the oil price continues to be supported.
Traders will be watching out for the steady stream of manufacturing PMIs today from the Eurozone early in the session with the regional data at 0900BST which is expected to be 52.0. The UK manufacturing PMI is at 0930BST and is expected to dip slightly to 51.3 (from 51.5) whilst the US ISM Manufacturing is at 1500BST and is expected to drop to 50.6 which would be a third consecutive month of deterioration and would also be the lowest since May 2013. Aside from the PMIs there is also the US weekly jobless claims at 1330BST which is expected to be 270,000 just above the 267,000 last week.
Chart of the Day – Silver
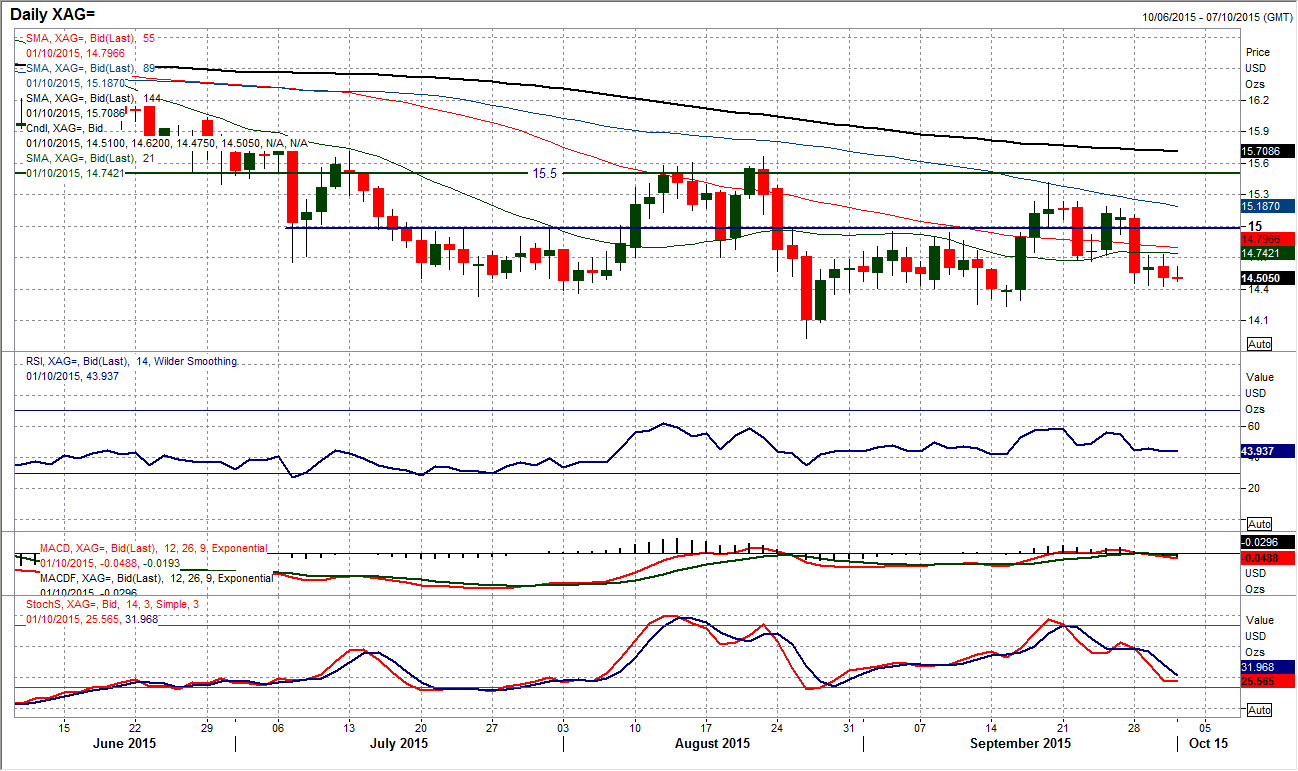
The outlook for silver does seem to be a touch more ranging than it is for gold, however this should not disguise what is still a generally bearish chart. Once more the rally has rolled over and has been seen as an opportunity to sell again. The selling pressure may not be enormous but it is still present. Since the rally fell over at $15.42 there have been a series of neutral or bearish candles with only on single bullish reaction. The momentum indicators reflect this with the MACD lines again having given a medium term sell signal (crossover around neutral) with the Stochastics and RSI also falling away. The chart suggests using rallies as a chance to sell for a retest of $14.25 and possible the recent multi-year low at $13.93. The intraday hourly chart shows the resistance that has now formed near term around $14.70 and this is a great sell-zone now. The near term bearish outlook would be deferred on a move above the $15.19 rebound high. All technicals that I consider are suggesting that further weakness will be seen and that strength is a chance to sell.
EUR/USD
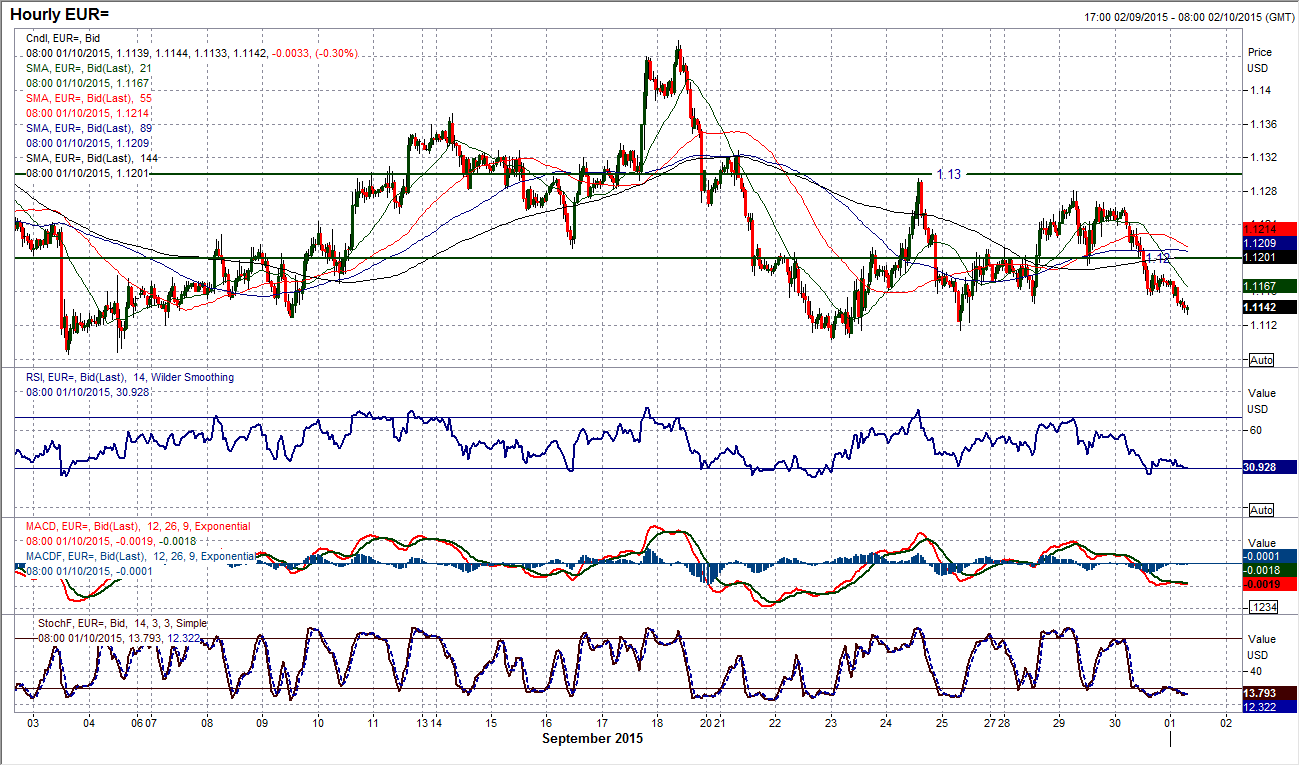
A corrective bearish candle has maintained the near term range that has formed above the $1.1100 key medium term pivot and under the reaction high at $1.1295. But although there may be a dip towards the support, as yet there is no suggestion that the will be any key imminent breakdown. Daily momentum indicators remain rather neutral and although there has been a reaction on the Stochastics, the technicals suggest the outlook is still solid for the support. I spoke yesterday about the playing this near term range between $1.1100/$1.1295 and looking at the hourly momentum indicators for signals and the way they are configured would suggest that this will continue. So with the hourly RSI towards 30 and Stochastics stretched again I am looking for support to come in and for the next potential buy signal today. The economic data will become the main caveat to this view with the PMIs and also Non-farm Payrolls, however ahead of this data the technicals continue to suggest a range play.
GBP/USD
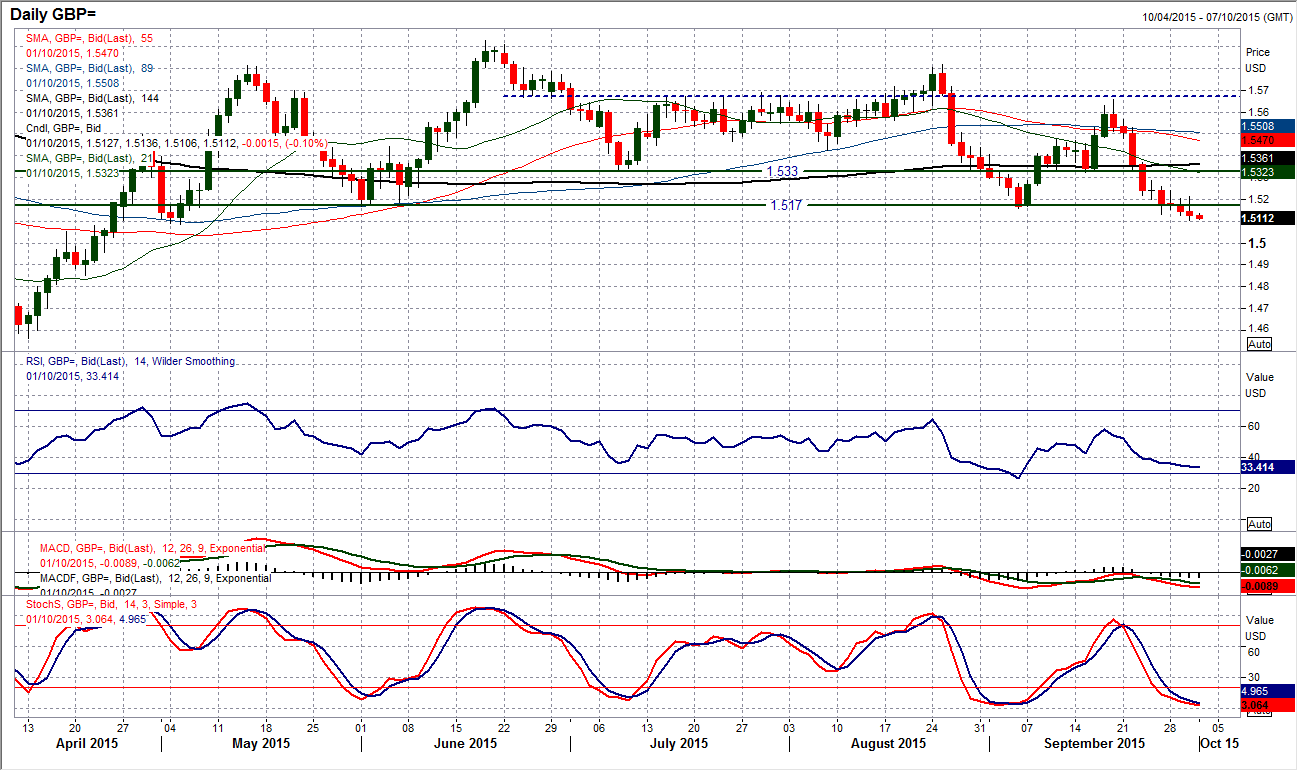
I am torn between two outlooks now. The support at $1.5170 has been broken and with two daily closes below this should be enough now to open the downside. However the momentum indicators really do not reflect the downside impetus associated with a clean break. The RSI has flattened and the daily Stochastics whilst being negative seem to be bottoming too. I am also mindful of yesterday’s candle which also was a ninth consecutive negative closing candle, the day high was above the previous day. I remain unconvinced by this breakdown and feel unwilling to back it. The hourly chart shows the selling pressure has turned into more of a drift and after almost two weeks of consistent declines a bearish drift does not inspire confidence for further downside. The trend is your friend and Cable remains in decline but for how long? Yesterday’s low at $1.5105 is just above the next key low at $1.5088 below which the old pivot at $1.5000. Yesterday’s high at $1.5212 is now the key near term level of resistance.
USD/JPY
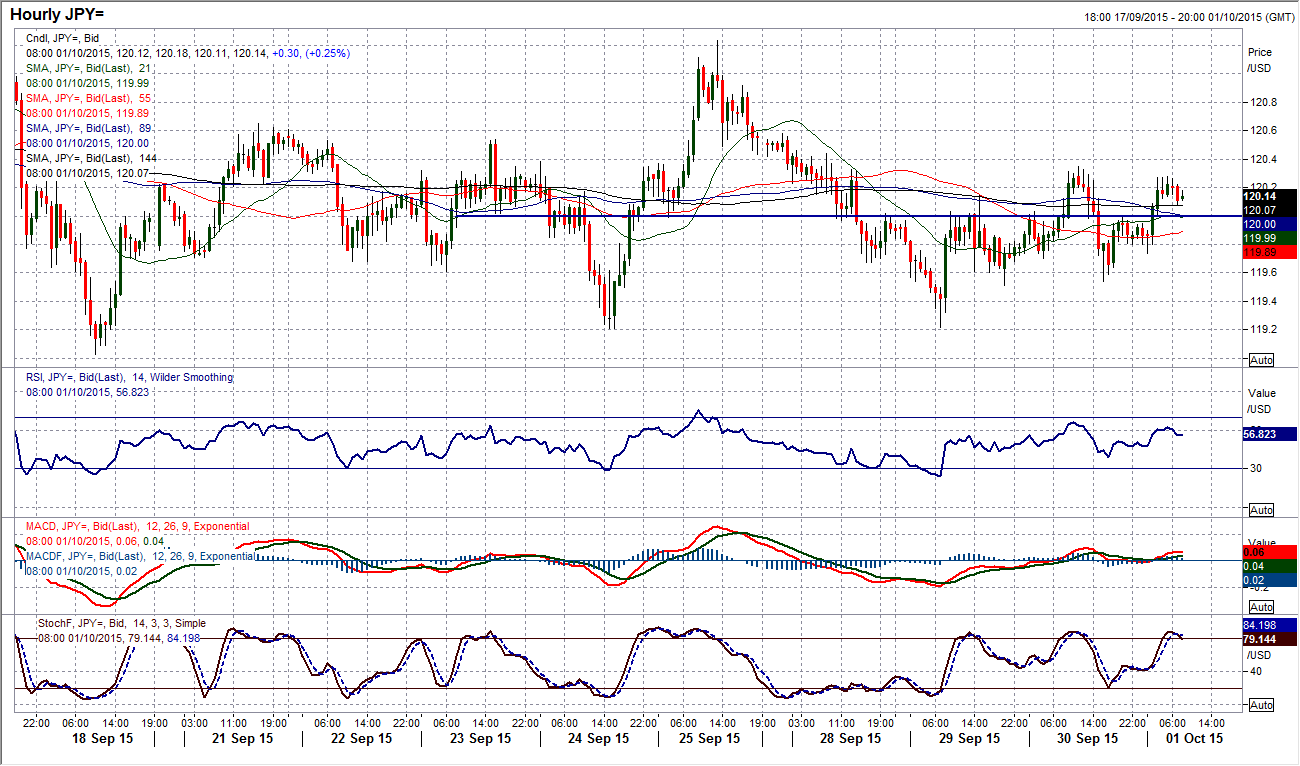
Another day, another turn around in sentiment on Dollar/Yen as this tight range continues. The medium term players must have given up to go on holiday because there is absolutely nothing for them at the moment, you can only profit from this pair by trading with a maximum of a one day outlook at the most. The mixed daily signals continue and I think I will just avoid reading anything into the daily momentum at least until the tighter range between 119.00/121.30 is broken, because there is very little being decisive that can be taken. Near term there is a pivot that seems to have formed around the 120.00 level and I continue to see the hourly RSI as a signal, so looking for the near term short positions when it gets towards 70 and near term longs on a move back towards 30. The hourly Stochastics can also be used as a further confirmation signal. Support near term is at 119.20 with minor resistance at 120.60 before 121.23.
Gold
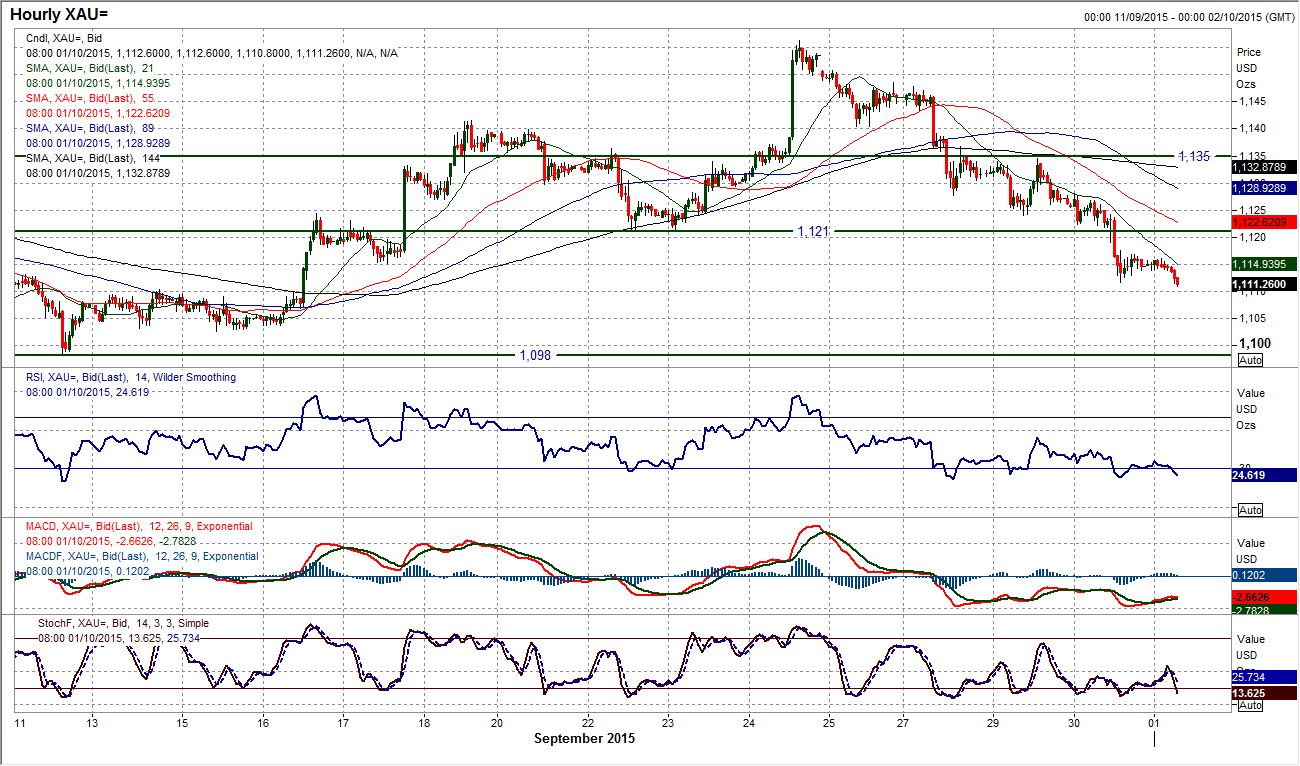
I spoke yesterday about the support at $1121 being a key level near term and with a breakdown it would seem that the outlook is more towards a move back towards $1098 once more. A strong bearish candle with a close below $1121 confirms the deterioration in the chart and this is added to by the declining RSI and decisive fall in the Stochastics. Trading back below a full set of bearish moving averages would also suggest that any rallies are now a chance to sell. This outlook is reflected on the hourly chart which has been falling consistently for the past four days with bearish hourly momentum. The old support at $1121 now becomes a basis of resistance for a rebound today with a band of resistance up towards yesterday’s high at $1127.80. The hourly RSI is shows that in the past few days if a minor rally sets in it is struggling again around the low 50s. There would now need to be a rally back above $1134.50 to abort the near term bear control. I expect further pressure on yesterday’s low at $1111.60 before further weakness towards the key low at $1098.
WTI Oil
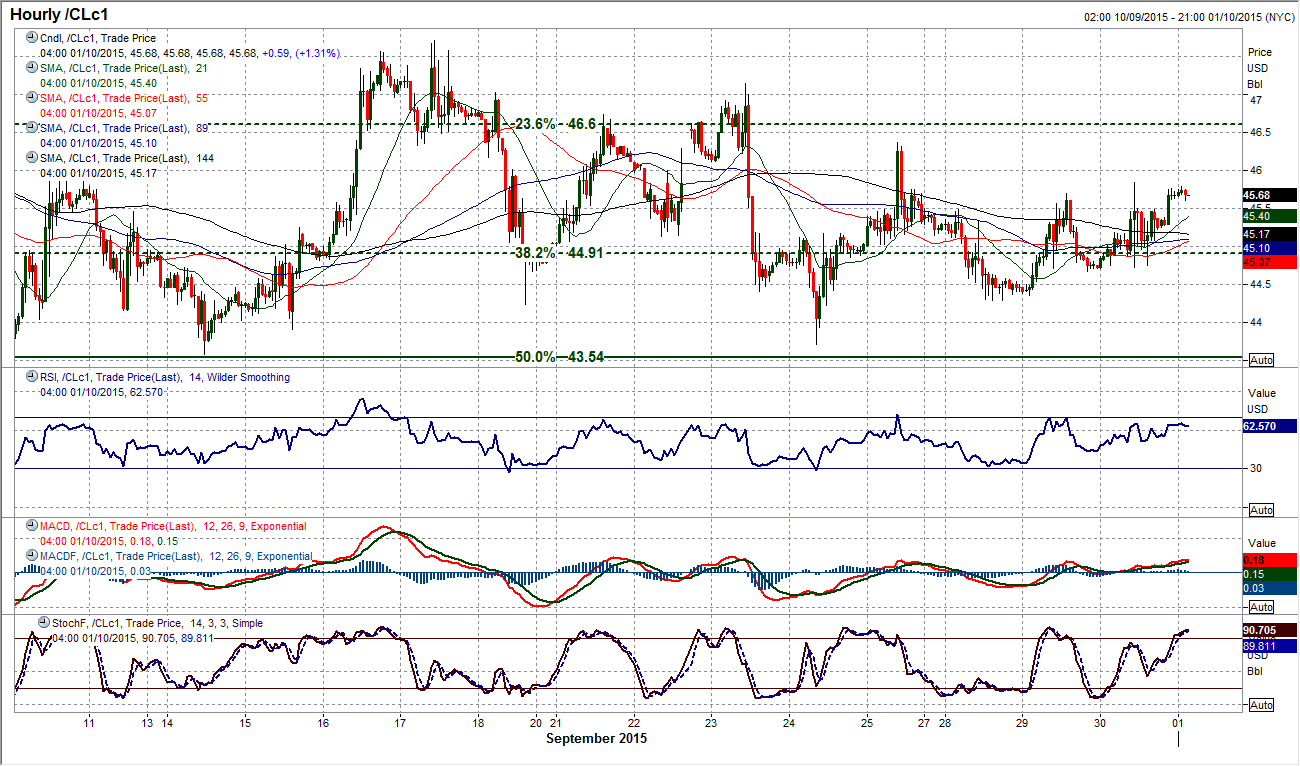
There is still an outlook of consolidation to WTI and now it appears as though the daily volatility in the traded high/low range also seems to be becoming less significant. Perhaps the market is consolidating in front of the key data in the next two days but (whisper it quietly) there is a degree of calm that has come over the oil price recently. The daily momentum indicators are rather benign with the RSI and MACD lines flat and even the Stochastics having also settled. On the intraday hourly chart there is an element of converging trendlines now with higher lows having formed at $43.70 and $44.30, whilst the resistance at $46.40 also remains intact after the peak of yesterday’s high at $45.85, although a drift higher early today could see it tested. However, the price of WTI seems to be awaiting the next catalyst.
Note: All information on this page is subject to change. The use of this website constitutes acceptance of our user agreement. Please read our privacy policy and legal disclaimer. Opinions expressed at FXstreet.com are those of the individual authors and do not necessarily represent the opinion of FXstreet.com or its management. Risk Disclosure: Trading foreign exchange on margin carries a high level of risk, and may not be suitable for all investors. The high degree of leverage can work against you as well as for you. Before deciding to invest in foreign exchange you should carefully consider your investment objectives, level of experience, and risk appetite. The possibility exists that you could sustain a loss of some or all of your initial investment and therefore you should not invest money that you cannot afford to lose. You should be aware of all the risks associated with foreign exchange trading, and seek advice from an independent financial advisor if you have any doubts.
Recommended Content
Editors’ Picks
EUR/USD rises toward 1.0700 after Germany and EU PMI data

EUR/USD gains traction and rises toward 1.0700 in the European session on Monday. HCOB Composite PMI data from Germany and the Eurozone came in better than expected, providing a boost to the Euro. Focus shifts US PMI readings.
GBP/USD holds above 1.2350 after UK PMIs

GBP/USD clings to modest daily gains above 1.2350 in the European session on Tuesday. The data from the UK showed that the private sector continued to grow at an accelerating pace in April, helping Pound Sterling gather strength.
Gold price flirts with $2,300 amid receding safe-haven demand, reduced Fed rate cut bets

Gold price (XAU/USD) remains under heavy selling pressure for the second straight day on Tuesday and languishes near its lowest level in over two weeks, around the $2,300 mark heading into the European session.
Here’s why Ondo price hit new ATH amid bearish market outlook Premium

Ondo price shows no signs of slowing down after setting up an all-time high (ATH) at $1.05 on March 31. This development is likely to be followed by a correction and ATH but not necessarily in that order.
US S&P Global PMIs Preview: Economic expansion set to keep momentum in April

S&P Global Manufacturing PMI and Services PMI are both expected to come in at 52 in April’s flash estimate, highlighting an ongoing expansion in the private sector’s economic activity.
