Market Overview
The attention will turn back towards Greece again with the US taking its Independence Day public holiday. However the market is still digesting what was a rather disappointing Non-farm Payrolls report yesterday which has posed serious questions over the viability of a September rate hike now. This has stunted the confidence of the dollar bulls and put markets into a state of flux once more. The focus will now shift to the Greek referendum which will be held on Sunday. The IMF has also through the cat amongst the pigeons for the creditors with the publishing of a report that suggests the Greeks need a further bailout and also a restructuring of its debt obligations. This plays into the hands of Greek Prime Minister Tsipras who has been urging his country to vote “No” in the election which is over whether to accept the bailout proposals (incidentally for a bailout that no longer exists).
Markets have been fairly cautious to the reaction of the payrolls report and the upcoming Greek referendum, with Wall Street closing all but flat overnight and markets in Asia also broadly flat (apart from China which continues to swing with wild volatility on a daily and sometimes intraday basis). European markets have opened in cautious mode on a day where the US is shut for Independence Day.
Forex markets are mixed coming into European trading with little real direction after the Payrolls report curtailed the bull run for the dollar yesterday. The gold price has also found some support too.
Traders will be looking at the services PMIs across the Eurozone very early in the session, whilst the UK data is at 0930BST and is expected to pick up to 57.4 from the sharp dip to 56.5 that was seen last month.
Chart of the Day – EUR/JPY
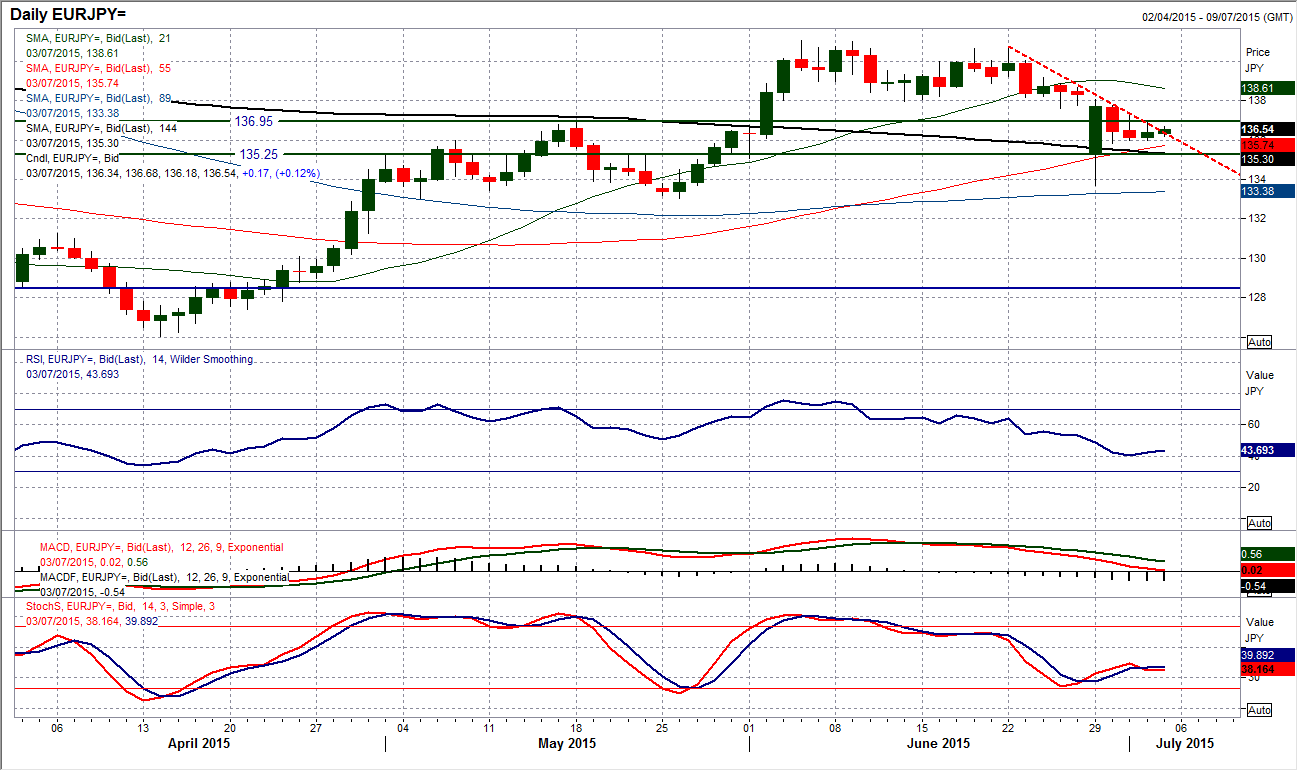
Euro/Yen has been in correction mode in the past couple of weeks now however could this be about to change. The hugely volatile candle of Monday somewhat distracts from a fairly orderly downtrend which has dragged the pair back into the support band 135.25/137.00. This has allowed the momentum indicators to unwind and for now could be a set up which allows a chance to buy. I have been looking at the intraday hourly chart which is today putting consistent pressure on the downtrend that has been in place since 22nd June. The hourly momentum indicators have recently been far more neutral in configuration and suggest the support forming at 136.00 (which is a historic level) is viable. First of all watch for a break back above 137.00 which not only is a near term resistance but is also the old breakout resistance on the daily chart. It would be good if this move was also confirmed by a tick high on the hourly RSI consistently above 60. This is a chart that could be set for a change of tack once more, for now though we must wait and see.
EUR/USD
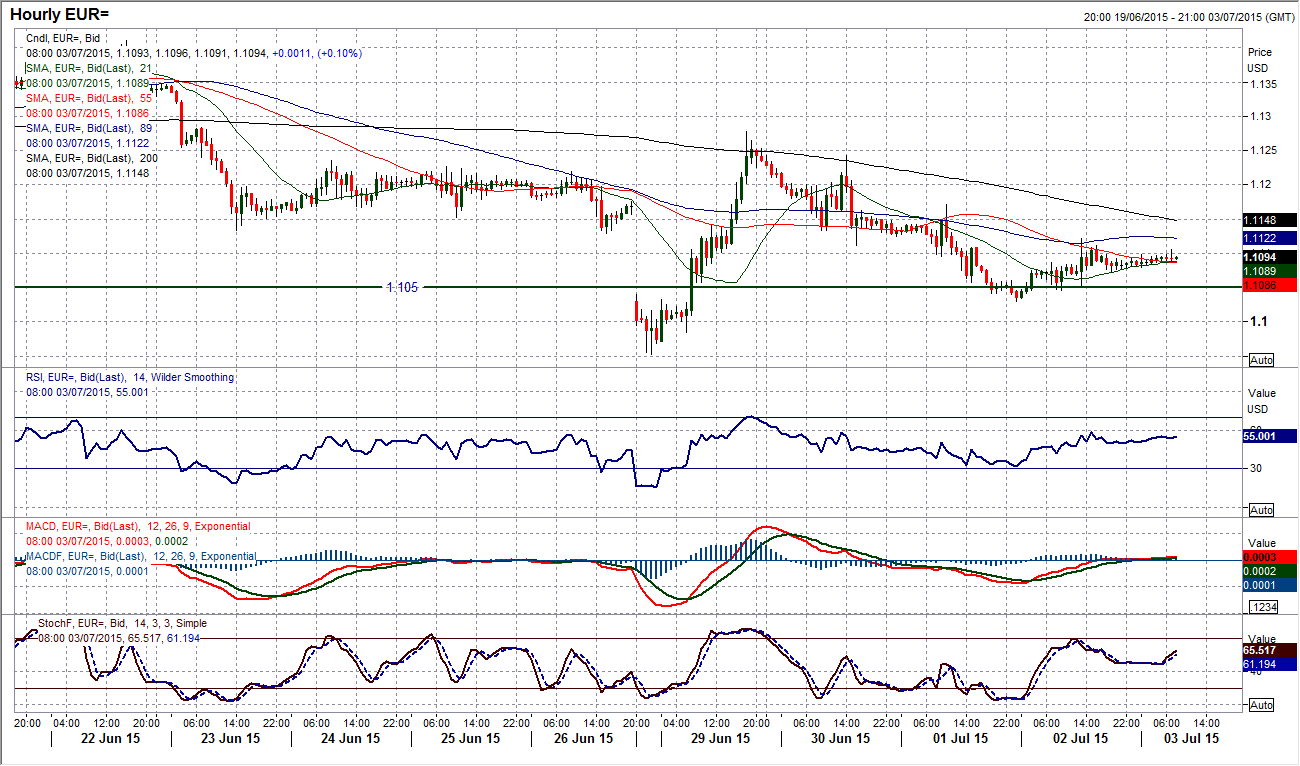
There is a real test of outlook in process. The euro had been coming under pressure as the dollar bulls were gaining control, but this move has temporarily at least been stopped in its tracks. We are now in a state on consolidation once more as the price for the past couple of days has traded sideways. That is not to say that there has been no volatility in that time though (the disappointing Non-farm Payrolls report saw to that), but still the consolidation is coming around the key pivot level at $1.1050. I have been saying about the importance of this pivot for a while and whilst the euro continues to trade above it, on a medium term basis the outlook remains positive. The dip low may come in at $1.1030 but the support has built around $1.1030 in the last two days. The momentum indicators are very much in a neutral configuration now, although with the RSI under 50 and Stochastics remaining around the lower bounds there is a slightly corrective slant still. However the intraday hourly chart shows an increasingly neutral near term stance. I would expect this may continue through today with the uncertainty of the Greek referendum. Initial resistance comes in at $1.1170 before the main near term resistance at $1.1278.
GBP/USD
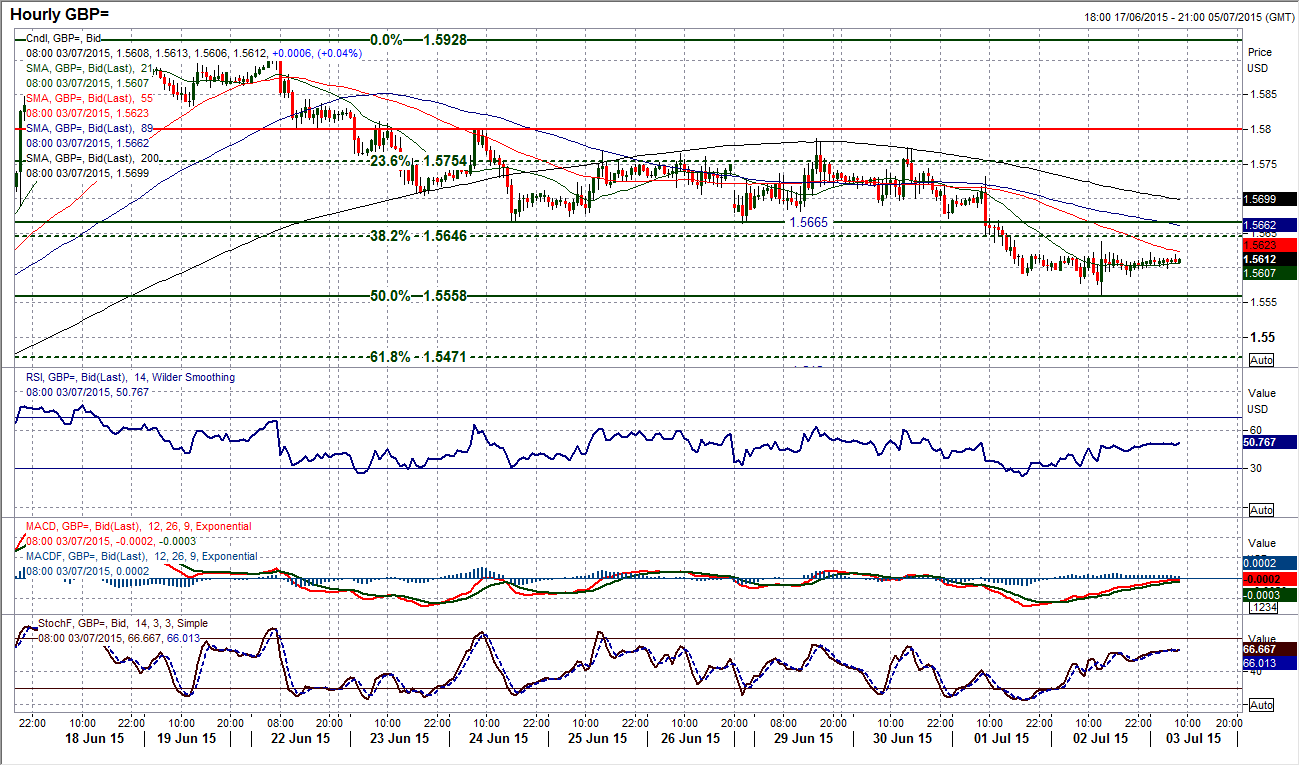
The corrective drift that came with the break below $1.5665 implies $1.5535. Yesterday’s dip did not quite reach there before an intraday rally (on the back of the disappointing payrolls report) just halted the decline at $1.5560. For now there is little reason on the momentum indicators why this should be any more than a minor near term bounce that will again be sold into by the near term bears. The daily chart shows the momentum indicators still in corrective mode, led by the Stochastics. The hourly chart shows a consolidation (and a bull key one hour reversal with the payrolls data yesterday), but the buyers have yet to materialise. I see this more of a move to unwind any oversold intraday momentum and should result in further downside in due course. There is a band of resistance $1.5640/$1.5680 which is the initial barrier. I still expect $1.5560 to be retested.
USD/JPY
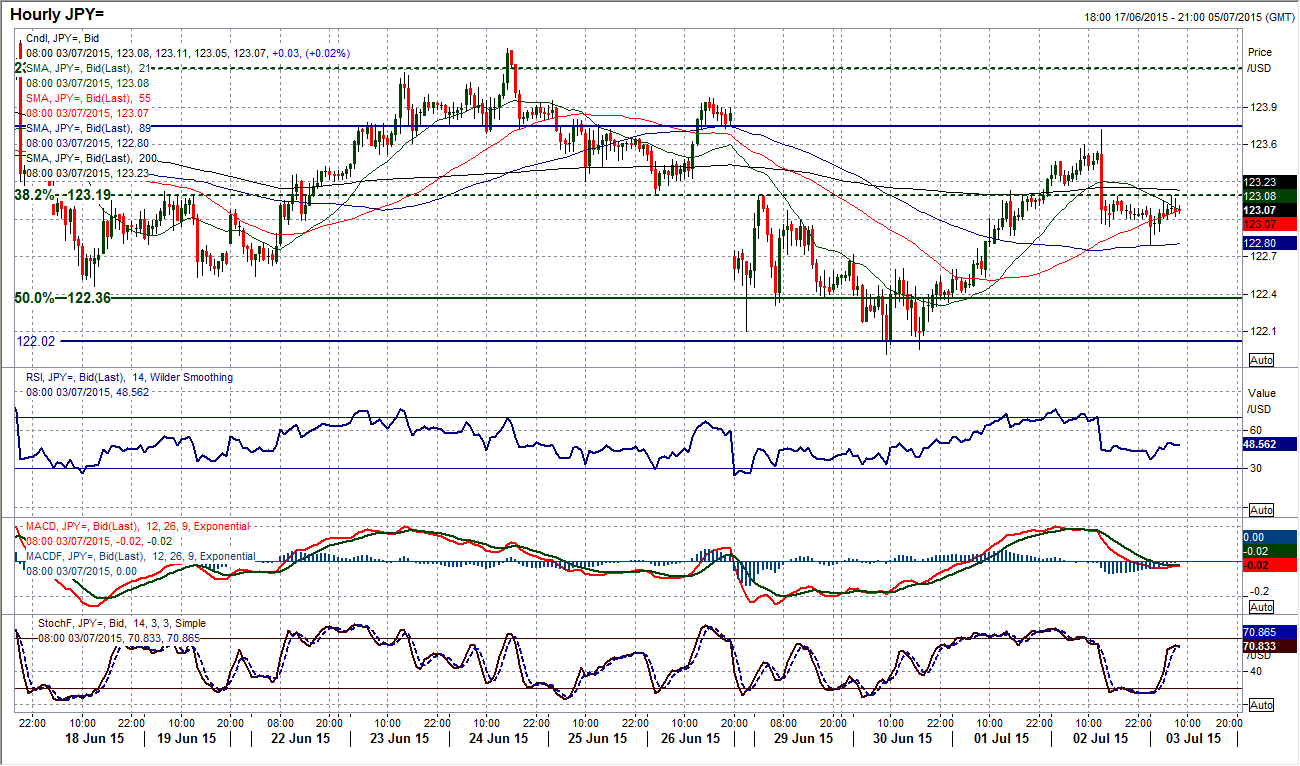
The battle for control of the near term outlook continues as a bearish candle (in the mould of a shooting star) reversed the gains of early yesterday to once more clip the wings of the buyers. However today’s follow up candle now becomes key. There was not a great deal of bull run to stage a reversal pattern like a shooting star so I see this as more of as part of a choppy range play move rather than an outright sell signal. If today’s candle is more of a consolidation move then it appears unlikely that any real selling pressure will be imminent. The intraday hourly chart continues to be dominated by price pivots and Fibonacci levels. The peak move yesterday came at 123.72 which is around an old resistance level within the range, whilst I remain very interested in the 123.20 Fibonacci level which is 38.2% of the 118.86/125.85 rally. This is a key pivot level within the range and can be traded around near term. The hourly momentum indicators have unwound to neutral and it looks as though Dollar/Yen is looking for its next catalyst.
Gold
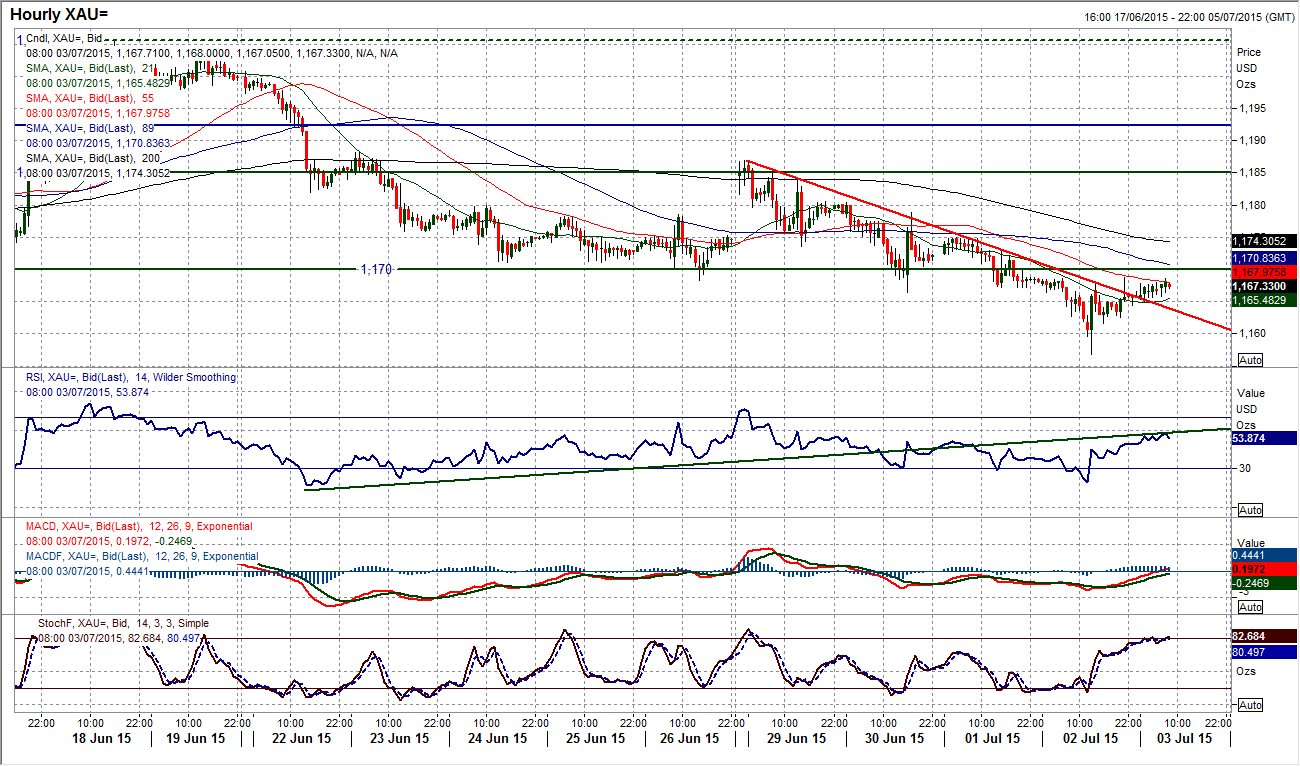
Yesterday’s sell-off and breach of key support at $1162.35 was an important move, but the intraday rebound which saw the gold price closing well of the day lows, leaves us with some uncertainty. For some time I have seen gold as a rangeplay with a bearish drift that has meant the need to constantly reassess the support levels. The momentum indicators are corrective without looking strongly bearish (RSI has not been below 35 since mid-March). So this leaves me reticent over running short positions for too long as the gold price is still prone to near term sharp rallies. The intraday hourly chart hints at perhaps the latest move as a bullish key one hour reversal (or bullish engulfing candle) has induced a move that means the downtrend built up over the past four days is now being broken. The momentum indicators are unwinding and now a near term test of the resistance of the old support at $1168 is underway. A move into the low $1170s could signal another potential near term rebound, with a move above $1175 resistance certainly suggesting a rally is on. The sellers have got some work to do to continue this bear run in its current form. A move back below $1161 intraday support would re-open yesterday’s low at $1156.90 and also the key March low at $1142.90.
WTI Oil
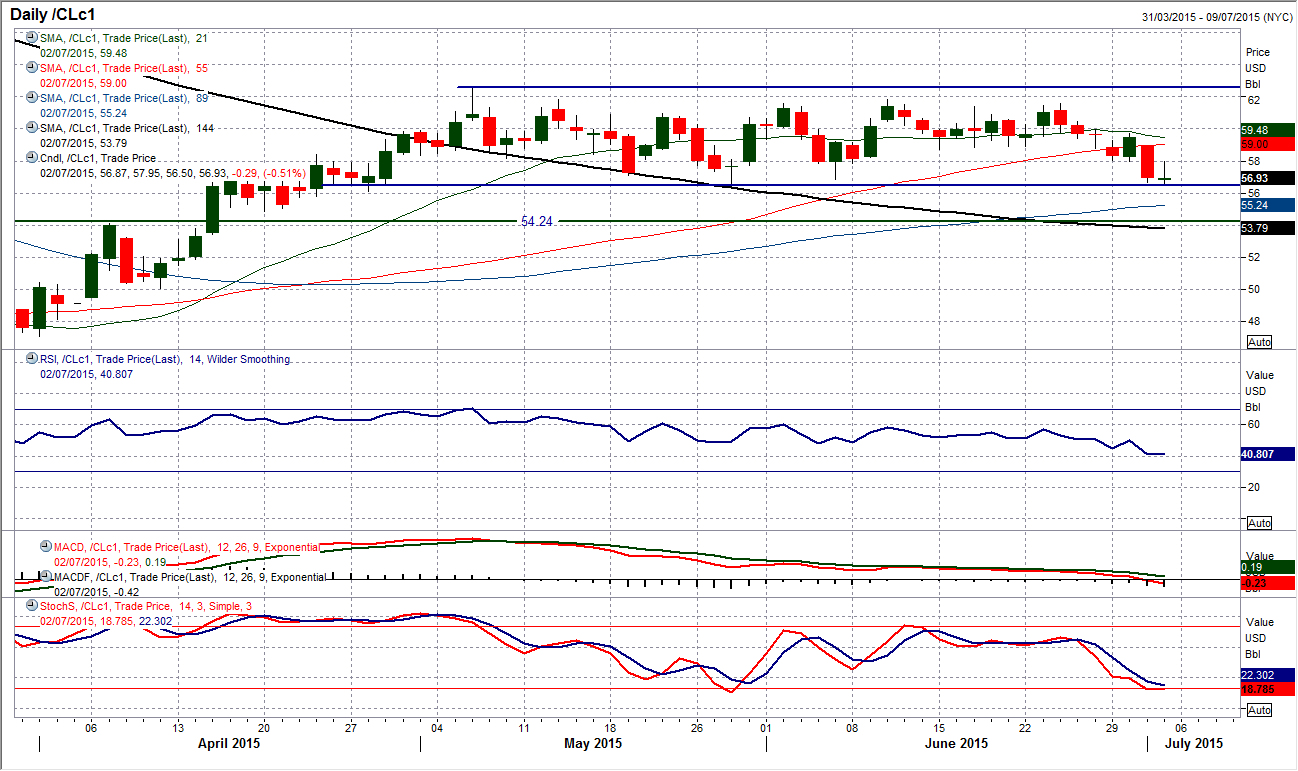
The support at the bottom of the 10 week range is being severely tested once again, although for now the buyers have held the price up at the key level. There is now a very real threat of a bearish breakdown although the resilience of the bulls in the past couple of days is commendable. However, the daily momentum indicators retain a corrective outlook and there is still much to do to prevent further downside pressure. Looking at the intraday hourly chart the test of support was fairly considerable in the past two days, and the bulls have failed to breach the resistance at $58.00 and this is a significant concern now. The hourly momentum indicators are still in a corrective configuration and the bear pressure continues. A breach of $56.50 will open the support at $55.00 and more likely a move back to the old neckline of the base pattern at $54.24. A move above resistance around $59.00 would be needed to signal of a bull recovery within the range.
Note: All information on this page is subject to change. The use of this website constitutes acceptance of our user agreement. Please read our privacy policy and legal disclaimer. Opinions expressed at FXstreet.com are those of the individual authors and do not necessarily represent the opinion of FXstreet.com or its management. Risk Disclosure: Trading foreign exchange on margin carries a high level of risk, and may not be suitable for all investors. The high degree of leverage can work against you as well as for you. Before deciding to invest in foreign exchange you should carefully consider your investment objectives, level of experience, and risk appetite. The possibility exists that you could sustain a loss of some or all of your initial investment and therefore you should not invest money that you cannot afford to lose. You should be aware of all the risks associated with foreign exchange trading, and seek advice from an independent financial advisor if you have any doubts.
Recommended Content
Editors’ Picks
EUR/USD holds gains above 1.0700, as key US data loom

EUR/USD holds gains above 1.0700 in the European session on Thursday. Renewed US Dollar weakness offsets the risk-off market environment, supporting the pair ahead of the key US GDP and PCE inflation data.
GBP/USD extends recovery above 1.2500, awaits US GDP data

GBP/USD is catching a fresh bid wave, rising above 1.2500 in European trading on Thursday. The US Dollar resumes its corrective downside, as traders resort to repositioning ahead of the high-impact US advance GDP data for the first quarter.
Gold price edges higher amid weaker USD and softer risk tone, focus remains on US GDP

Gold price (XAU/USD) attracts some dip-buying in the vicinity of the $2,300 mark on Thursday and for now, seems to have snapped a three-day losing streak, though the upside potential seems limited.
XRP extends its decline, crypto experts comment on Ripple stablecoin and benefits for XRP Ledger

Ripple extends decline to $0.52 on Thursday, wipes out weekly gains. Crypto expert asks Ripple CTO how the stablecoin will benefit the XRP Ledger and native token XRP.
US Q1 GDP Preview: Economic growth set to remain firm in, albeit easing from Q4

The United States Gross Domestic Product (GDP) is seen expanding at an annualized rate of 2.5% in Q1. The current resilience of the US economy bolsters the case for a soft landing.
