Market Overview
There are a number of conflicting factors at play in financial markets at the moment which means that decision making is becoming increasingly tough. Greece as yet remains unable to resolve its negotiations with the Eurozone to any acceptable degree and the talks over its economic reform package continues to drag. The attention for the market will quickly turn towards the Federal Reserve which is meeting again this week though which will have a significant bearing on currency markets at least.
Wall Street closed at record highs on Friday with the S&P 500 up 0.2% at 2117. It is interesting that volatility continues to fall away with the VIX Index around 12 and the lowest since December. Asian markets were mixed on Monday with little real drivers and apparent caution ahead of not only the Fed this week but also the Bank of Japan is meeting. European markets are also a touch cautious on Monday and are trading mixed in early moves. In forex trading, there is no real trend yet across the majors, with the dollar making gains against the euro, sterling and yen, whilst is performing less well against the commodity currencies. In commodities, the oil price is slightly lighter whilst the precious metals are showing marginal gains.
There is little economic data due today.
Chart of the Day – EUR/GBP
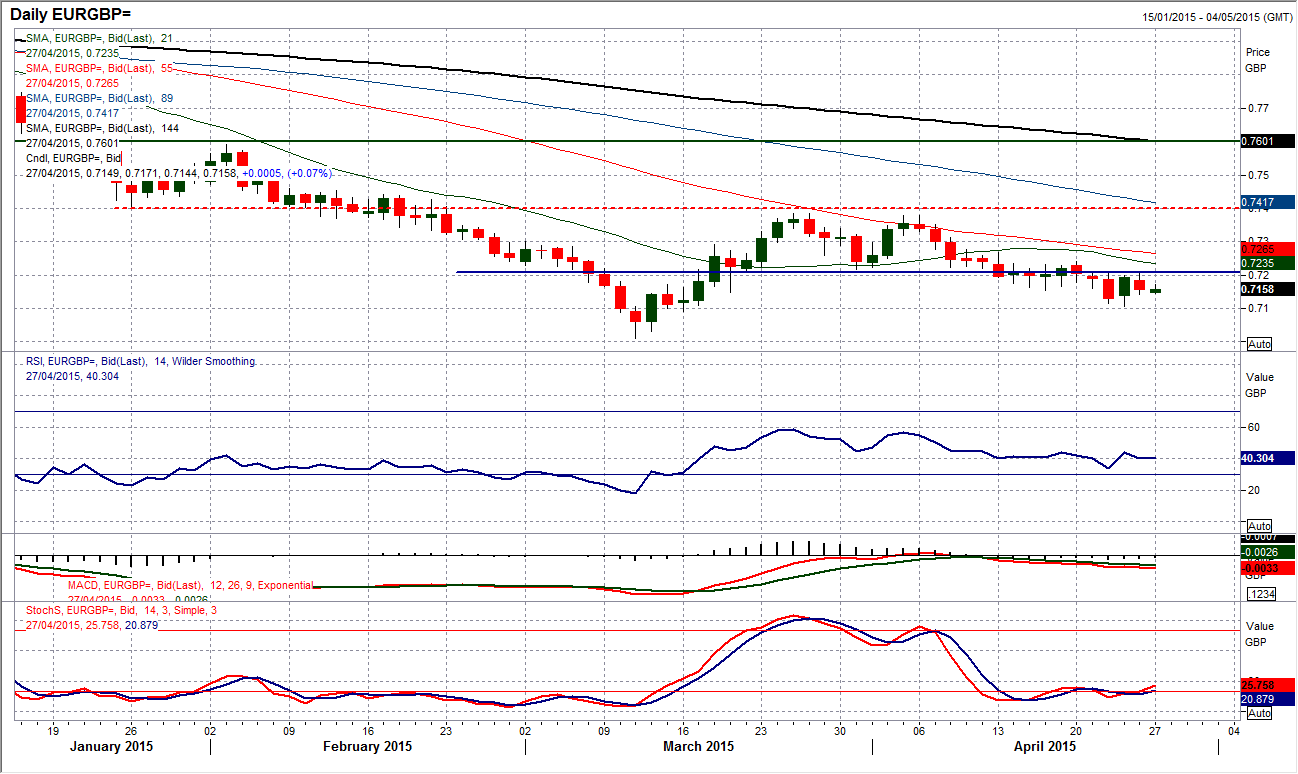
The outlook has been under pressure for the past couple of weeks since the support at £0.7220 was broken which completed a small double top pattern which implies a move back towards the key March low at £0.7010. The old support at £0.7220 has now turned into new resistance, with three of the last four trading sessions finding the sellers returning just under that resistance. The medium to longer term outlook remains negative with all moving averages falling and momentum indicators in bearish configuration. There certainly seems to be resistance now in place under the rally high from last week at £0.7240 which would suggest that rallies are falling over at lower levels and should be seen as a chance to sell. The intraday hourly chart shows that there is a band of near term resistance now between £0.7170/£0.7200. I expect further pressure on the recent low at £0.7105 before £0.7010 is tested in due course.
EUR/USD
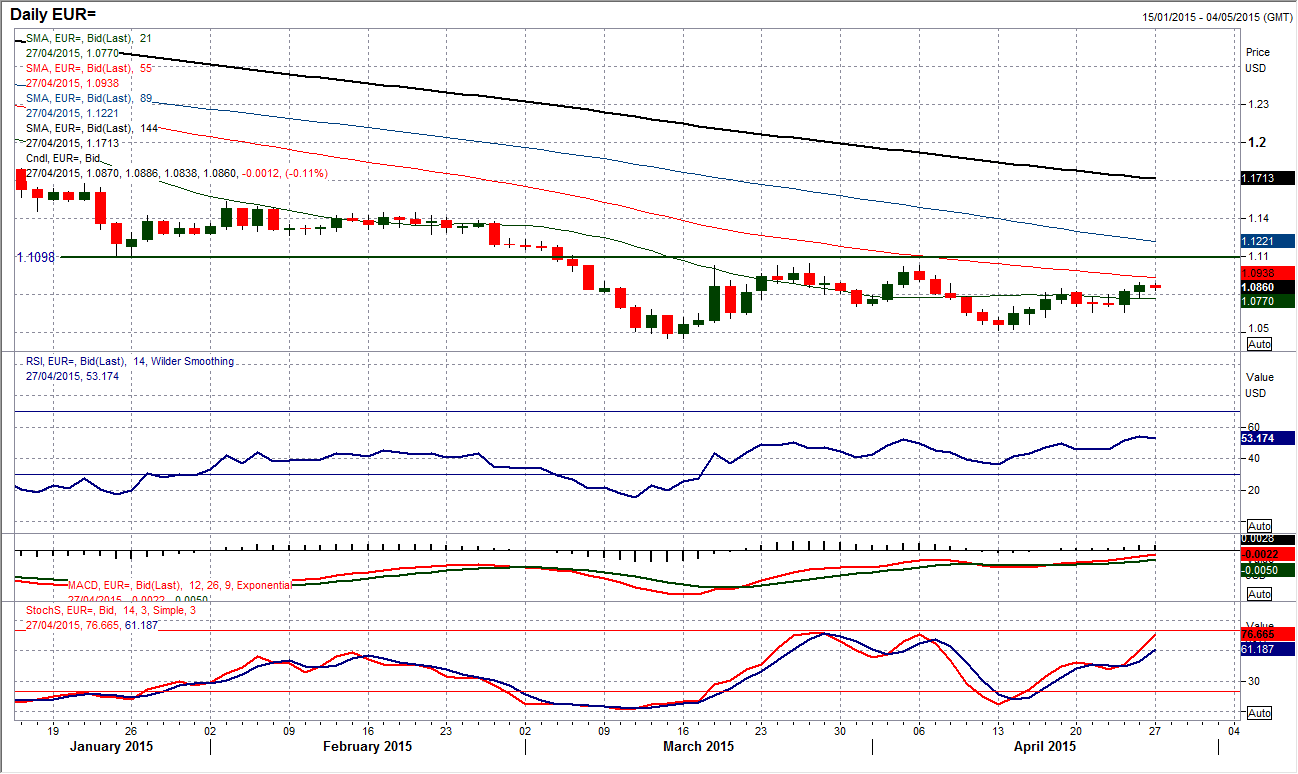
The outlook has picked up in the past few days, with the bullish outside day posted last Thursday. This has tuned the near term outlook within the consolidation more positive and meant that the bulls are now looking to test resistance levels again. There is still much that needs to happen to suggest that the bulls are grabbing control on a medium term basis though, with the reaction highs at $1.1050 still the big barrier, but with near term momentum improving there is an element of positivity that has just started to creep in. The hourly chart suggests that the pivot levels at $1.0800 and $1.0900 still have a role to play and a move above $1.0900 would now re-open the key resistance $1.1035/50 again. The support the bulls need to work from is now in at $1.0775/$1.0800.
GBP/USD
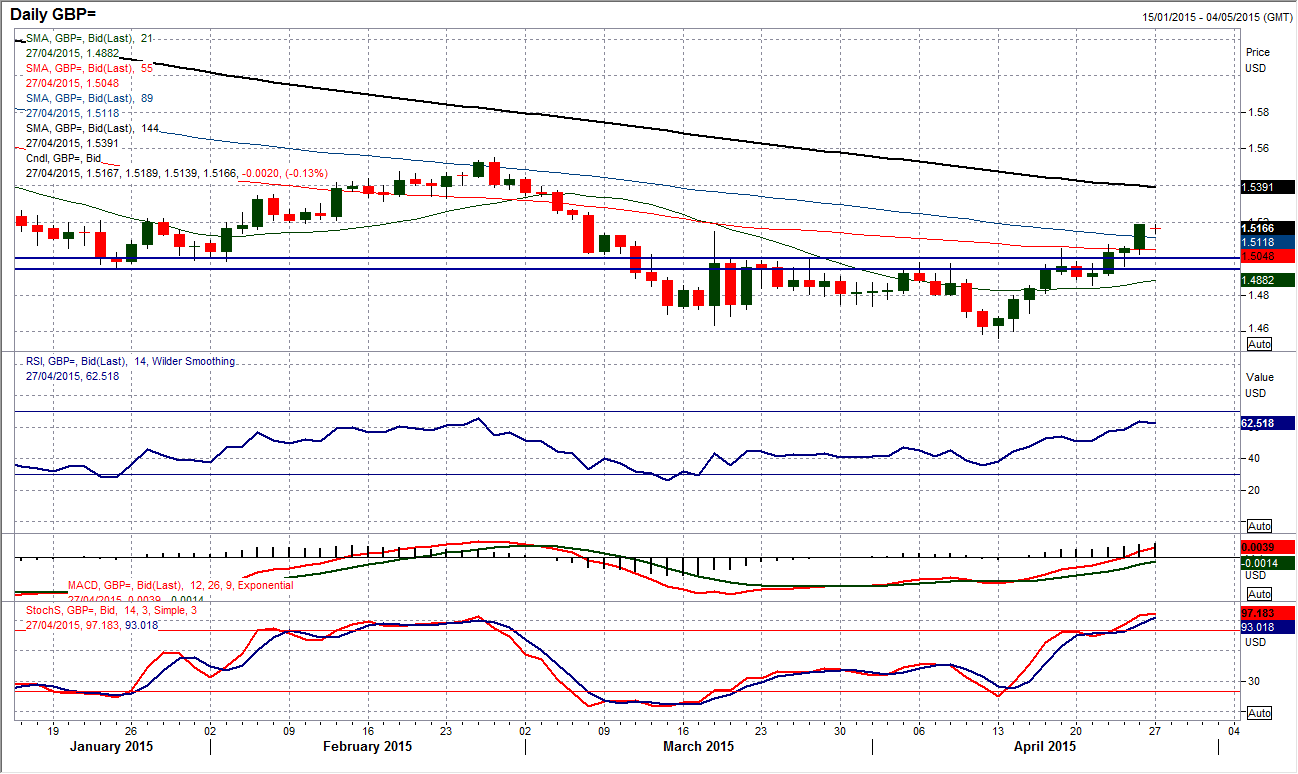
There has been a significant change in the outlook on Cable in the past few days. With the closing break above $1.5000 the near term bulls are in control and there is an upside breakout target from a 100% Fibonacci projection of $1.4563/$1.5053 measured from $1.4850 that comes in at $5340. That would put Cable on course for a test of the crucial $1.5552 February high and then we could start to talk about some serious medium term improvement. The strength of the run in the past few days is impressive and the bulls would now look to use the breakout support at $1.5053 as a level of support to work from. The near/medium term recovery would still be intact while support forms above the old highs $1.4970/$1.5000. The hourly chart shows that buying into weakness is now the near term strategy.
USD/JPY
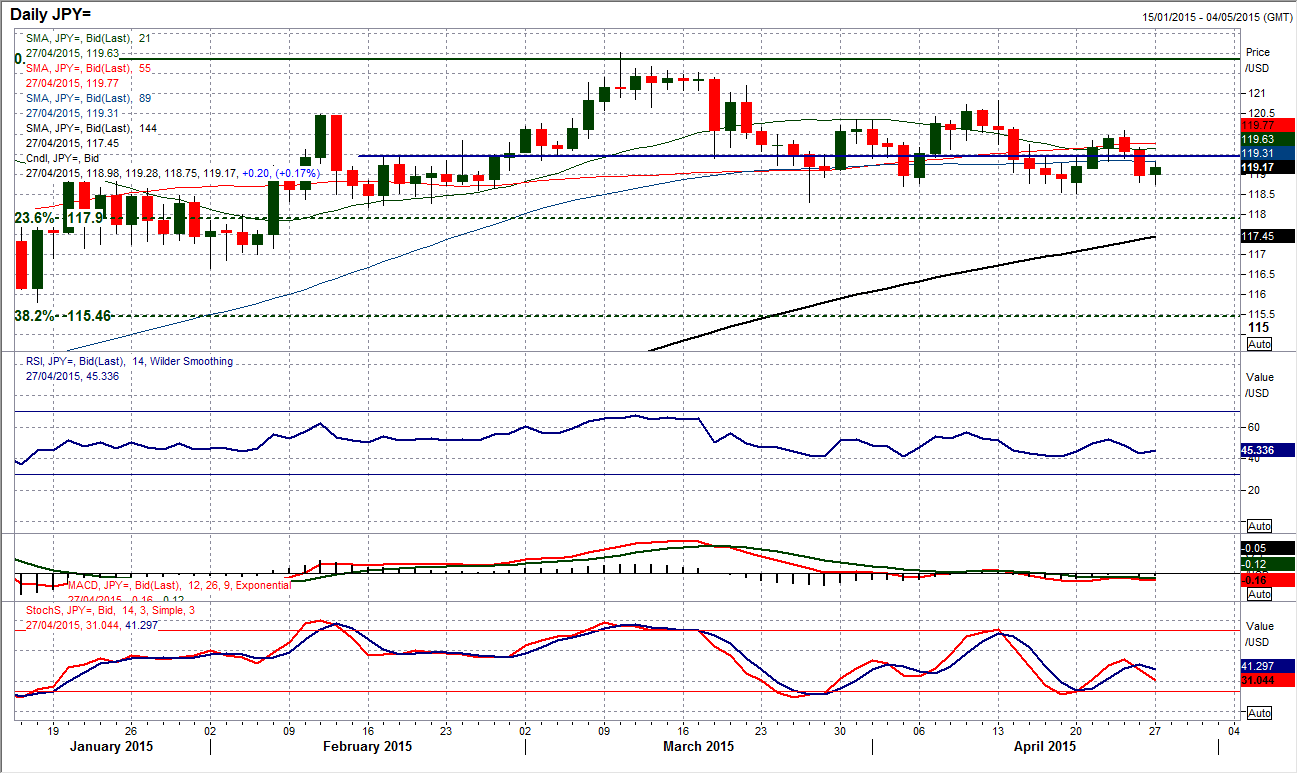
The range play on Dollar/Yen continues however the pressure is beginning to mount on the key support at 118.30 once more. The indicators on the daily chart have turned more corrective within the range once more, but as yet there is nothing overly decisive to be concerned with. The intraday hourly chart suggests that the pair has simply turned lower in the next part of the wave within the range. Dollar/Yen has consistently done this over the past few weeks, where for a few days the pair will look to move consistently in one direction before retracing the move. The latest part of the wave is to the downside, but there is little sign that this move will be sustainable. There would certainly need to be a decisive break of 118.30 which would then open 116.65, however, for now I continue to expect Dollar/Yen to play the range.
Gold
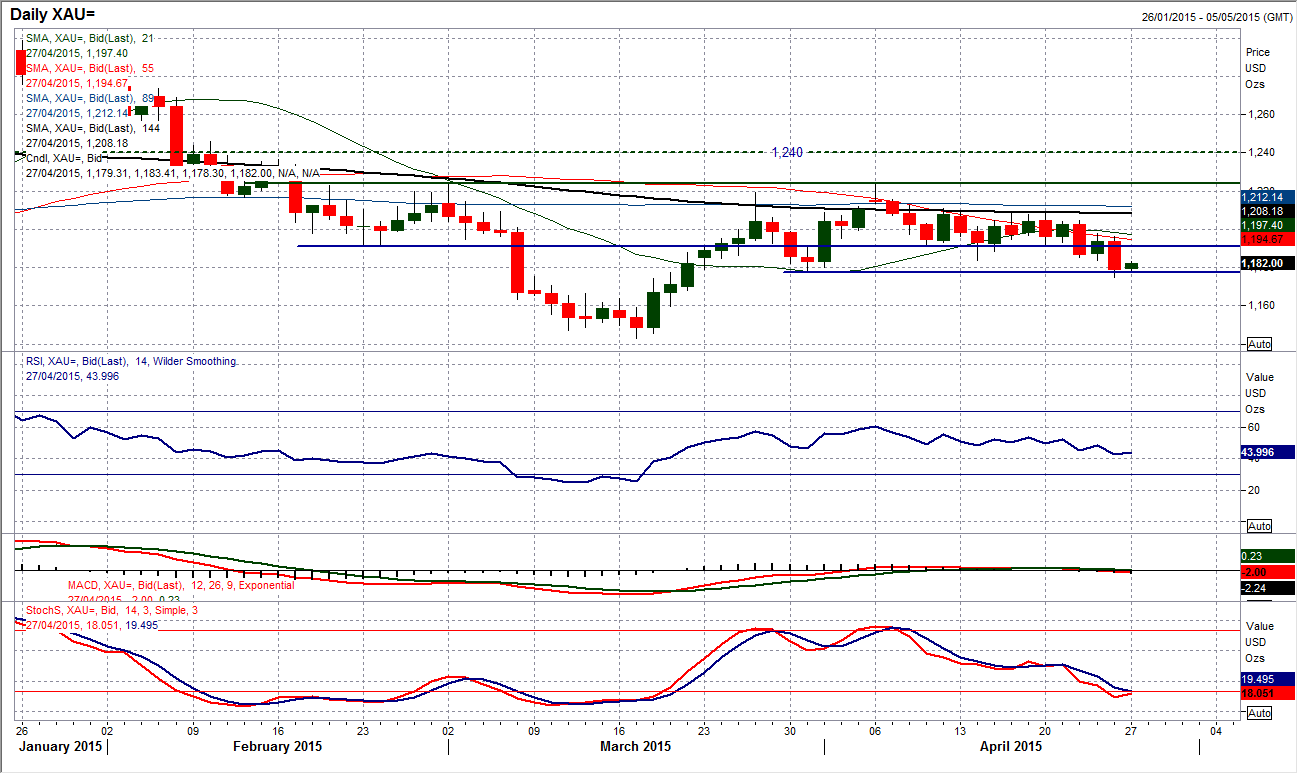
The outlook for gold is under pressure after a strong decline on Friday posted a bearish candle that is putting significant pressure on the bottom of the range that has built up over the past few weeks. The support at $1178 was breached on an intraday basis but the close just above the support suggests the move has not been confirmed (whilst the further bounce today adds to this view. The momentum has deteriorated slightly in the past few days without turning sharply negative, although the Stochastics turning negative is a concern as it suggests that there is a build-up of selling pressure. The intraday hourly chart is interesting as the rally overnight in the Asian session has dragged the price back to the resistance of the previous support at $1183.70 which is now an area of resistance. The last few days has seen a sequence of lower highs being formed with hourly RSI and MACD taking on a more bearish configuration. This would suggest that using this rally to sell is now the option. The resistance of the previous highs comes in at $1196/$1198.
WTI Oil
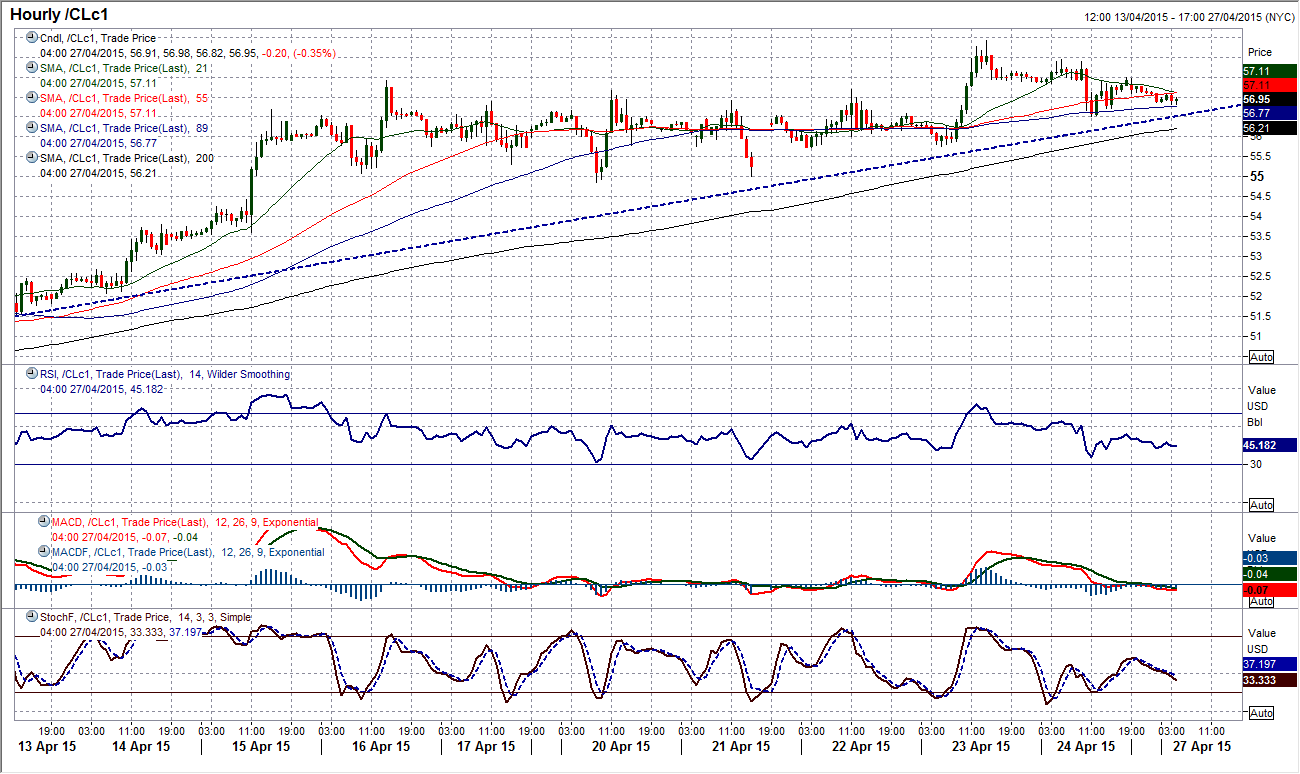
The bulls are hanging on to the breakout and will be gaining in confidence with every day that the oil price remains steadily above the breakout above the old key resistance at $54.24. The daily momentum indicators remain positive with the RSI settling in the 60s, whilst the Stochastics and MACD remain in positive configuration. If this breakout is to constitute the potential for a new uptrend, then watch out for the rising 21 day moving average to provide the basis of support (currently $53.20). The intraday chart is gradually improving and is now beginning to leave supports. Initial support is now at $55.75 before the key near term level at $54.85.
Note: All information on this page is subject to change. The use of this website constitutes acceptance of our user agreement. Please read our privacy policy and legal disclaimer. Opinions expressed at FXstreet.com are those of the individual authors and do not necessarily represent the opinion of FXstreet.com or its management. Risk Disclosure: Trading foreign exchange on margin carries a high level of risk, and may not be suitable for all investors. The high degree of leverage can work against you as well as for you. Before deciding to invest in foreign exchange you should carefully consider your investment objectives, level of experience, and risk appetite. The possibility exists that you could sustain a loss of some or all of your initial investment and therefore you should not invest money that you cannot afford to lose. You should be aware of all the risks associated with foreign exchange trading, and seek advice from an independent financial advisor if you have any doubts.
Recommended Content
Editors’ Picks
EUR/USD fluctuates near 1.0700 after US data

EUR/USD stays in a consolidation phase at around 1.0700 in the American session on Wednesday. The data from the US showed a strong increase in Durable Goods Orders, supporting the USD and making it difficult for the pair to gain traction.
USD/JPY refreshes 34-year high, attacks 155.00 as intervention risks loom

USD/JPY is renewing a multi-decade high, closing in on 155.00. Traders turn cautious on heightened risks of Japan's FX intervention. Broad US Dollar rebound aids the upside in the major. US Durable Goods data are next on tap.
Gold stays in consolidation above $2,300

Gold finds it difficult to stage a rebound midweek following Monday's sharp decline but manages to hold above $2,300. The benchmark 10-year US Treasury bond yield stays in the green above 4.6% after US data, not allowing the pair to turn north.
Worldcoin looks set for comeback despite Nvidia’s 22% crash Premium

Worldcoin price is in a better position than last week's and shows signs of a potential comeback. This development occurs amid the sharp decline in the valuation of the popular GPU manufacturer Nvidia.
Three fundamentals for the week: US GDP, BoJ and the Fed's favorite inflation gauge stand out Premium

While it is hard to predict when geopolitical news erupts, the level of tension is lower – allowing for key data to have its say. This week's US figures are set to shape the Federal Reserve's decision next week – and the Bank of Japan may struggle to halt the Yen's deterioration.
