Market Overview
The EU leaders summit at the end of last week was the latest chance for Greece to provide clarity on its progress towards meeting the measures set out as part of its bailout extension. However, there is still a sense that they are not forthcoming with enough detail, which could put Alexis Tsipras on a collision course with Angela Merkel today and this would have the potential to cause volatility. The markets are still coming to terms with the actions of the Federal Reserve this week and the volatility in the US dollar has been elevated. Again there is little to really drive the financial markets today so there will be a continued dissection of the moves last week. Wall Street closed in strong fashion last Friday with the S&P 500 up 0.9% on the day. Asian markets have followed this lead, with the Nikkei up 1.0%. European markets are mixed to slightly lower but the FTSE 100 continues to trade above 7000.
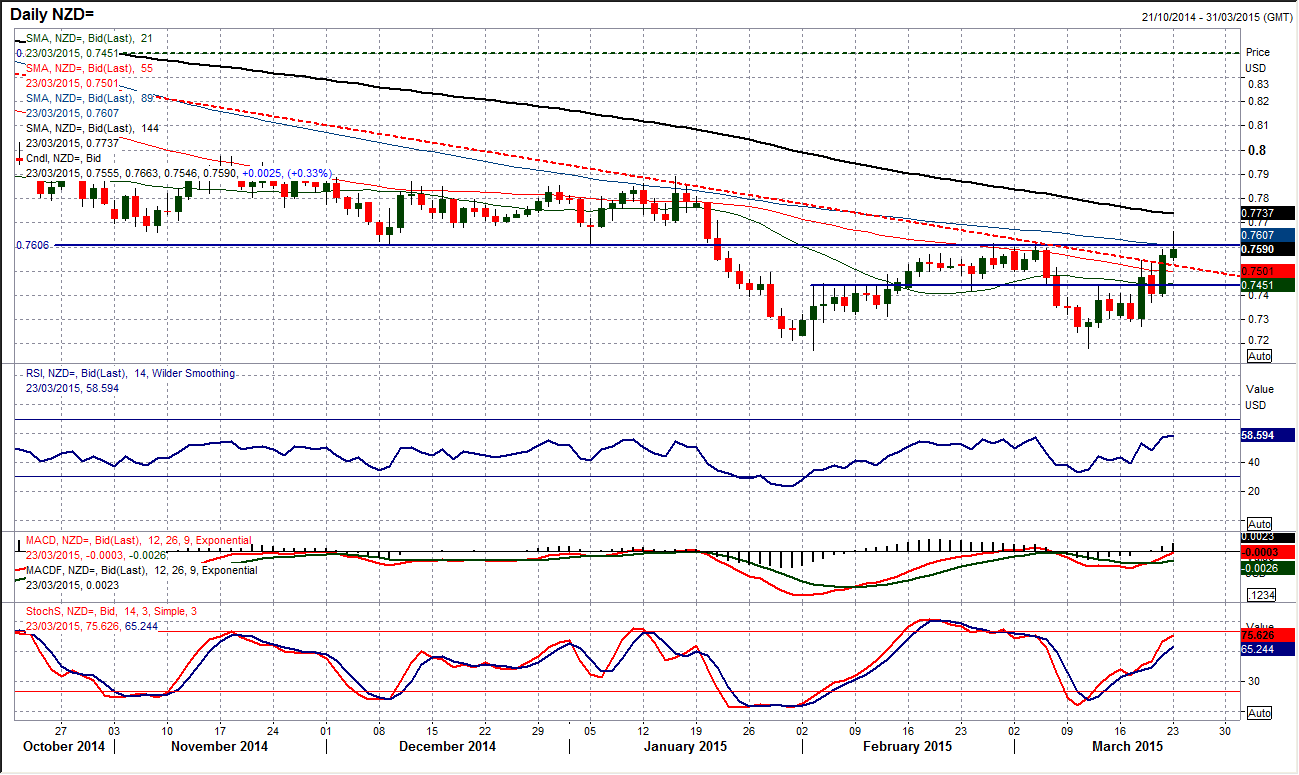
Forex markets show little sign of settling down too much today, with Cable retreating by 50 pips and the euro also lower. The continued support for commodity prices is helping the Aussie and Kiwi dollars to find further support, with the Kiwi testing its key resistance around 0.7600.
There is little on the economic calendar today, with the European session broadly empty, whilst the US traders will be looking out for existing home sales at 1400GMT. The expectation is for 4.91m (up slightly from 4.82m). There is also a range of Fed speakers throughout the week, beginning with Stanley Fischer who is speaking at 1620GMT and could impact on the volatile US dollar.
Chart of the Day – NZD/USD
Could the Kiwi be the first forex major to make a serious dent in the strong dollar outlook? The resistance band around 0.7600 has been breached early today and this means that the Kiwi bulls are seriously pushed for a rebound. The 0.7600 resistance is a key medium term pivot level which also could be act as the neckline resistance of a base pattern. The daily chart shows the momentum improving with the RSI today pushing to the highest since July. If the RSI can now start to push solidly into the 60s and above then the prospect of a Kiwi recovery will be growing. Furthermore, there has not been a close above the 89 day moving average (currently 0.7607) since July too. The intraday hourly chart shows an appetite in the Asian session to break through the resistance and this now needs to be maintained. There is initial support around 0.7540.
EUR/USD
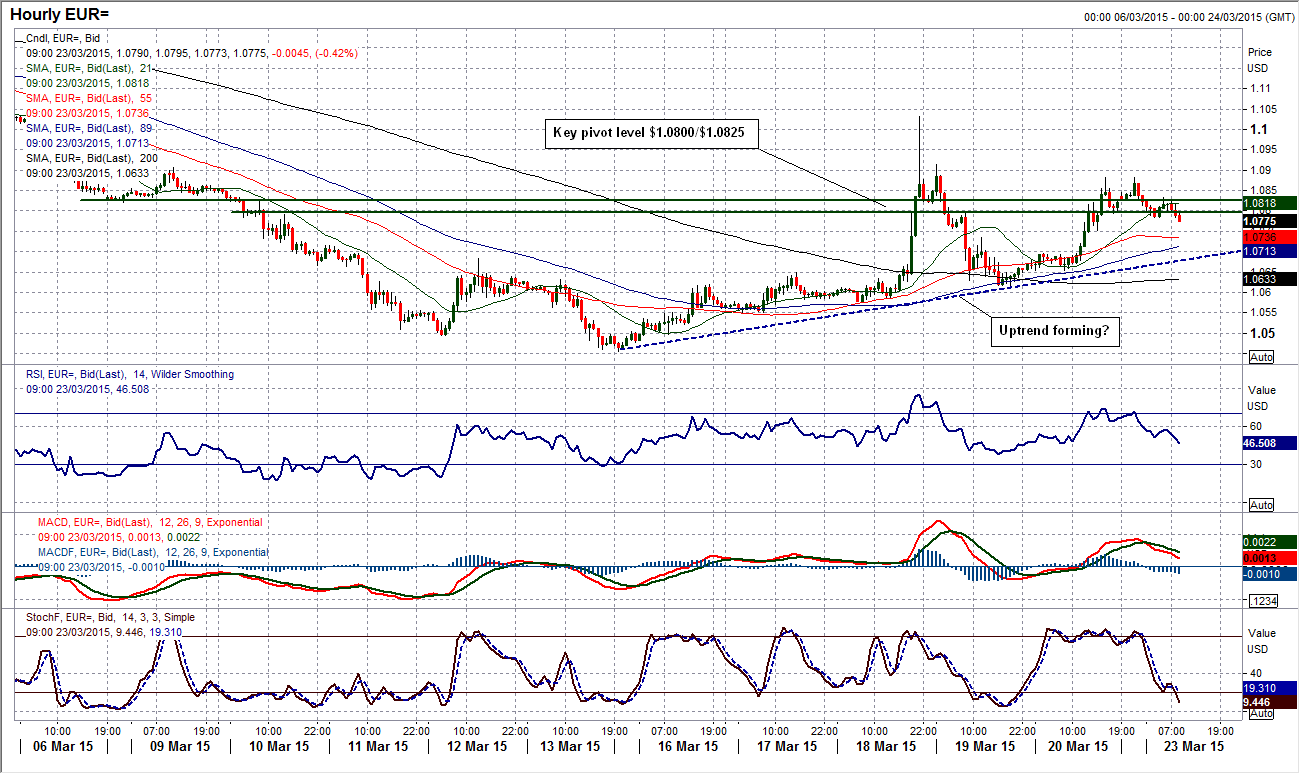
The volatility continued on Friday with a third day in a row that had a daily range of over 200 pips. The market is still looking to settle though and momentum indicators are unwinding. However there is still, as yet nothing to really suggest that there is a significant change of outlook. The price has just unwound back to the 21 day moving average (c. $1.0915) which has acted as a basis of resistance throughout the bear market. The momentum indicators have unwound but in the bigger picture outlook, seem to be little more than unwinding an oversold market. It is on the hourly chart where the bulls will be more positive, with an uptrend having formed since 13th March and a push above the resistance band around $1.0800/$1.0825. If the rally can break above $1.0900 then the bulls will consider that there has been some serious ground being made. The support within the uptrend comes in around $1.0700.
GBP/USD
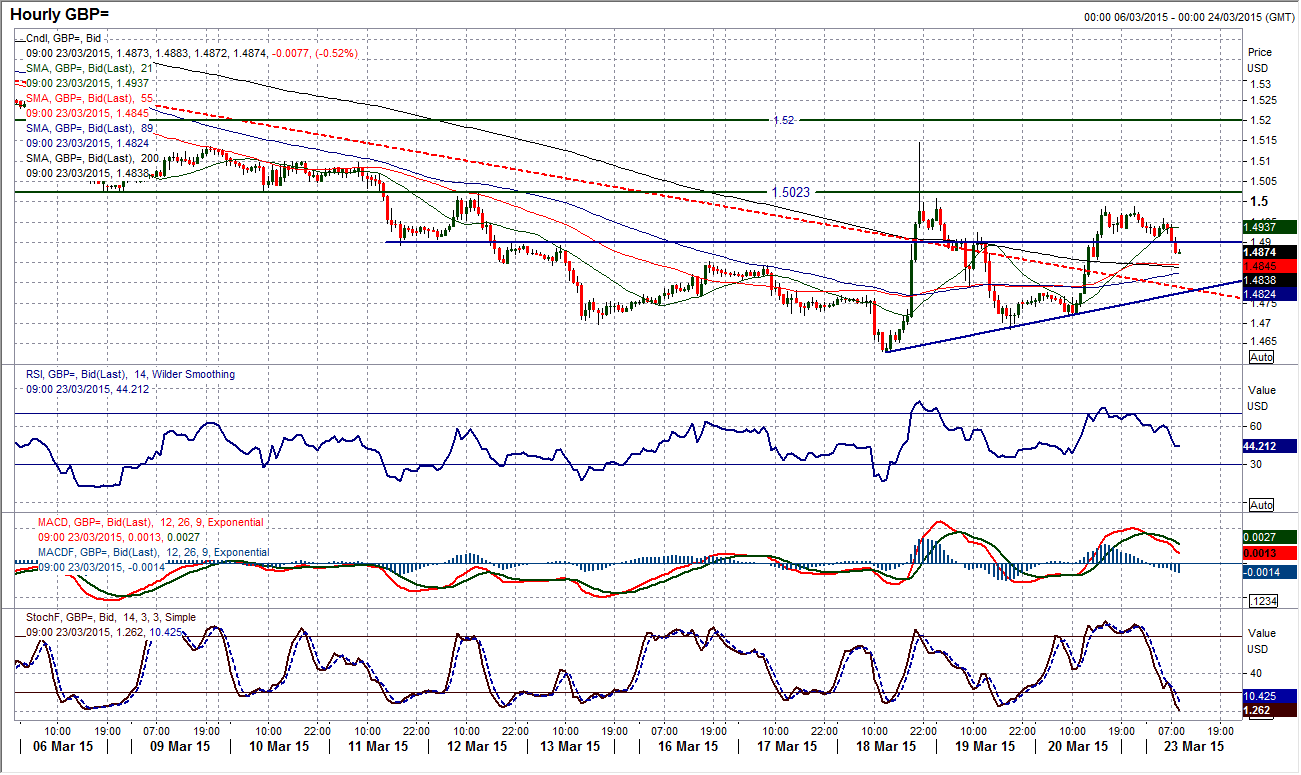
Cable is interesting because there have been a series of strong candles within the volatility that show a recovery off the $1.4632 low but still well inside the volatile range from last Wednesday, and also struggling to gain any traction above the $1.5000 level. Momentum has picked up slightly, but again as with the euro this is nothing to really be overly bullish about, whilst the price is still trading below all the daily falling moving averages. The hourly chart shows the formation of a very near term uptrend since the low last Wednesday, but also that the old pivot level at $1.5020 is still a significant barrier which needs to be overcome. The old pivot level around $1.4900 is helping to prop up sterling in the near term but a failure of this support could see the price retreating once more back towards the $1.4685 low again.
USD/JPY
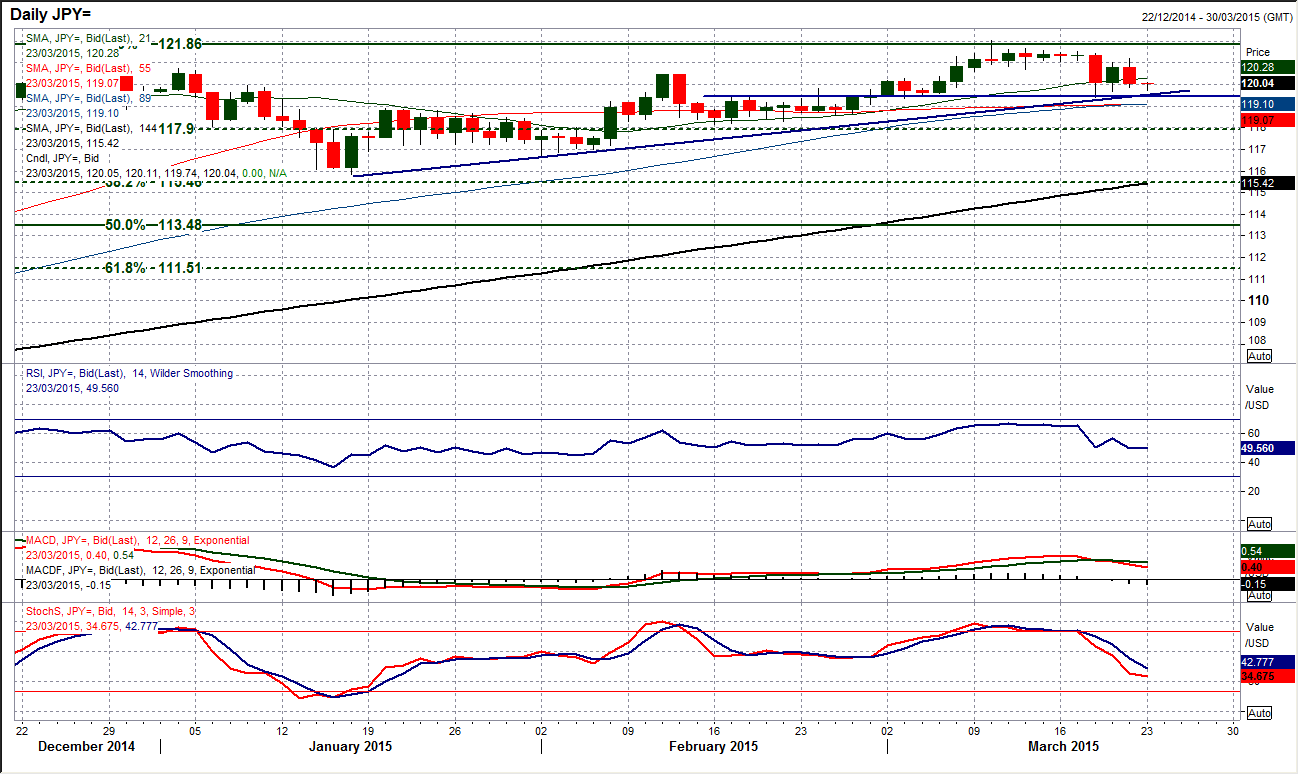
A drop back in the dollar has once again seen Dollar/Yen retreat to test the support of the uptrend in place since mid-January. This also therefore means that the key support of the pivot level at 119.40 is also close by. There has been a deterioration in the outlook which has resulted in the momentum indicators dropping away, but for now this all seems to be part of a bull market correction. The daily RSI is around neutral, the MACD lines have dipped back towards neutral, whilst the price is trading above most the moving averages (except 21 day ma). There is still a sense that there is volatility in the price which needs to settle and once this is done then then we can get a better gauge of the impact. However if the support at 119.40 remains intact then the bulls will be looking once more upon this as a chance to buy.
Gold
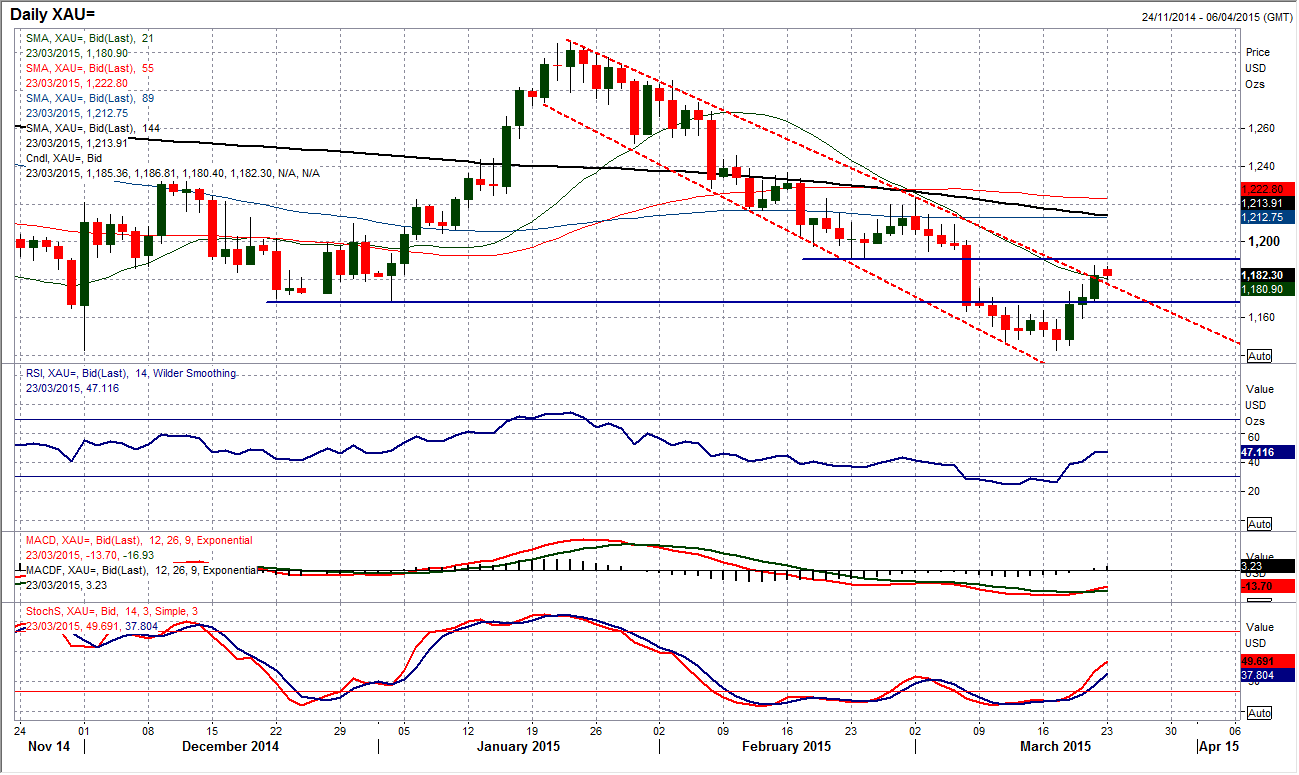
Of all the major dollar-related plays, gold has probably been the one to form the most sturdy of reactions, with three solid days of gains in the wake of the FOMC. This has now dragged the price higher to breach the upper limit of the downtrend channel that had pulled the price lower over the past 8 weeks. The move has also breached the falling 21 day moving average (c. $1181) which has acted as a barrier to the upside in recent weeks. However, it does not mean that the bulls are up and away now. There is the resistance band overhead at $1191 which is yet to be breached. Momentum indicators have been improving with the Stochastics making good ground, but the RSI remains below 50 and the MACD lines are still yet to solidly pick up. The intraday hourly chart shows a band of intraday support between $1168.40/$1175 now to hold up for continued recovery.
WTI Oil
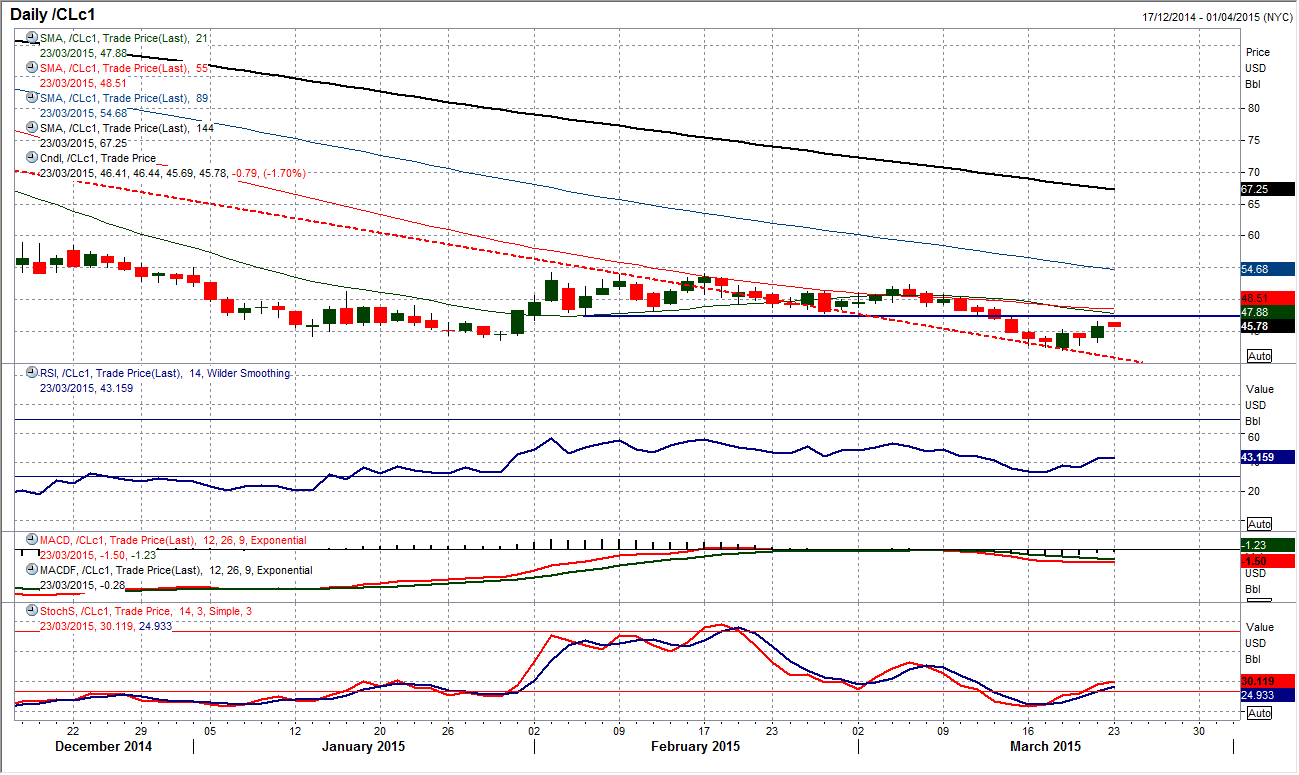
Volatility remains significant on WTI in the wake of the FOMC decision. The sharp gains on Friday came amidst the dollar weakness and now means that the bulls are looking higher again. The immediate test comes in today with the old key support at $47.36 which is now turned into resistance. There is also the barrier of the falling 21 day moving average (c. $48) to be negotiated. This is the point at which the recovery will be seriously questioned. It is interesting that there has been a buy signal confirmed on the daily Stochastics, whilst the RSI is also improving again. The intraday hourly chart suggests that there is now a band of support between $44.80/$45.35.
Note: All information on this page is subject to change. The use of this website constitutes acceptance of our user agreement. Please read our privacy policy and legal disclaimer. Opinions expressed at FXstreet.com are those of the individual authors and do not necessarily represent the opinion of FXstreet.com or its management. Risk Disclosure: Trading foreign exchange on margin carries a high level of risk, and may not be suitable for all investors. The high degree of leverage can work against you as well as for you. Before deciding to invest in foreign exchange you should carefully consider your investment objectives, level of experience, and risk appetite. The possibility exists that you could sustain a loss of some or all of your initial investment and therefore you should not invest money that you cannot afford to lose. You should be aware of all the risks associated with foreign exchange trading, and seek advice from an independent financial advisor if you have any doubts.
Recommended Content
Editors’ Picks
AUD/USD hovers around 0.6500 amid light trading, ahead of US GDP

AUD/USD is trading close to 0.6500 in Asian trading on Thursday, lacking a clear directional impetus amid an Anzac Day holiday in Australia. Meanwhile, traders stay cautious due ti risk-aversion and ahead of the key US Q1 GDP release.
USD/JPY finds its highest bids since 1990, near 155.50

USD/JPY keeps breaking into its highest chart territory since June of 1990 early Thursday, testing 155.50 for the first time in 34 years as the Japanese Yen remains vulnerable, despite looming Japanese intervention risks. Focus shifts to Thursday's US GDP report and the BoJ decision on Friday.
Gold price treads water near $2,320, awaits US GDP data

Gold price recovers losses but keeps its range near $2,320 early Thursday. Renewed weakness in the US Dollar and the US Treasury yields allow Gold buyers to breathe a sigh of relief. Gold price stays vulnerable amid Middle East de-escalation, awaiting US Q1 GDP data.
Injective price weakness persists despite over 5.9 million INJ tokens burned

Injective price is trading with a bearish bias, stuck in the lower section of the market range. The bearish outlook abounds despite the network's deflationary efforts to pump the price. Coupled with broader market gloom, INJ token’s doomed days may not be over yet.
Meta Platforms Earnings: META sinks 10% on lower Q2 revenue guidance Premium

This must be "opposites" week. While Doppelganger Tesla rode horrible misses on Tuesday to a double-digit rally, Meta Platforms produced impressive beats above Wall Street consensus after the close on Wednesday, only to watch the share price collapse by nearly 10%.
