Market Overview
There has been an incredibly volatile reaction across forex markets in the wake of the FOMC meeting. Much of the initial sharp selling pressure against the dollar has been retraced and markets are in a state of uncertainty. This means that it could still take a few days before a true market trend emerges from the actions of the Fed. My base case analysis remains that markets got too far ahead of themselves and Wednesday was a reality check, however the bull run of the dollar is going to remain the key trade for 2015.
Equity markets have chopped around and this was shown in Wall Street giving back some of the gains from the previous day. The S&P 500 dropped back by 0.5% as traders try to make sense of everything. Asian markets have been mixed overnight with the Nikkei 225 up 0.4% benefitting from the weakening of the yen. European markets are trading slightly higher in early exchanges.
In forex trading there is little significant movement amongst the majors, however the commodity currencies (Aussie, Kiwi and Loonie) have all strengthened slightly as the oil price has just picked up slightly from yesterday’s low. There is little economic data to drive markets on Friday with the UK Public Sector Borrowing expected to show an influx of £7.7bn into government coffers in February. There is also Canadian CPI inflation which is expected to remain flat at 1.0% on an annualised basis. We also have FOMC members Dennis Lockhart and Charles Evans (both doves) making speeches today.
The EU leaders meet today in Brussels and the traditional two major topics will be Greece and Ukraine. The EU needs to know that Greece is developing on its economic reforms. With regards to Ukraine, there has been an agreement to link the lifting of the economic sanctions on Russia with the implementation of a full ceasefire agreement in Ukraine.
Chart of the Day – DAX Xetra
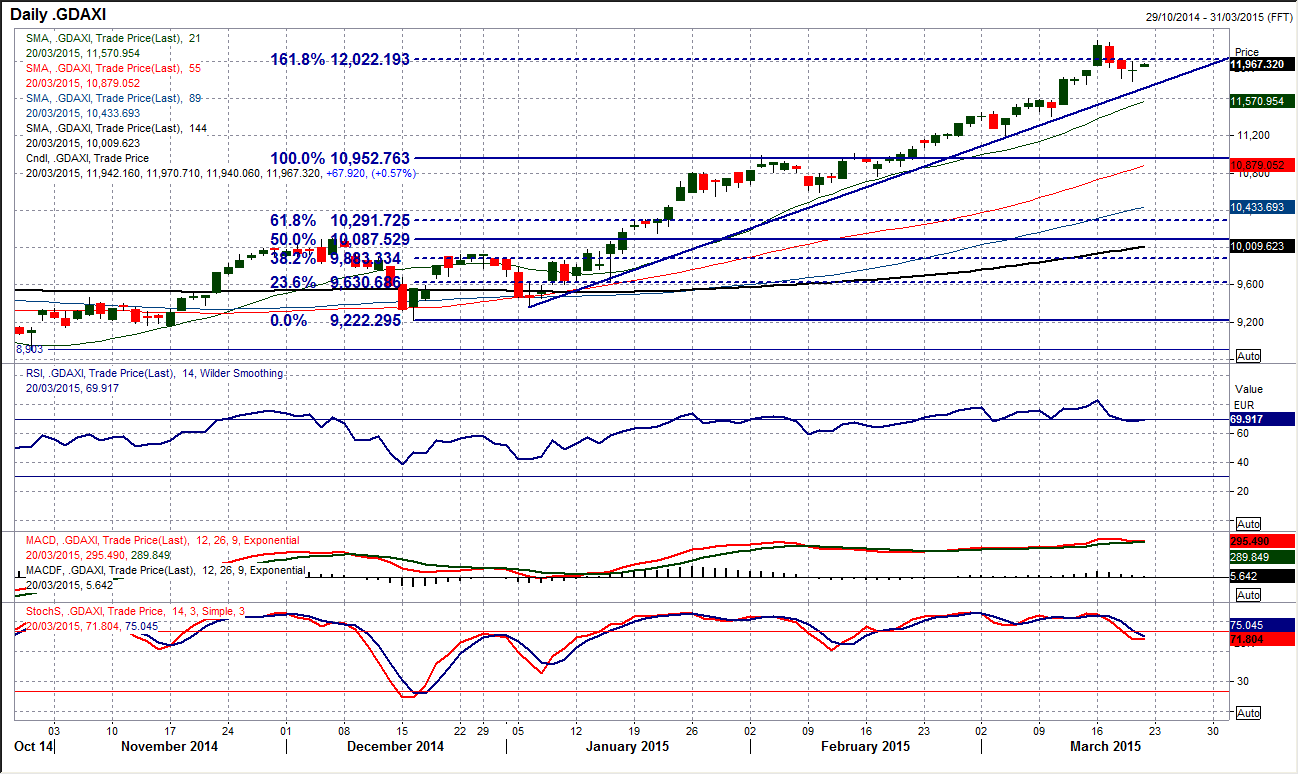
Such is the strength of the bull run it has almost become a shock when the DAX is not soaring to another triple digit gain. However the past few days have seen a reversal of over 250 points as a slight correction has set in. This move is though still contained nicely within the 10 week uptrend (which today comes in nicely around 11700). Momentum indicators remain positive and suggest that corrections remain a chance to buy again. There is an element of unwinding that is underway but whilst the RSI and Stochastics both remain above 60 (a level at which a previous correction within the uptrend formed support) then I would remain comfortable. Yesterday’s candle was a “doji” (open and close at the same level) and reflects uncertainty with the previous move (which was lower). Therefore with a positive open today, the ground has been laid once more for the bulls). The intraday hourly chart shows that there is a minor support at 11745 which would complete a small top pattern if it were to be broken.
EUR/USD
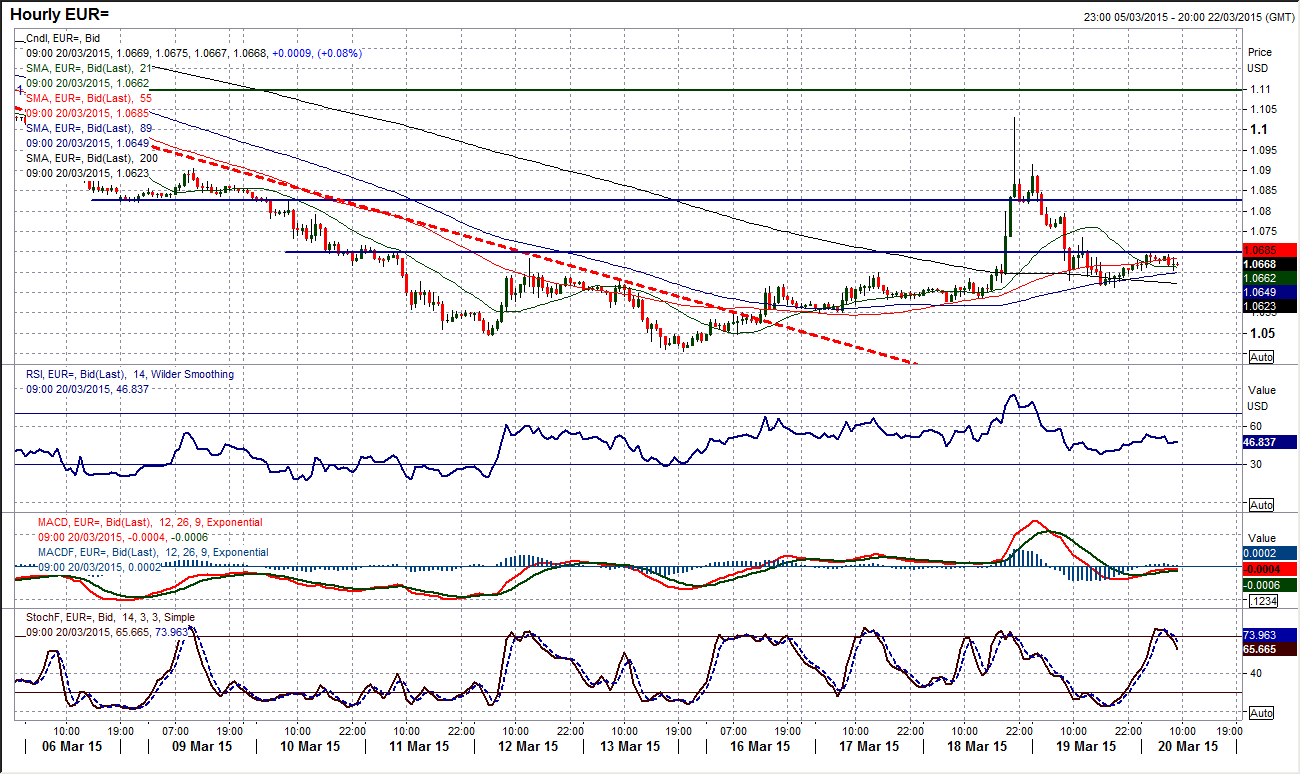
It may be several days before we really get a full gauge of the market’s reaction to the FOMC. Once the volatility settles down and we start to see some trends developing then we will know whether the sharp move higher on the euro was just a blip in the dollar bull run that has dragged EUR/USD so significantly lower in the past few weeks. The daily chart looks shows the volatility of the last two sessions, but the momentum indicators have been broadly flat in their reaction. The intraday hourly chart shows a low in at $1.0612 from yesterday which has held overnight. This will be an initial marker for the bulls to work from. In terms of resistance there is a minor reaction high up at $1.0794, which protects the spike high up at $1.0991. We are still in the early stages of everything settling down and that could mean several twists and turns before a true trend develops, but my expectation is that there is still further to go in this dollar bull run.
GBP/USD
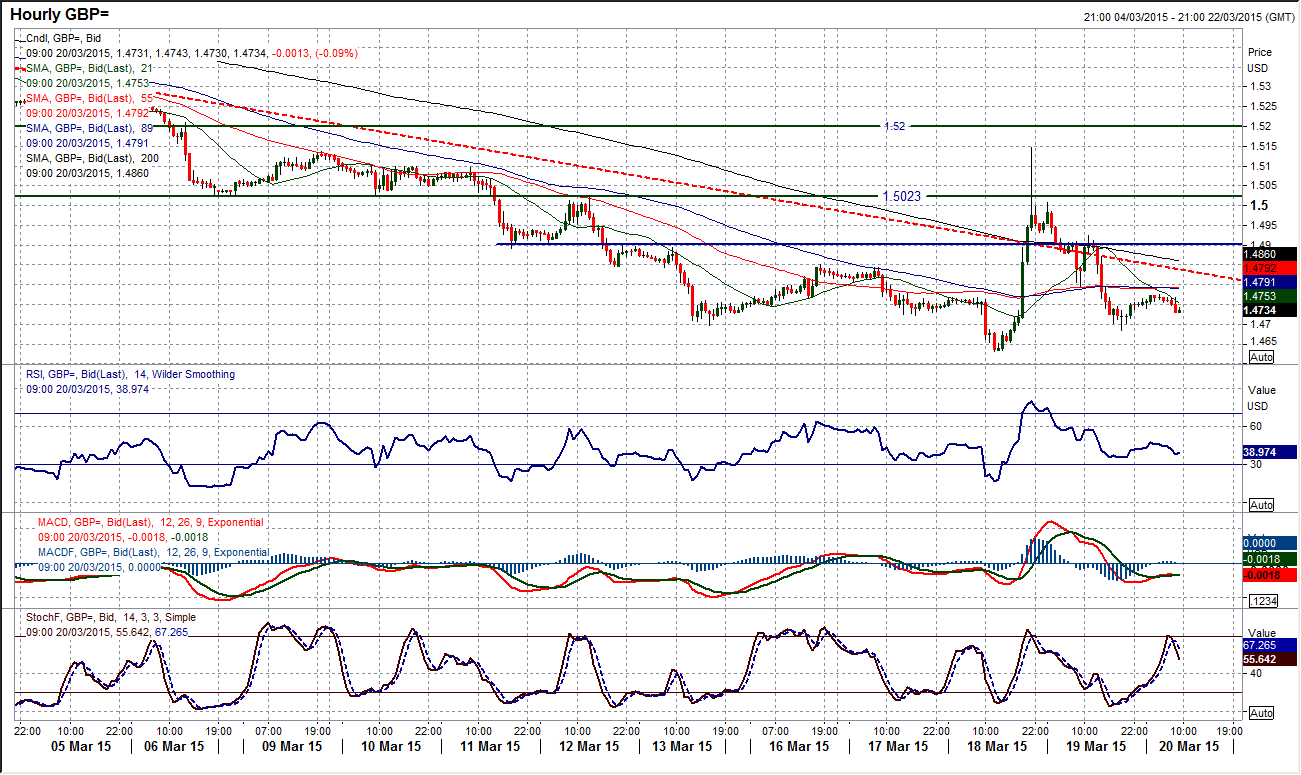
The bull key one day reversal on Wednesday was never confirmed as we saw an incredible opposite reaction yesterday meaning that the entire body of the bull candle has been nullified. So we are effectively back to square one now. The momentum indicators show that the bulls are still struggling to gain anything of a foothold, whilst also suggesting that rallies are a chance to sell. Cable is also still trading entirely below the moving averages to reflect the ongoing bearish outlook. The intraday hourly chart shows that there is now a major low in place from Wednesday at $1.4633 and subsequently yesterday’s low at $1.4685, the latter of which will be seen as a near term marker for the bulls. During yesterday’s volatile moves it was interesting that a key turning point came around the old pivot level around $1.4900. We are still waiting for the chart to settle down but the outlook remains negative.
USD/JPY
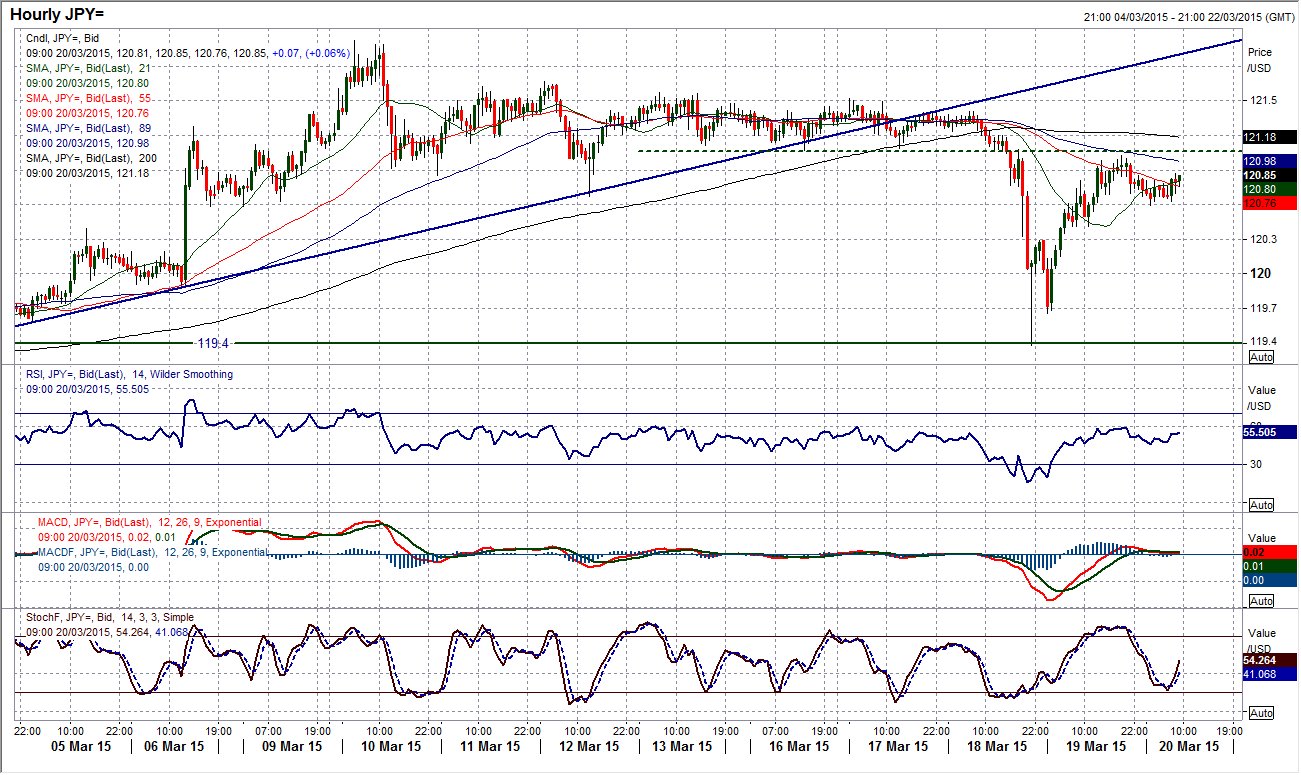
Dollar/Yen is yet another chart than is looking to settle down still following the FOMC. However the technical outlook remains positive and certainly for now this dip looks to have been another chance to buy. The reaction from yesterday has seen another key low coming in around the 119.40 which was a confluence of support from an old key pivot level and a two month uptrend. The momentum indicators are a touch mixed which lends a bit of caution, with the Stochastics in decline, but the RSI came back to find support around 50 which is a positive. The intraday chart shows there is still some settling to do but there is a low that has been left at 120.40 that the bulls will now look to use. Overhead resistance seems to now be a 10 pip pivot level with the old support around 121.10 and yesterday’s high just above 121.00.
Gold
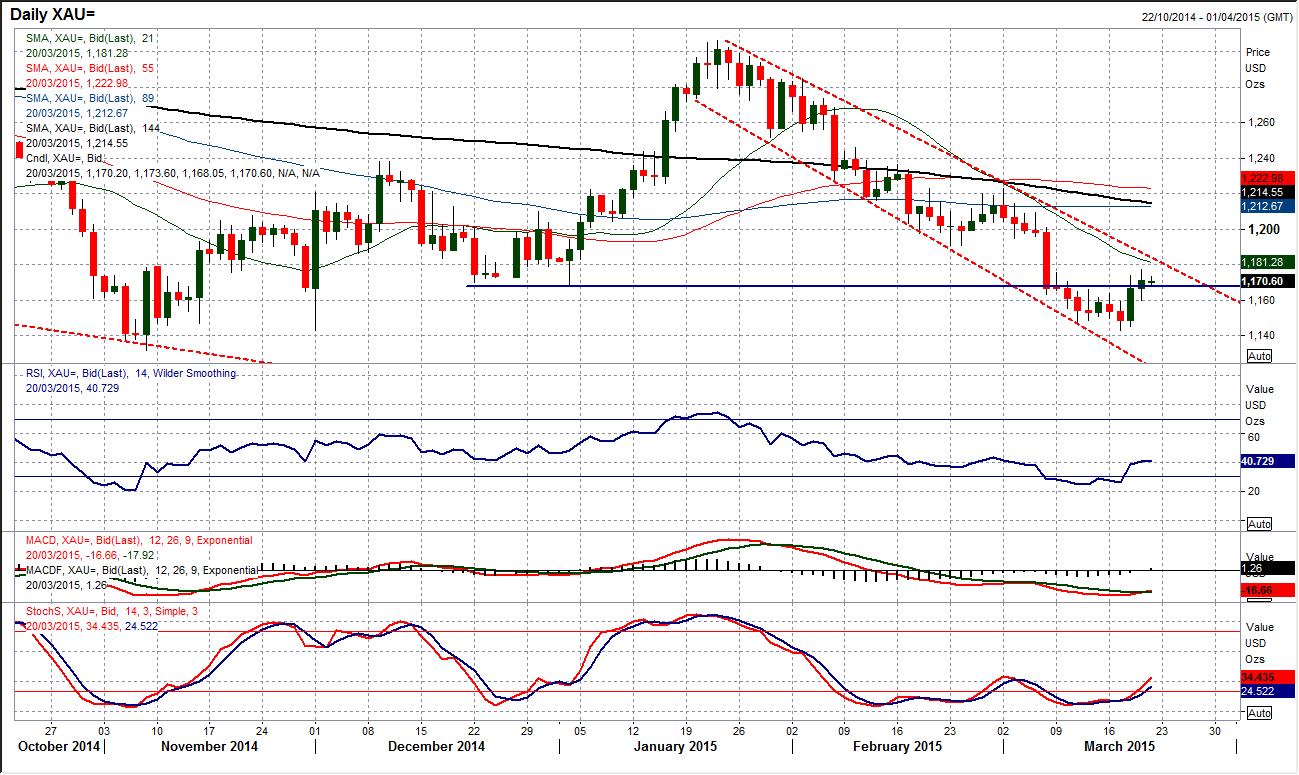
Essentially gold has just seen a rally within the downtrend channel. The only slight caution that I have with using this rally as a chance to sell is that forex majors have embarked upon a remarkable retracement of the post Fed reaction, whereas gold has managed to hold up. I am therefore interested in the overhead barrier that comes with the falling 21 day moving average (c. $1181) and the top of the downtrend channel (c. $1184). As yet I see nothing in the momentum indicators that tells me this is anything more than a bear market rally and as such I retain my base case that gold is a sell into strength. I feel that today’s session could be interesting as the market continues to settle down and there is little economic data to drive the price. The old support at $1191 is also a resistance. The intraday hourly chart shows the old resistance around $1160 has turned into new support and a failure of this level would re-ignite the bears once more.
WTI Oil
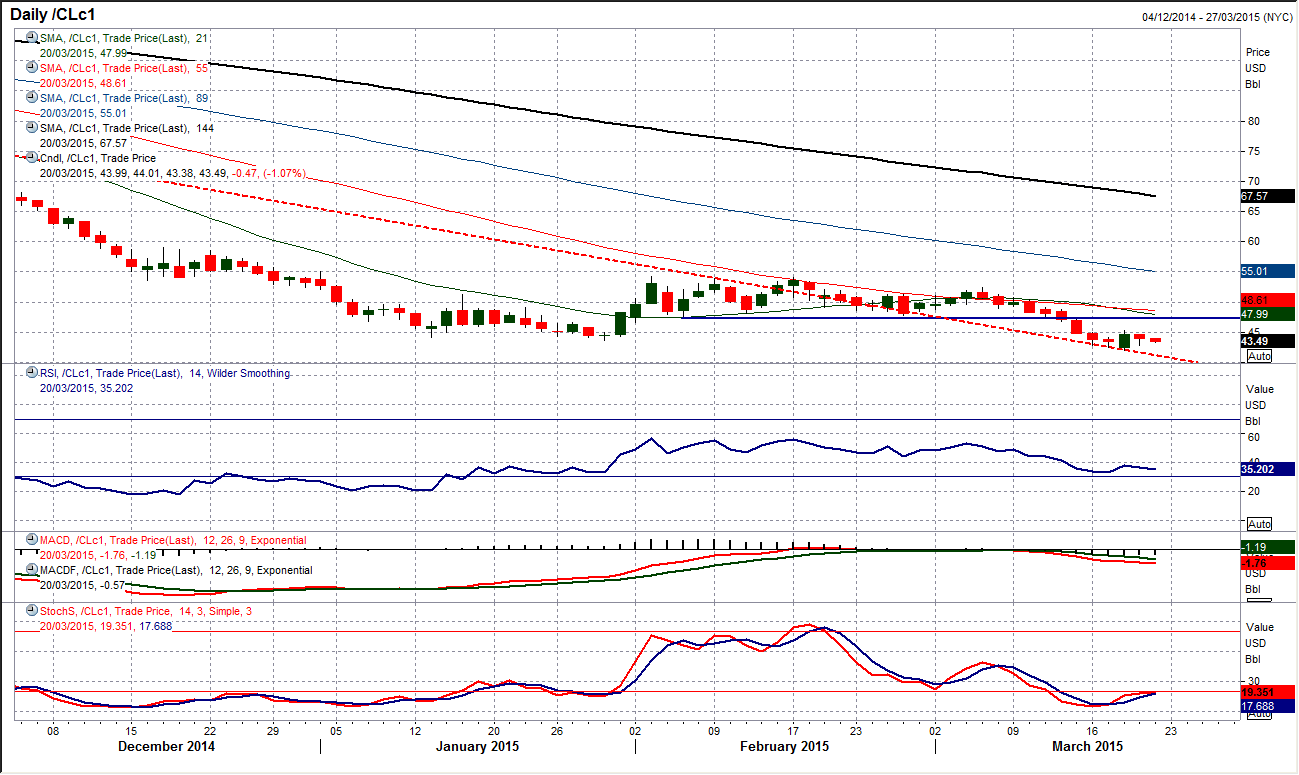
The bullish key one day reversal that was seen in the wake of the FOMC announcement has quickly come back under pressure as the bulls have lost control again. This is not a terminal move yet with the key low at $42.03 a support that is still intact, however the key reversal is almost the only positive factor going for the WTI price currently. The price has made almost no attempt to put pressure on the reaction high at $45.34., whilst momentum indicators have barely picked up at all as the price has fallen back again. It is interesting that the price has again seemingly formed support on the topside of the old extended downtrend on the daily chart. Looking on the intraday hourly chart suggests that there is a reassessment of exactly who is in control of the outlook now. If the support at $42.75 can hold then perhaps the bulls can start top regain some confidence once more. However there would need to be a push above the near term pivot level around $44 to suggest there was another improving outlook underway.
Note: All information on this page is subject to change. The use of this website constitutes acceptance of our user agreement. Please read our privacy policy and legal disclaimer. Opinions expressed at FXstreet.com are those of the individual authors and do not necessarily represent the opinion of FXstreet.com or its management. Risk Disclosure: Trading foreign exchange on margin carries a high level of risk, and may not be suitable for all investors. The high degree of leverage can work against you as well as for you. Before deciding to invest in foreign exchange you should carefully consider your investment objectives, level of experience, and risk appetite. The possibility exists that you could sustain a loss of some or all of your initial investment and therefore you should not invest money that you cannot afford to lose. You should be aware of all the risks associated with foreign exchange trading, and seek advice from an independent financial advisor if you have any doubts.
Recommended Content
Editors’ Picks
EUR/USD regains traction, recovers above 1.0700

EUR/USD regained its traction and turned positive on the day above 1.0700 in the American session. The US Dollar struggles to preserve its strength after the data from the US showed that the economy grew at a softer pace than expected in Q1.
GBP/USD returns to 1.2500 area in volatile session

GBP/USD reversed its direction and recovered to 1.2500 after falling to the 1.2450 area earlier in the day. Although markets remain risk-averse, the US Dollar struggles to find demand following the disappointing GDP data.
Gold climbs above $2,340 following earlier drop

Gold fell below $2,320 in the early American session as US yields shot higher after the data showed a significant increase in the US GDP price deflator in Q1. With safe-haven flows dominating the markets, however, XAU/USD reversed its direction and rose above $2,340.
XRP extends its decline, crypto experts comment on Ripple stablecoin and benefits for XRP Ledger

Ripple extends decline to $0.52 on Thursday, wipes out weekly gains. Crypto expert asks Ripple CTO how the stablecoin will benefit the XRP Ledger and native token XRP.
After the US close, it’s the Tokyo CPI

After the US close, it’s the Tokyo CPI, a reliable indicator of the national number and then the BoJ policy announcement. Tokyo CPI ex food and energy in Japan was a rise to 2.90% in March from 2.50%.
