Market Overview
We saw an odd reaction yesterday as Wall Street and the dollar pushed higher on weaker than expected US data. This shows that there is a growing acceptance of the Fed hiking rates this year. It does though still make me cautious as I would much prefer new all-time highs on Wall Street to be accompanied by positive data. The S&P 500 rose 0.6% as the NASDAQ pushed back above 5000 for the first time since March 2000. The Asian session has been more reticent to make the upside move, and was not helped by the Reserve Bank of Australia which somewhat unexpected chose to stand firm on its interest rates at 2.25% (expectation had been for a 25bps rate cut). The RBA decision put a damper on Aussie stocks and the Japanese Nikkei 225 was down slightly on the day too. European equities are looking slightly mixed to positive in early trading, with the FTSE 100 still searching for that illusive close above 6950.
In forex trading, after the dollar threatened to break higher yesterday (but failing) there is a slight move away from the greenback towards with all the major trading stronger. Pick of the bunch is the Aussie which is stronger after the RBA opted against a second successive rate cut. There is not too much going on to bother traders today, with the UK Construction PMI at 0930GMT (59.0 is expected, which is down from 59.1 last month). There is also Canadian GDP at 1330GMT which is expected to come in at an annualised 2.0%.
Chart of the Day – Silver
The price action has been very interesting over the past few days on silver. The resistance of the 5 week downtrend has again capped the gains and the sellers look ready to resume control. A bearish outside day yesterday has re-affirmed the downtrend and also seems to suggest that momentum indicators are still in fairly negative configuration. However the bears have not got it all their own way as the overnight low has been posted right at the $16.04 support from which the price has bounced sharply. The next price action is important as a lower high under yesterday’s reaction high at $16.78 would suggest that the snap rally is just a kneejerk reaction to be sold into. Already the intraday hourly chart is showing the rebound stalling under a historic pivot level at $16.60, which coincides with the resistance of the 5 week downtrend. This looks to be a chance to sell. A confirmed move above $16.88 would suggest a potential reversal.
EUR/USD
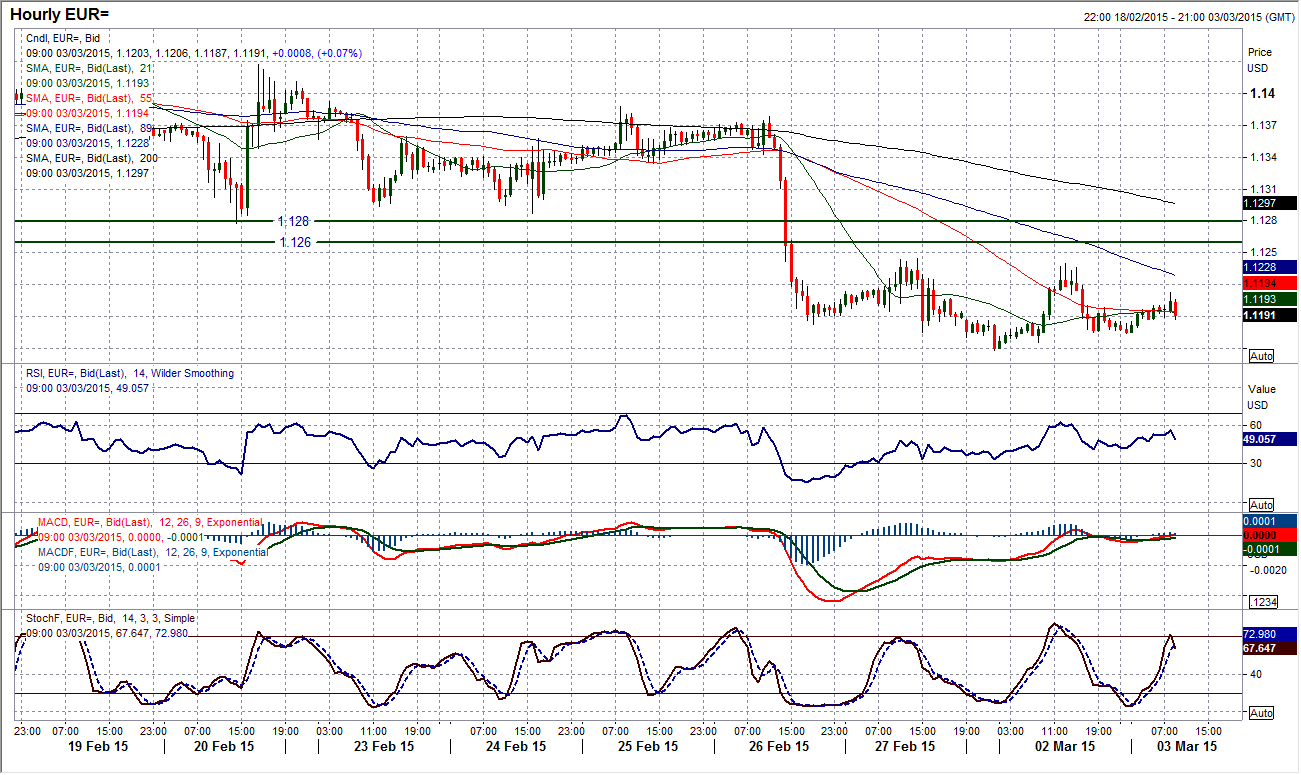
The downside pressure remains on the euro however, the optimists out there will be pointing to two successive “doji” candlesticks (open and close at the same level) which denotes uncertainty. This could though alternatively be a period of consolidation playing out. The momentum indicators on the daily chart continue to reflect the pressure that is on to the downside since the $1.1260 support was breached. The intraday chart shows a minor recovery yesterday morning (after the Eurozone inflation data came in slightly above expectations) however this move was snuffed out again just under the resistance of Friday’s high at $1.1245. This continues to play out the strategy of selling into strength as it certainly seems as though a retest of the $1.1098 low will be seen in due course. The key near term resistance is the old support at $1.1260.
GBP/USD
The 5 week rally is coming under further pressure today as the 21 day moving average (around $1.5350) which has been supportive through the rebound is now being tested. This is the latest questioning of the strength of the bull control over the past few days since the bearish key one day reversal flipped the positive sentiment on its head. Daily momentum indicators continue to deteriorate. I have been saying for a while that whilst the intraday support at $1.5300 remains intact the outlook will be positive, however this assertion is becoming increasingly strained as a series of lower highs and lower lows have been formed over the past few days. It looks as though, in the least, Cable is entering into a more choppy ranging phase of trading with the bulls having relinquished control at $1.5552. There is a lower high that now comes in at $1.5458 that could prove to be a key near term barometer. I am increasingly expecting to sellers to take hold at lower levels.
USD/JPY
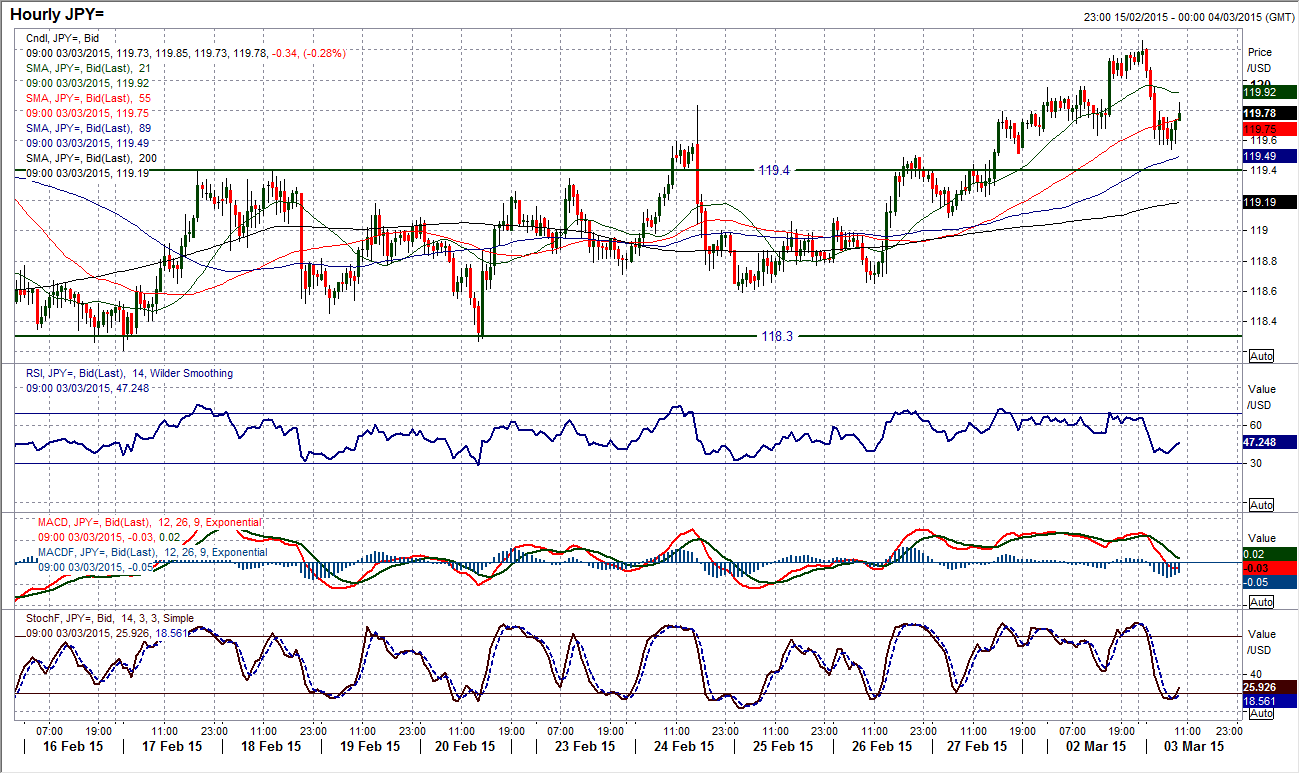
There is more of a slow drift higher than anything more substantial of late on Dollar/Yen as the pair trades clear of the moving averages and looks to be positioning for a test of the reaction high at 120.50. However that test may not be seen today as the overnight yen strength has pulled the rate back towards the support around 119.40. This has just stalled the advance but I see this as only a temporary situation which could even lend itself to a buying opportunity for a retest of the resistance levels. Whilst the reaction low at 119.10 remains intact then the outlook will remain positive. A failure of the support would neutralise the bull control and see the pair once more range bound.
Gold
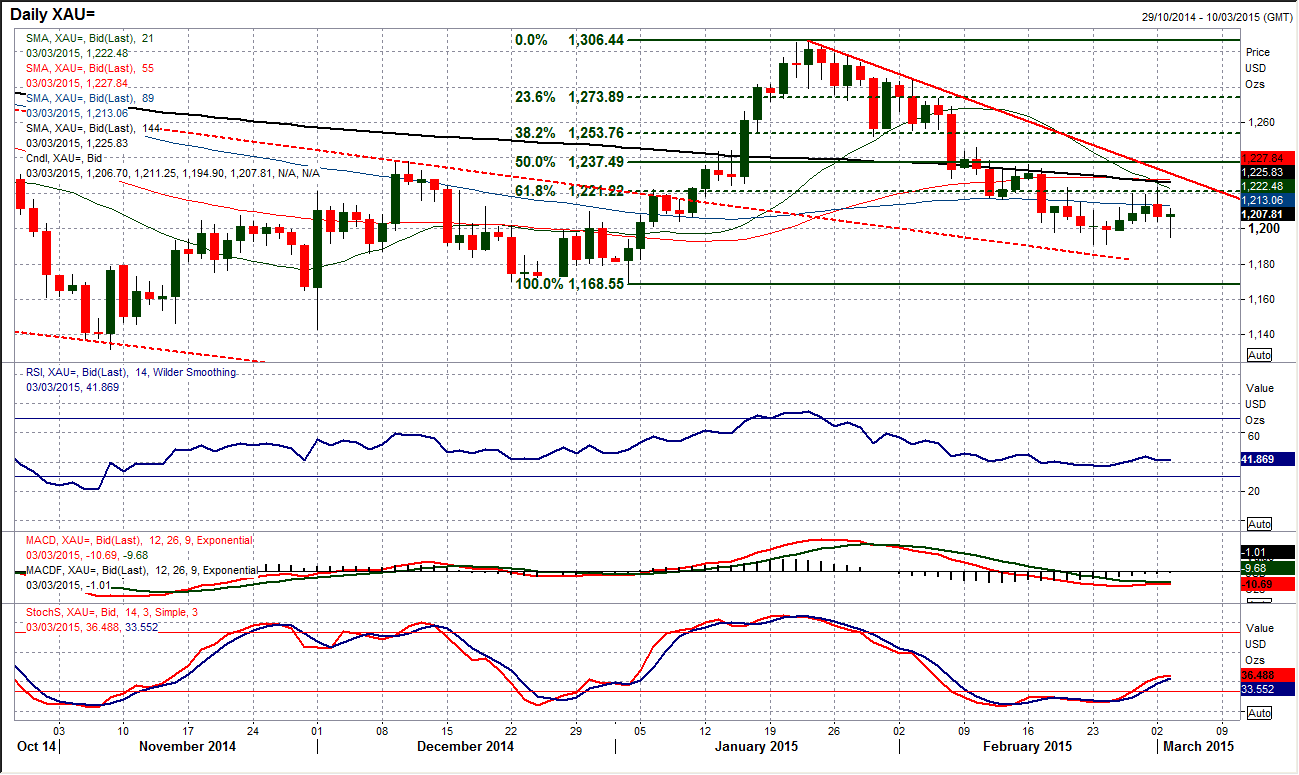
The gold chart is incredibly interesting at the moment as there is so much going on from a technical perspective. We had the recovery that was threatening to complete a base pattern but the resistance around $1223 remained intact and a subsequent intraday correction yesterday has left us with a bearish “shooting star” candle which once more suggests that the sellers have wrestled control back once more. This also suggests that this is just a rally within the medium term bear trend and that strength remains a chance to sell. The overnight price reaction would back this assertion with the hourly chart showing a breach of the initial support at $1204, whilst the rebound towards $1210 which has been an interesting pivot level in recent days is again looking to be a turning point. Although there remains room to the upside (the medium term downtrend today comes in around $1231), my bearish conviction has been backed up by yesterday’s candle and I expect the downside to resume in due course. The resistance at $1223 is taking on increasing importance, but the $1236.50 rally high is ultimately key for the bear control.
WTI Oil
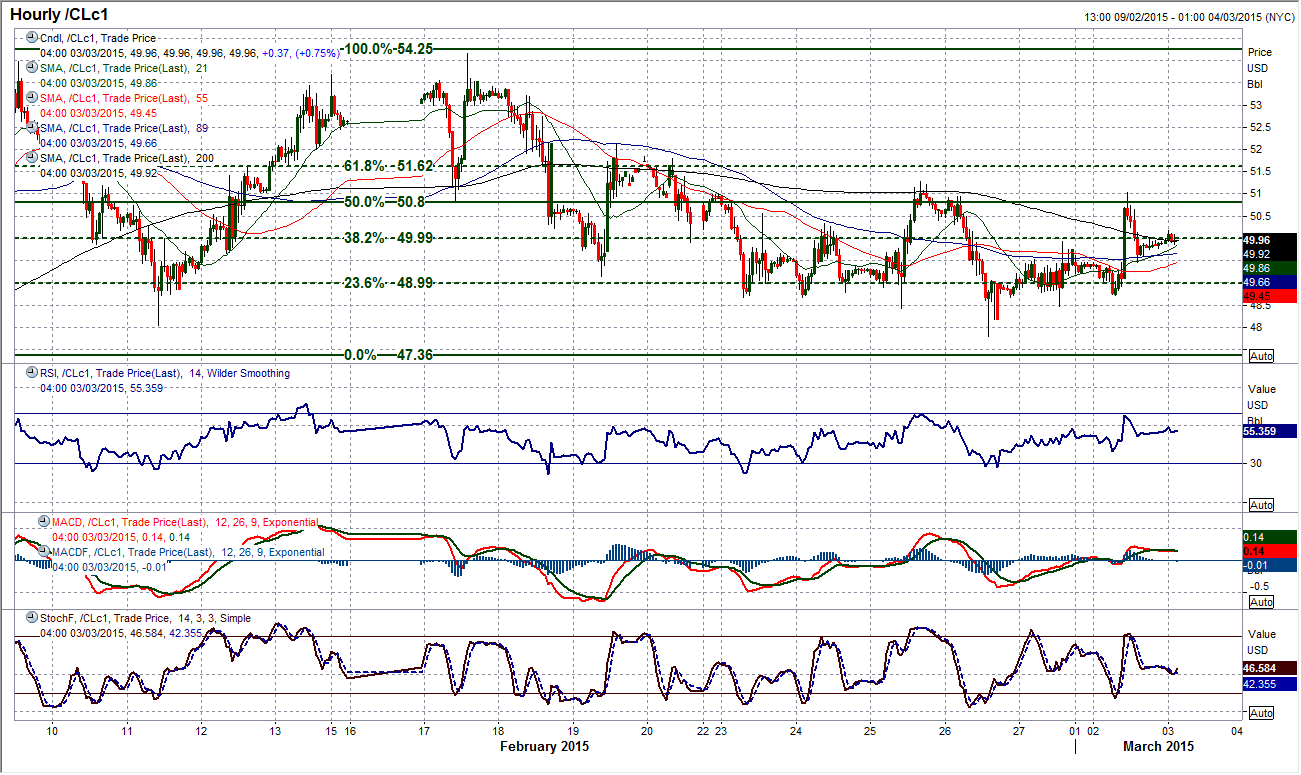
Once again the support for WTI has held strong and for the fourth time in 6 sessions the buyers have returned around $48.70. A volatile intraday rally yesterday afternoon (after the ISM data release) has therefore maintained the broad trading range play between $47.36/$54.24. The bulls will now be eying the near term resistance of the peak at $51.28, however amidst all the intraday volatility the Fibonacci retracements within the range are still playing a very interesting basis of consolidation for the rallies. The 38.2% Fib level at $50 has played a consistent pivot level, whilst the 50% level comes in at $50.80 whilst 61.8% to the high is at $51.60. The range play still means that playing the overbought/oversold hourly RSI signals is possible. Until there is a decisive break of the range I see the volatility continuing for WTI.
Note: All information on this page is subject to change. The use of this website constitutes acceptance of our user agreement. Please read our privacy policy and legal disclaimer. Opinions expressed at FXstreet.com are those of the individual authors and do not necessarily represent the opinion of FXstreet.com or its management. Risk Disclosure: Trading foreign exchange on margin carries a high level of risk, and may not be suitable for all investors. The high degree of leverage can work against you as well as for you. Before deciding to invest in foreign exchange you should carefully consider your investment objectives, level of experience, and risk appetite. The possibility exists that you could sustain a loss of some or all of your initial investment and therefore you should not invest money that you cannot afford to lose. You should be aware of all the risks associated with foreign exchange trading, and seek advice from an independent financial advisor if you have any doubts.
Recommended Content
Editors’ Picks
EUR/USD stays below 1.0700 ahead of US data

EUR/USD stays in a consolidation phase slightly below 1.0700 in the European session on Wednesday. Upbeat IFO sentiment data from Germany helps the Euro hold its ground as market focus shifts to US Durable Goods Orders data.
USD/JPY refreshes 34-year high, attacks 155.00 as intervention risks loom

USD/JPY is renewing a multi-decade high, closing in on 155.00. Traders turn cautious on heightened risks of Japan's FX intervention. Broad US Dollar rebound aids the upside in the major. US Durable Goods data are next on tap.
Gold price trades with mild negative bias, manages to hold above $2,300 ahead of US data

Gold price (XAU/USD) edges lower during the early European session on Wednesday, albeit manages to hold its neck above the $2,300 mark and over a two-week low touched the previous day.
Worldcoin looks set for comeback despite Nvidia’s 22% crash Premium

Worldcoin price is in a better position than last week's and shows signs of a potential comeback. This development occurs amid the sharp decline in the valuation of the popular GPU manufacturer Nvidia.
Three fundamentals for the week: US GDP, BoJ and the Fed's favorite inflation gauge stand out Premium

While it is hard to predict when geopolitical news erupts, the level of tension is lower – allowing for key data to have its say. This week's US figures are set to shape the Federal Reserve's decision next week – and the Bank of Japan may struggle to halt the Yen's deterioration.


