Market Overview
So after six hours of talks with the Eurogroup of EU finance ministers, Greek finance minister Yanis Varoufakis was unable to come to an agreement over the repayment of it debt. The suggestion of a bridging loan by the Greeks was rejected and a 6 month extension offered by the Eurogroup is equally unacceptable for Varoufakis. So the talks now switch to Monday where they will do it all again. Financial markets that have been waiting with baited breath for developments will have to wait that little bit longer. Wall Street closed basically flat, whilst Asian markets were . The European trading session has also started on a mixed note lacking direction.
In forex trading, the euro has become flat-lined whilst sterling has also been unable to find direction. The Australian dollar has come under considerable downside pressure after unemployment figures disappointed overnight, which has also dragged the Kiwi lower too. The Bank of England’s Quarterly Inflation Report is the major economic event of the day, with its release at 1030GMT.This is where the BoE updates on its expectations of inflation and growth. The market will be interested to see whether the continued improvement in unemployment and wage growth will impact on the Bank’s figures. A slight hawkish shift is the risk (this is my expectation and also one of the reasons why sterling has held up so well recently) which would benefit sterling.
We also have US Retail Sales today with the expectation of another month on month decline of 0.5% (-0.9% last month). This is an important release as last month’s reading was a bearish surprise and a hit to trading sentiment. The weekly jobless claims are expected to show 282,000 jobs which is a slight increase on last week.
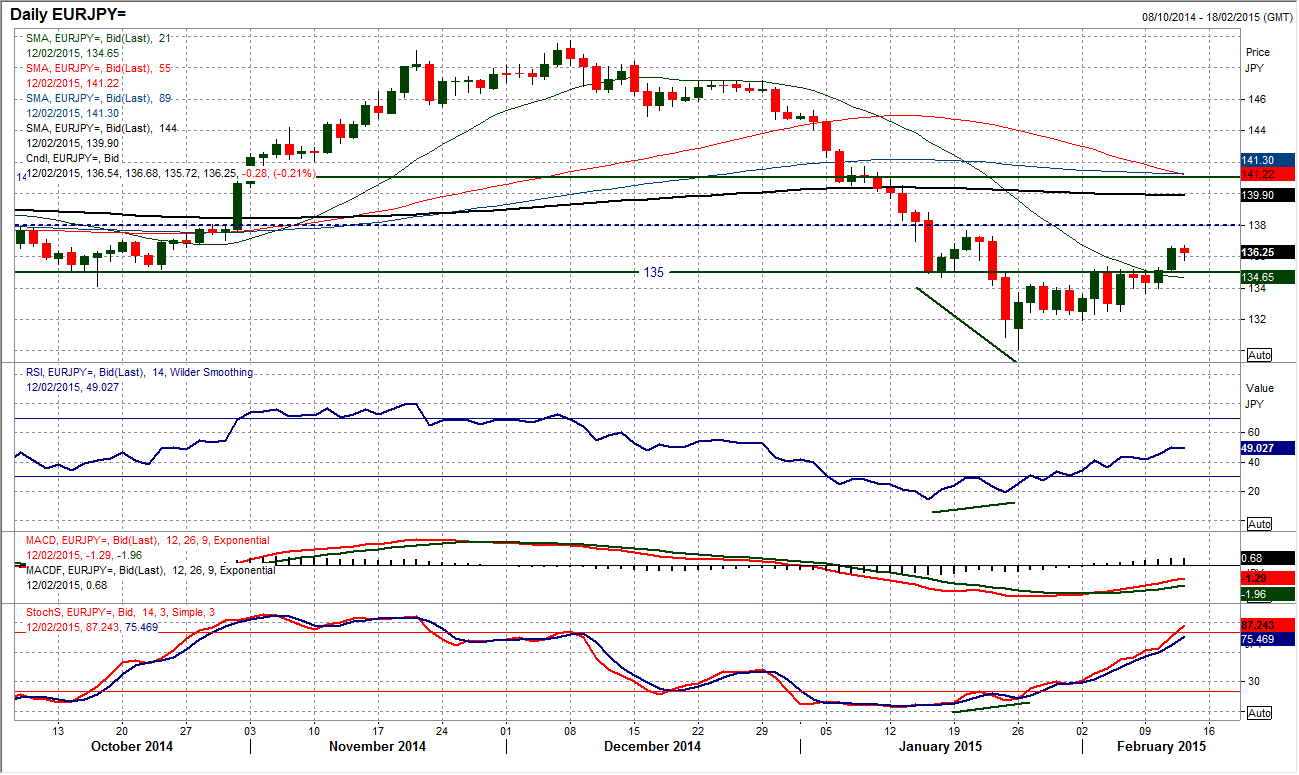
Chart of the Day – EUR/JPY
I have spoken at great length recently about the key pivot level resistance that 135 has played. In recent days this level has acted consistently as the ceiling of resistance. However now this level has been breached and this looks to be a recovery building. The bullish divergence on the daily momentum indicators has turned the outlook around and now a clean break of 135 means that we start to look towards 137.60. The momentum indicators show the recovery is progressing well now with the MACD lines having recently formed a bull cross, the Stochastics rising strongly and the RSI advancing at a 6 week high. The intraday hourly chart shows a slight loss of momentum in Asian trading this morning, but the 135 old resistance now becomes supportive and would be an opportunity to buy no if this level is seen again. The key near term support comes in at 133.60 and a breach would negate the improving outlook on the chart now.
EUR/USD
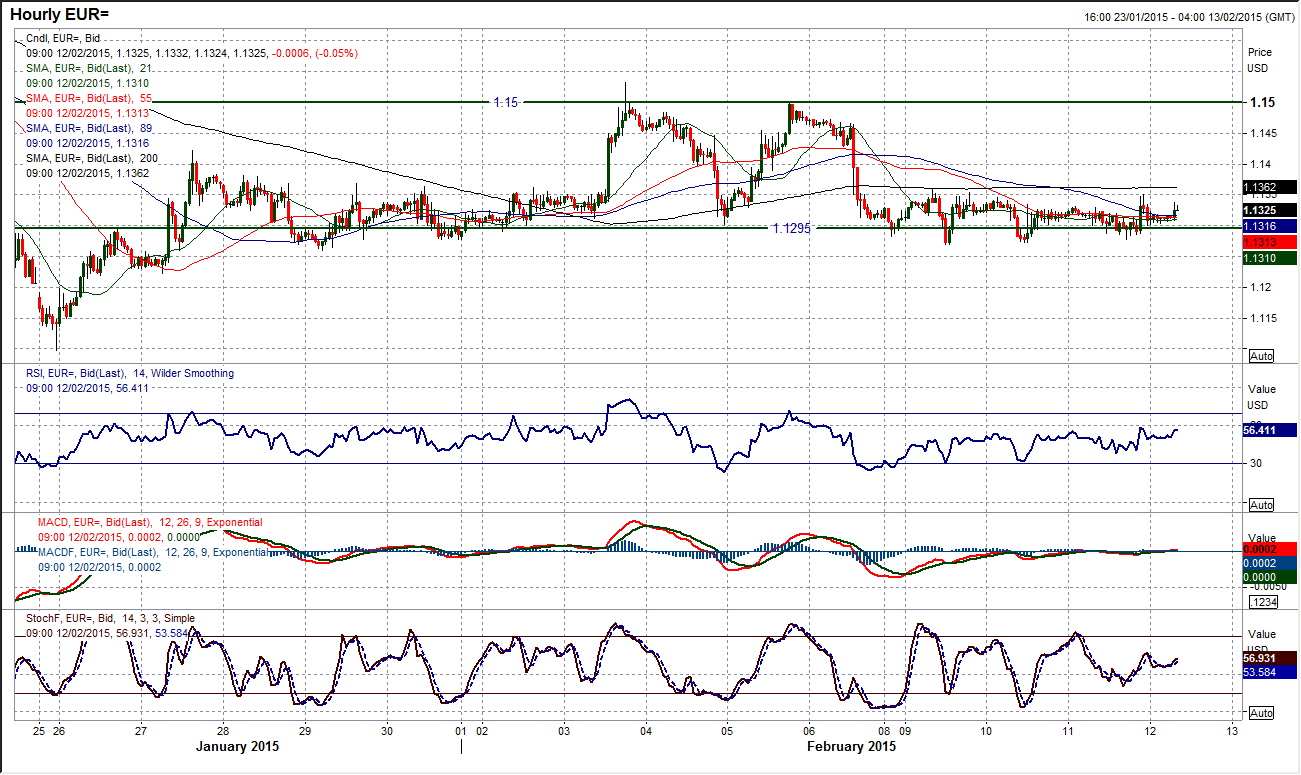
So it looks like the consolidation continues for the euro as a third small doji candle has been left with the rate still finding support in the band $1.1260/$1.1300. In terms of direction we are none the wiser following yesterday’s price action. There has been very little direction over the last few days and momentum indicators are becoming increasingly neutral on the hourly chart, whilst the daily chart also shows rather benign signals. The 21 day moving average (now $1.1395) which provided resistance last week on the daily chart is now close once more and could have a part to play, but it is becoming clear that EUR/USD is consolidating and waiting for a fundamental driver. With the talks in the Eurogroup over Greece’s debt coming to nothing and now delayed until Monday again, this will not help to give traders direction. There is still intraday resistance at $1.1360.
GBP/USD
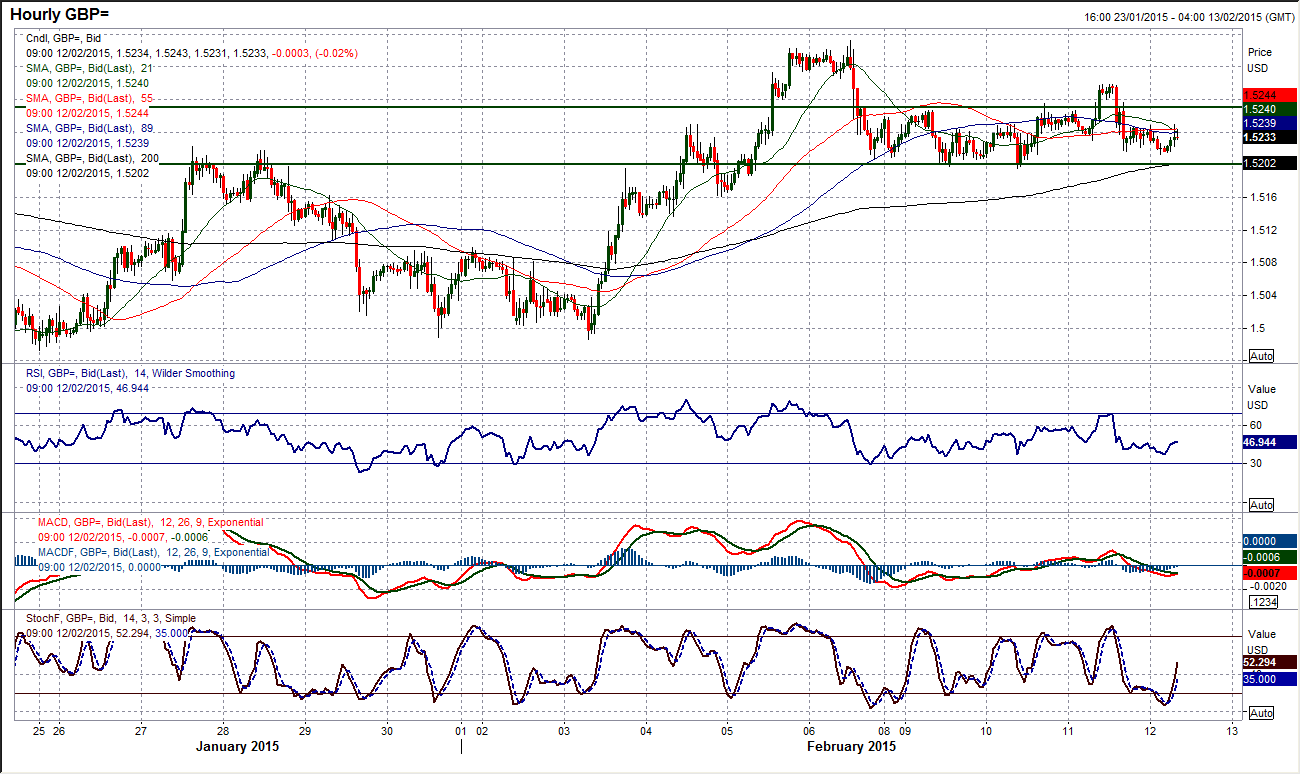
The euro is not the only major that is searching for direction, with sterling failing once more to gain upside traction. Another attempt was seen yesterday to try to pull clear of the 7 month downtrend but again the bulls were reined in. The intraday hourly chart showed an initial break above $1.5270 which had formed a near term ceiling, only for the break to be retraced and once more the support around $1.5200 is being tested. This remains the key support for Cable and needs to hold to prevent a bearish drift back towards $1.5135. I remain reasonably confident that the base pattern is intact, but I am mindful that the bulls appear unable to get a serious foothold in the recovery. Once more we are back into a wait and see mode. Today’s Bank of England Quarterly Inflation Report could hold the key.
USD/JPY
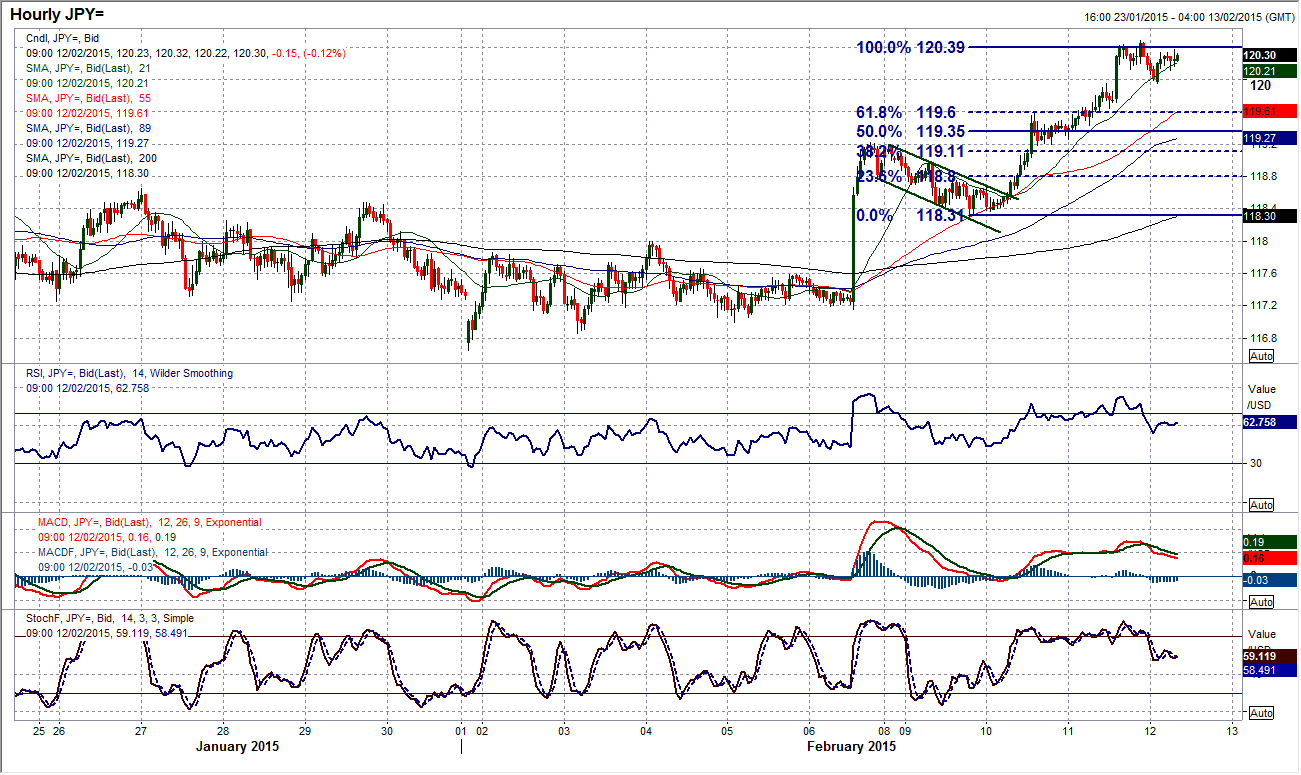
The near term bull flag on Dollar/Yen has worked almost in a text book fashion. The breakout above 119.22 completed the pattern and implied upside towards 120.40 which has been hit in the past 12 hours only to be followed by a consolidation at that target. The daily chart shows that 120.00 is a near term resistance and having broken through it should now mean a move towards a test of the key reaction high at 120.82. There may though be a near term consolidation to deal with first as the hourly momentum indicators have just dropped away and the rising 21 hour moving average which has flanked the run higher as a basis of support is now coming under threat. I would be looking to use any near term dips as a chance to sell. There is a support band now between 119.60/120.00 that could be used.
Gold
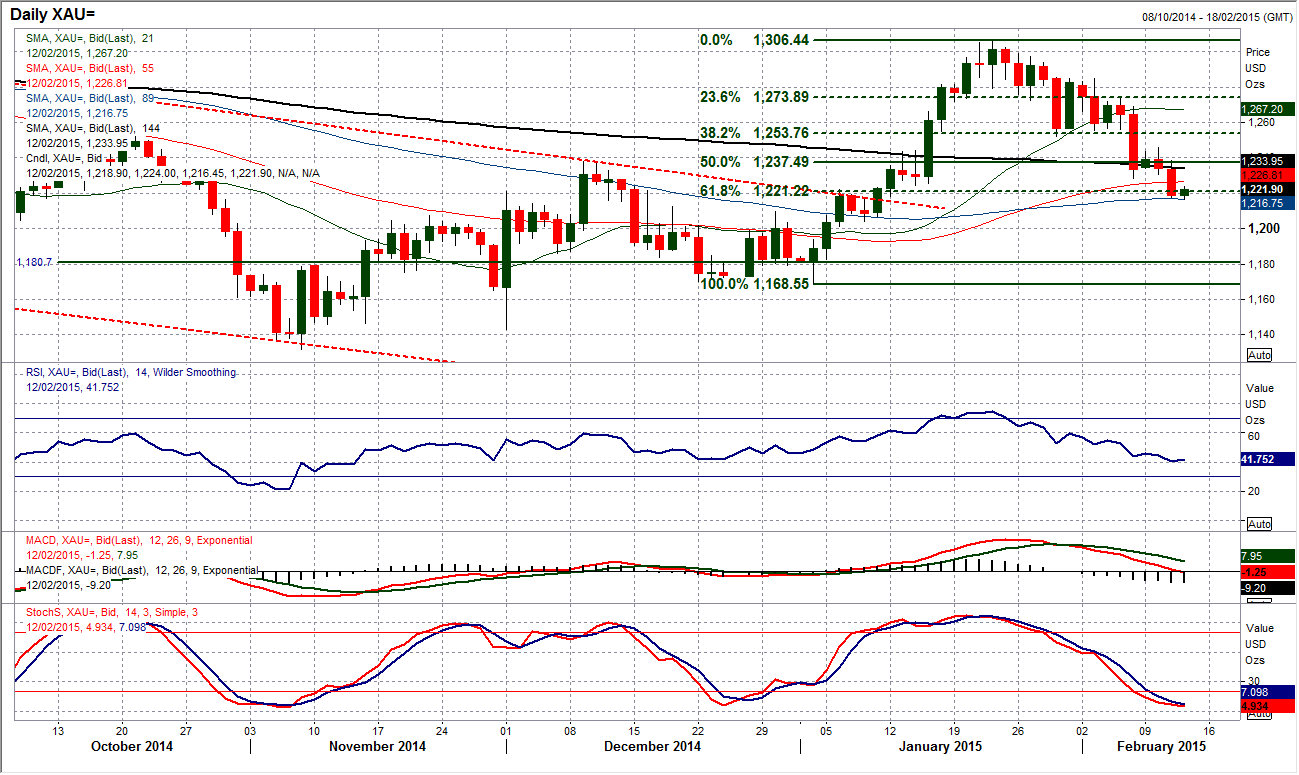
The gold price once more lost intraday support yesterday as the near term correction is now on the brink of becoming something more significant. I have been talking about the support at $1221/$1222 being the final line between this being a correction within the medium term bull run and turning more bearish. Gold is now on the brink today as this support is being severely tested. I am therefore close to turning bearish again. There has been an acceleration away from the near term downtrend which currently comes in around $1257 and the resistance levels come in at $1228.25 and then up at $1245.80. A breach of support at $1221.40 which was the 6th January high but also takes gold below the 61.8% Fibonacci retracement (around $1222) of $1168/$1306 means that the bulls would have lost control and decline towards the reaction low at $1204.30 is the next area of support.
WTI Oil
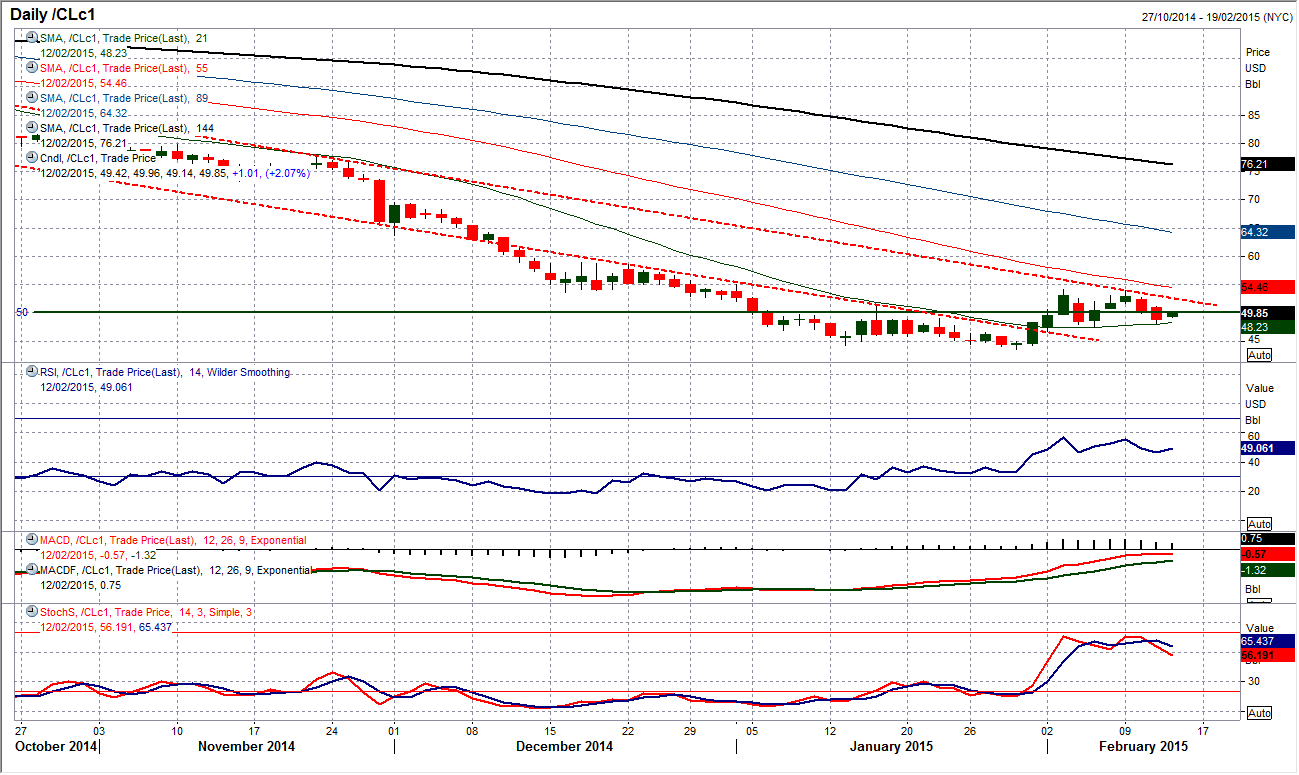
The choppy consolidation continues .On the intraday hourly chart, now the reaction low at $49.85 has been broken (both price support and the 23.6% Fibonacci projection level of the bull run $43.58/$$54.24 measured from $47.36), the near term outlook suggests that that bearish pressure is back in play and there could be further correction back towards the low at $47.36. Intraday hourly technical indicators are now more negative and with the hourly momentum indicators in weak configuration near term rallies are increasingly being seen as a chance to sell. Interestingly though, looking at the daily chart, the 21 day moving average (at $48.30) is becoming the basis of support having previously been the basis of resistance during the big sell-off. The resistance from the big downtrend today comes in at $52.60 and is still the overhead barrier to gains.
Note: All information on this page is subject to change. The use of this website constitutes acceptance of our user agreement. Please read our privacy policy and legal disclaimer. Opinions expressed at FXstreet.com are those of the individual authors and do not necessarily represent the opinion of FXstreet.com or its management. Risk Disclosure: Trading foreign exchange on margin carries a high level of risk, and may not be suitable for all investors. The high degree of leverage can work against you as well as for you. Before deciding to invest in foreign exchange you should carefully consider your investment objectives, level of experience, and risk appetite. The possibility exists that you could sustain a loss of some or all of your initial investment and therefore you should not invest money that you cannot afford to lose. You should be aware of all the risks associated with foreign exchange trading, and seek advice from an independent financial advisor if you have any doubts.
Recommended Content
Editors’ Picks
EUR/USD climbs to 10-day highs above 1.0700

EUR/USD gained traction and rose to its highest level in over a week above 1.0700 in the American session on Tuesday. The renewed US Dollar weakness following the disappointing PMI data helps the pair stretch higher.
GBP/USD extends recovery beyond 1.2400 on broad USD weakness

GBP/USD gathered bullish momentum and extended its daily rebound toward 1.2450 in the second half of the day. The US Dollar came under heavy selling pressure after weaker-than-forecast PMI data and fueled the pair's rally.
Gold struggles around $2,325 despite broad US Dollar’s weakness

Gold reversed its direction and rose to the $2,320 area, erasing a large portion of its daily losses in the process. The benchmark 10-year US Treasury bond yield stays in the red below 4.6% following the weak US PMI data and supports XAU/USD.
Here’s why Ondo price hit new ATH amid bearish market outlook Premium

Ondo price shows no signs of slowing down after setting up an all-time high (ATH) at $1.05 on March 31. This development is likely to be followed by a correction and ATH but not necessarily in that order.
Germany’s economic come back

Germany is the sick man of Europe no more. Thanks to its service sector, it now appears that it will exit recession, and the economic future could be bright. The PMI data for April surprised on the upside for Germany, led by the service sector.
