![]() LikesMoney
LikesMoney
Independent Analyst
The Dollar:
This week the dollar managed to regain the 50 day MA.
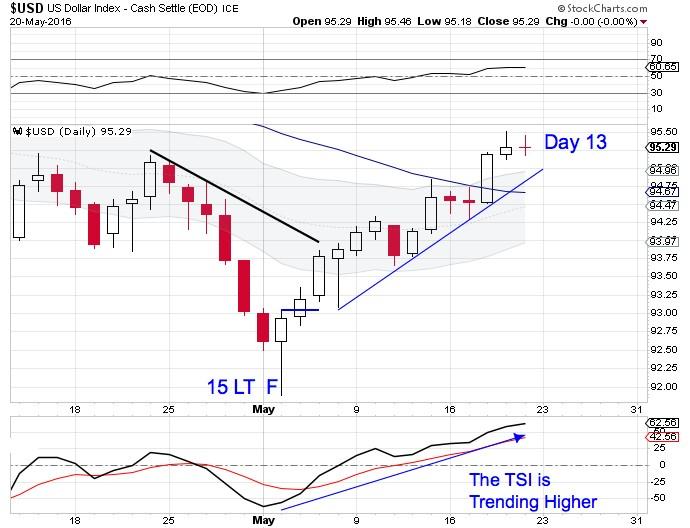
A new high on day 12 shifts the odds towards a right translated cycle formation. The dollar closed convincingly above the upper daily cycle band to signal that the intermediate cycle low has been set. Also by closing above the upper daily cycle band signals that the dollar has begun a new daily uptrend.
The close above the upper daily cycle band indicates that the dollar is in a new intermediate cycle. A close above the declining trend line will provide final confirmation.
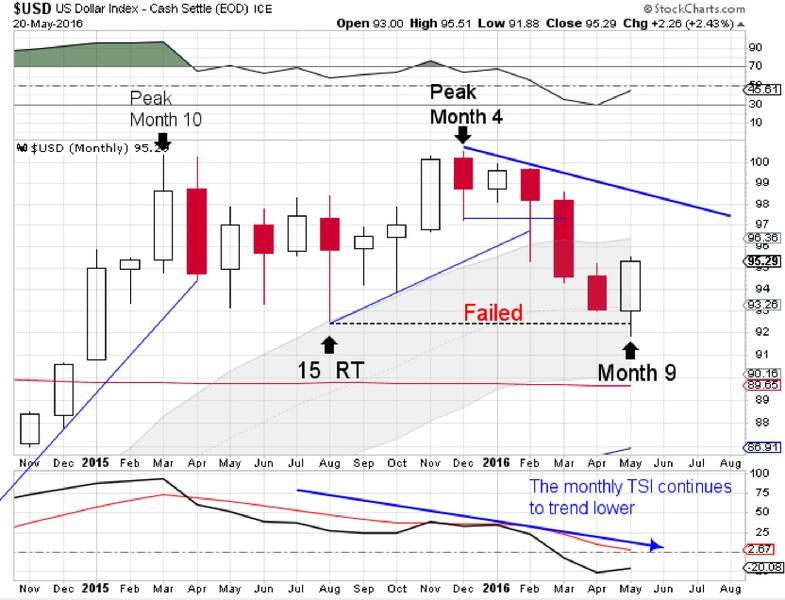
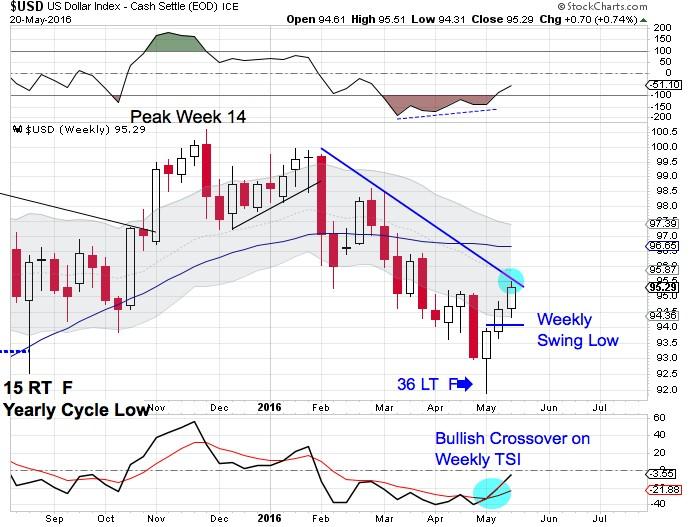
May is month 9 for the yearly dollar cycle. This places the dollar in its timing band to form a yearly cycle low. Since the dollar has printed a lower low in May, the earliest a monthly swing low can form is in June. Once a monthly swing low forms that will signal a new yearly cycle.
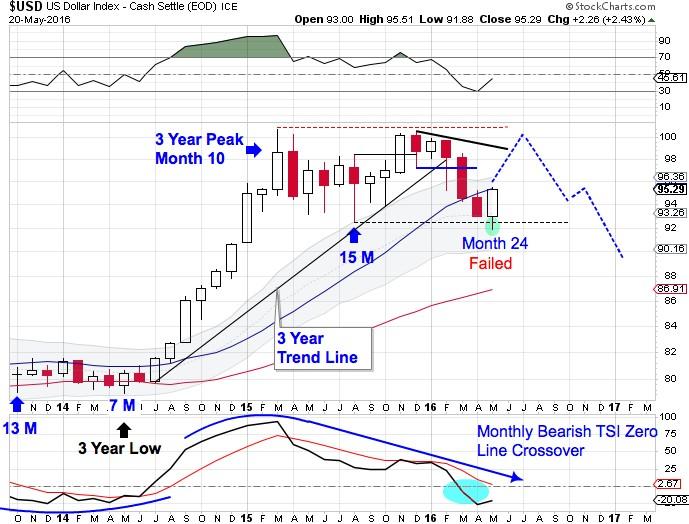
The dollar has broke below the 3 year cycle trend line and formed a failed yearly cycle. This confirms that the dollar has begun its 3 year cycle decline. It also looks like May will mark the yearly cycle low. I expect that we will see the dollar rally and that this new yearly cycle peak by month 4, and then rollover into the final 3 year cycle decline.
Stocks:
The daily equity cycle peaked on day 47, formed a daily swing high and then began its daily cycle decline.
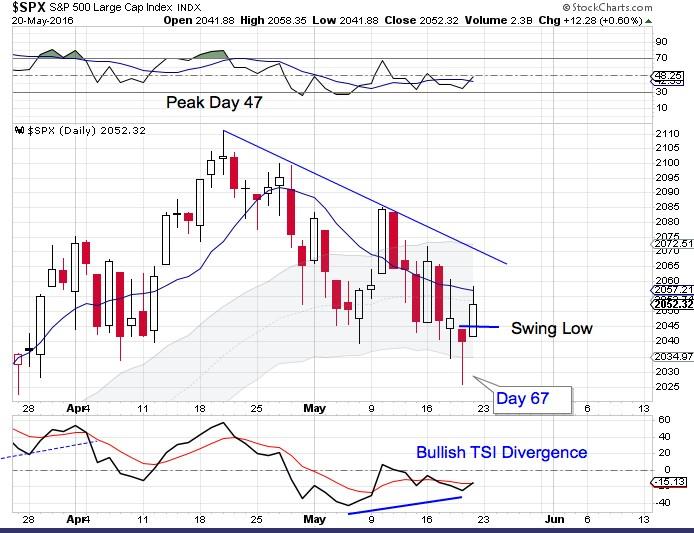
Stocks printed their lowest point on Thursday, day 67. This places stocks very deep in its timing band for a daily cycle low. The swing low on Friday has good odds of forming the daily cycle low. We still need to see a break of the declining trend line before we can label day 67 as the daily cycle low.
And if Thursday did host the daily cycle low, then stocks would have remained above the lower daily cycle band. Which means that stocks have remained in their daily uptrend. Stocks will continue in their daily uptrend until they close below the lower daily cycle band.
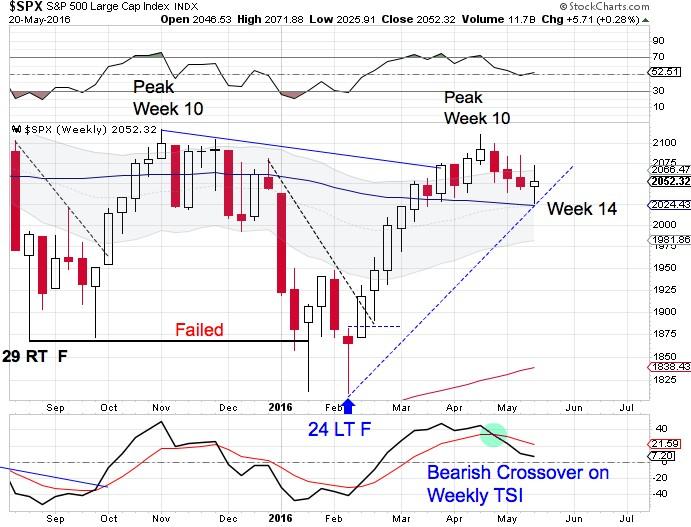
Stocks peaked on week 10 then formed a weekly swing high. But since stocks remain above the 50 week MA their is still a chance that stocks could form a weekly swing to set the intermediate cycle trend line. If Thursday is confirmed as the daily cycle low that will allow us to draw the intermediate trend line.
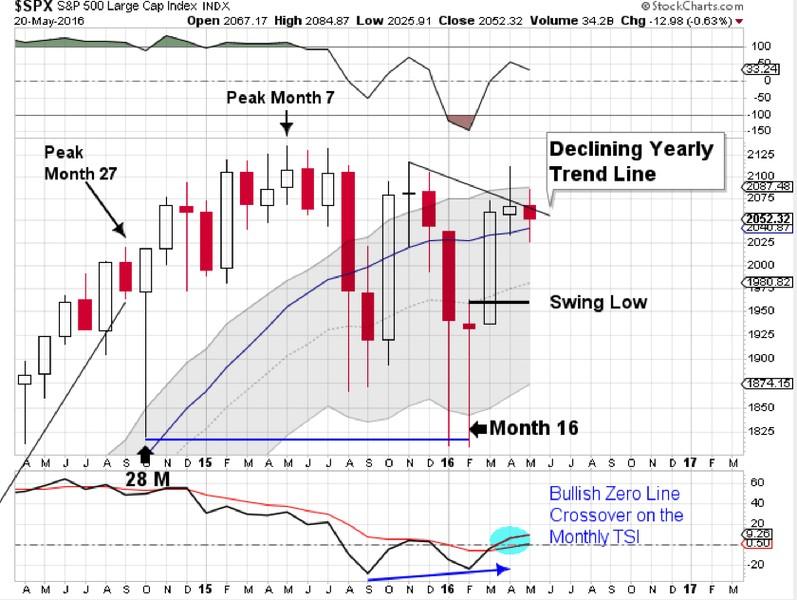
The yearly equity cycle peaked last May, which was month 7. Then stocks entered a period of volatility as they declined into their yearly cycle low. Stocks broke below the previous yearly cycle low on January, which confirmed the 7 year cycle decline. Then stocks printed a lower low in February. The swing low that formed in March signaled that February hosted the yearly cycle low. The break above the declining monthly trend line confirms that February was the yearly cycle low and indicates that stocks are also leaving behind their 7 year cycle low.
Note: All information on this page is subject to change. The use of this website constitutes acceptance of our user agreement. Please read our privacy policy and legal disclaimer. Opinions expressed at FXstreet.com are those of the individual authors and do not necessarily represent the opinion of FXstreet.com or its management. Risk Disclosure: Trading foreign exchange on margin carries a high level of risk, and may not be suitable for all investors. The high degree of leverage can work against you as well as for you. Before deciding to invest in foreign exchange you should carefully consider your investment objectives, level of experience, and risk appetite. The possibility exists that you could sustain a loss of some or all of your initial investment and therefore you should not invest money that you cannot afford to lose. You should be aware of all the risks associated with foreign exchange trading, and seek advice from an independent financial advisor if you have any doubts.
Recommended Content
Editors’ Picks
EUR/USD regains traction, recovers above 1.0700

EUR/USD regained its traction and turned positive on the day above 1.0700 in the American session. The US Dollar struggles to preserve its strength after the data from the US showed that the economy grew at a softer pace than expected in Q1.
GBP/USD returns to 1.2500 area in volatile session

GBP/USD reversed its direction and recovered to 1.2500 after falling to the 1.2450 area earlier in the day. Although markets remain risk-averse, the US Dollar struggles to find demand following the disappointing GDP data.
Gold climbs above $2,340 following earlier drop

Gold fell below $2,320 in the early American session as US yields shot higher after the data showed a significant increase in the US GDP price deflator in Q1. With safe-haven flows dominating the markets, however, XAU/USD reversed its direction and rose above $2,340.
XRP extends its decline, crypto experts comment on Ripple stablecoin and benefits for XRP Ledger

Ripple extends decline to $0.52 on Thursday, wipes out weekly gains. Crypto expert asks Ripple CTO how the stablecoin will benefit the XRP Ledger and native token XRP.
After the US close, it’s the Tokyo CPI

After the US close, it’s the Tokyo CPI, a reliable indicator of the national number and then the BoJ policy announcement. Tokyo CPI ex food and energy in Japan was a rise to 2.90% in March from 2.50%.