EUR/USD Current Price: 1.1400
View Live Chart for the EUR/USD
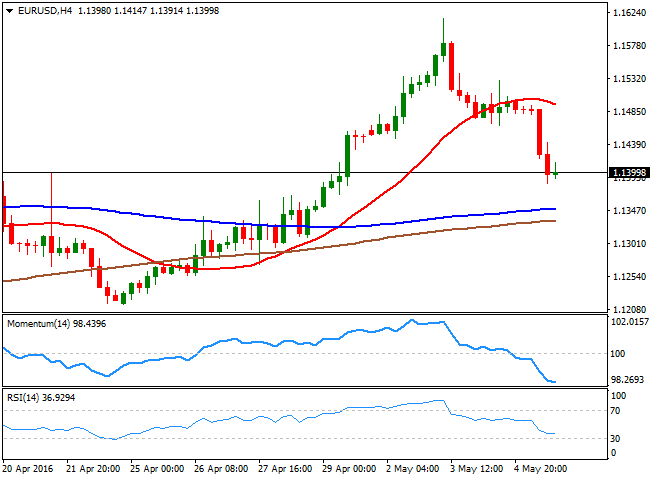
The EUR/USD pair edged sharply lower for third consecutive day, falling down to 1.1385 before settling around the 1.1400 figure. Stocks open generally higher in the region, although volumes were closed as France and German markets were close on holidays. The USD extended its advance during the US session, despite US initial jobless claims climbed 17,000 to 274,000 in the week ended Apr 29, the Labor Department said Thursday, above the 260,000 expected. However, claims remained near historically low levels, which is consistent with a strengthening job market.
Japan will resume activity after a three-day holiday, although the reaction may be limited ahead of the release of the US Nonfarm Payroll report early Friday. Data has been quite mixed in the US, with some positive notes in jobs creation, but limited wages' growth, this last, probably the sub-component that will define how the greenback will end the week. A solid job's report, with wages posting some interesting advances can spark near-term dollar's gains, yet if they can be sustainable in time is yet to be seen.
From a technical point of view, the pair moved from extremely overbought to extremely oversold in three days, according to the 4 hours chart technical readings, with the price now well below its 20 SMA, and nearing the 100 and 200 SMAs, posting limited advances in the 1.1300/30 region. The main support for the upcoming session is the 1.1380 level, which if it's broken with the report, can see the decline extending. The pair needs to regain the 1.1460 level on the other hand, to be able to resume its bullish trend, and end the week above the 1.1500 figure.
Support levels: 1.1380 1.1330 1.1290
Resistance levels: 1.1420 1.1460 1.1500
EUR/JPY Current price: 122.25
View Live Chart for the EUR/JPY
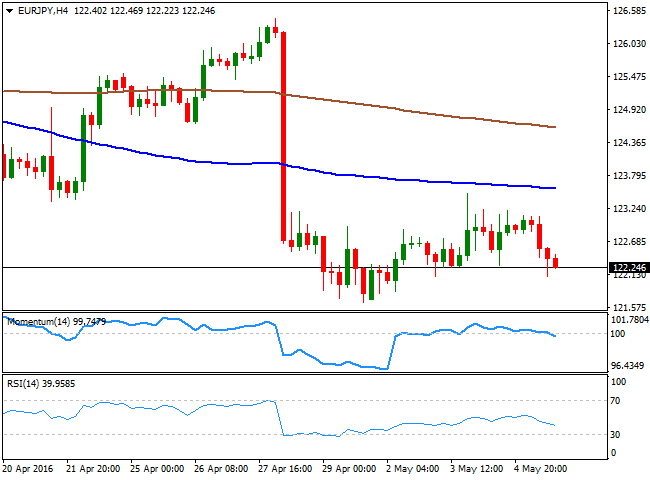
The EUR/JPY pair edged lower, weighed by the common currency's weakness, as the Japanese Yen remained lifeless, due to Japan holiday's and the looming US employment report. The pair erased all of its weekly gains that anyway were quite limited, and trades a few pips above Friday's close, with a slightly negative tone in the short term, given that in the 1 hour chart, the technical indicators head modestly lower within bearish territory, but with no certain strength, whilst the price is back below a horizontal 100 SMA. in the 4 hours chart, the overall bearish tone prevails, as the Momentum indicator turned south around its mid-line, while the RSI indicator accelerated its decline and currently stands at 40.
Support levels: 122.10 121.65 121.10
Resistance levels: 122.60 123.00 123.45
GBP/USD Current price: 1.4471
View Live Chart for the GBP/USD
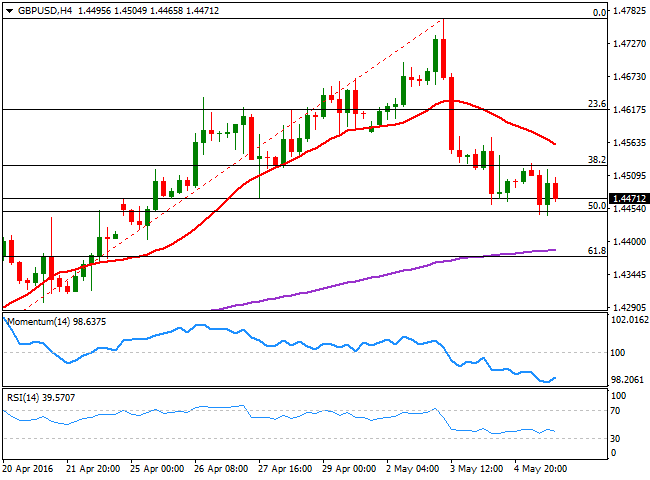
The GBP/USD pair extended its decline down to 1.4443 this Thursday, finding short term buying interest around the 50% retracement of its bullish run between 1.4171 and 1.4769. In fact, the pair traded well-limited by Fibonacci levels, as sellers contained intraday rallies around 1.4515, the 38.2% retracement of the same rally. Data from the UK kept disappointing as the final reading of April Markit services PMI came in at 52.3, in line with market's belief of a low start of Q2 growth, and near a three-year low. Ahead of the release of the US Nonfarm Payroll report, the technical picture favors additional declines in the pair, as in the 4 hours chart, the 20 SMA extended its decline above the current level, and stands now around 1.4560, while the RSI indicator has turned south around 39, and the Momentum indicator turned slightly higher near oversold levels, all of which maintains the risk towards the downside. The next bearish target on a break below the mentioned daily low is the 1.4370 region the 61.8% retracement of the mentioned rally.
Support levels: 1.4450 1.4410 1.4370
Resistance levels: 1.4520 1.4560 1.4610
USD/JPY Current price: 107.26
View Live Chart for the USD/JPY
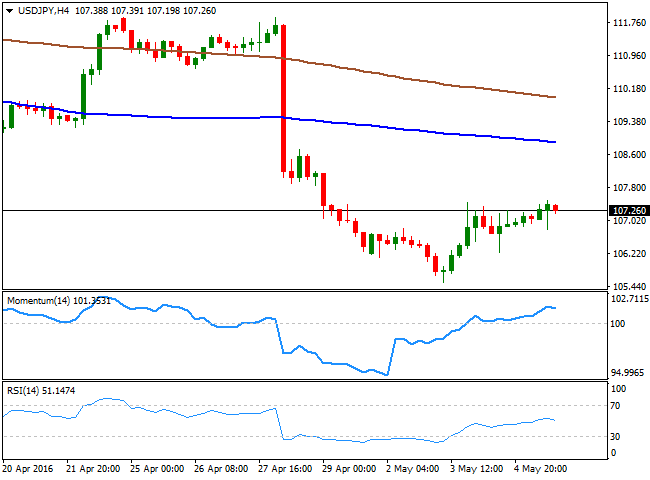
The USD/JPY pair ends the day near a fresh weekly high established in the American afternoon at 107.49, as dollar's demand prevailed for third day in-a-row. Nevertheless, investors remained away from the pair, as Japan holidays generate uncertainty over local policies, and ahead of the US employment report. The pair bottomed at 105.54 this week, its lowest since October 2014, but the level can be re-visited with a disappointing US report. Also, the pair can suffer a downward knee-jerk with the upcoming Tokyo opening, as worldwide stocks fell during the three-day holiday in Japan, suggesting local shares may gap lower to later stabilize. Technically, the 4 hours chart shows that the price remains far below its moving averages, whilst the technical indicators are losing upward strength within positive territory, indicating the absence of buying interest at this time of the day, but not enough to support a downward move. A break below 106.60 is what it takes to confirm additional declines this Friday, back towards the mentioned multi-year low.
Support levels: 106.95 106.60 106.20
Resistance levels: 107.45 107.90 108.30
AUD/USD Current price: 0.7460
View Live Chart for the AUD/USD
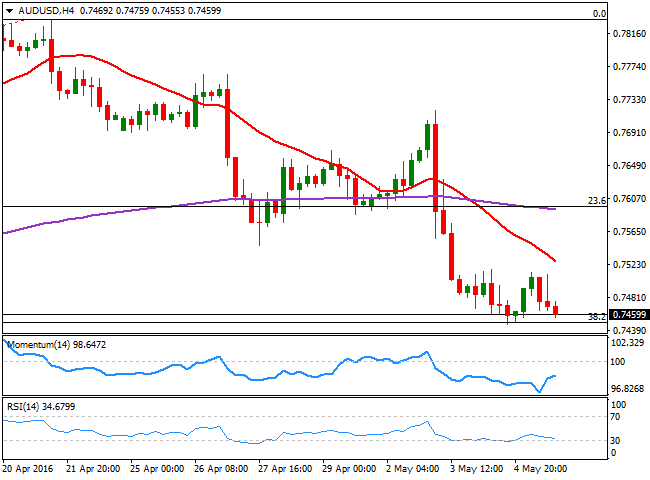
The Aussie enjoyed of some nice demand at the beginning of the day, underpinned by quite encouraging data coming from Australia. The Trade Balance for March showed a much-narrower deficit than expected by printing-A$2.2b against –A$2.9b previous, while Retail Sales in the same month, surged by 0.4% against a 0.3% advance expected. New home sales were also better-than-expected, up by 8.9%. The AUD/USD pair advanced up to 0.7513, but broad dollar's strength and another decline in commodity prices finally took its toll on the pair and sent it back towards the weekly low. Now trading a few pips above 0.7446, and the 38.2% retracement of this year's rally, the overall technical picture is bearish for the pair, as the price remains well below a bearish 20 SMA, while the technical indicators have posted tepid recoveries from oversold levels before losing directional strength within negative territory. A downward acceleration through the mentioned support area should see the pair extending its decline towards 0.7250, as strong long term static support.
Support levels: 0.7450 0.7415 0.7370
Resistance levels: 0.7510 0.7560 0.7600
Information on these pages contains forward-looking statements that involve risks and uncertainties. Markets and instruments profiled on this page are for informational purposes only and should not in any way come across as a recommendation to buy or sell in these assets. You should do your own thorough research before making any investment decisions. FXStreet does not in any way guarantee that this information is free from mistakes, errors, or material misstatements. It also does not guarantee that this information is of a timely nature. Investing in Open Markets involves a great deal of risk, including the loss of all or a portion of your investment, as well as emotional distress. All risks, losses and costs associated with investing, including total loss of principal, are your responsibility. The views and opinions expressed in this article are those of the authors and do not necessarily reflect the official policy or position of FXStreet nor its advertisers. The author will not be held responsible for information that is found at the end of links posted on this page.
If not otherwise explicitly mentioned in the body of the article, at the time of writing, the author has no position in any stock mentioned in this article and no business relationship with any company mentioned. The author has not received compensation for writing this article, other than from FXStreet.
FXStreet and the author do not provide personalized recommendations. The author makes no representations as to the accuracy, completeness, or suitability of this information. FXStreet and the author will not be liable for any errors, omissions or any losses, injuries or damages arising from this information and its display or use. Errors and omissions excepted.
The author and FXStreet are not registered investment advisors and nothing in this article is intended to be investment advice.
Recommended Content
Editors’ Picks
EUR/USD clings to daily gains above 1.0650

EUR/USD gained traction and turned positive on the day above 1.0650. The improvement seen in risk mood following the earlier flight to safety weighs on the US Dollar ahead of the weekend and helps the pair push higher.
GBP/USD recovers toward 1.2450 after UK Retail Sales data

GBP/USD reversed its direction and advanced to the 1.2450 area after touching a fresh multi-month low below 1.2400 in the Asian session. The positive shift seen in risk mood on easing fears over a deepening Iran-Israel conflict supports the pair.
Gold holds steady at around $2,380 following earlier spike

Gold stabilized near $2,380 after spiking above $2,400 with the immediate reaction to reports of Israel striking Iran. Meanwhile, the pullback seen in the US Treasury bond yields helps XAU/USD hold its ground.
Bitcoin Weekly Forecast: BTC post-halving rally could be partially priced in Premium

Bitcoin price shows no signs of directional bias while it holds above $60,000. The fourth BTC halving is partially priced in, according to Deutsche Bank’s research.
Week ahead – US GDP and BoJ decision on top of next week’s agenda

US GDP, core PCE and PMIs the next tests for the Dollar. Investors await BoJ for guidance about next rate hike. EU and UK PMIs, as well as Australian CPIs also on tap.