EUR/USD Current Price: 1.1254
View Live Chart for the EUR/USD
The American dollar edged lower on Friday, but close the week generally lower across the board. Turmoil in the financial world is being cause by rising fears of an economic slowdown among major economies, which in the US, mean diminished expectations of further interest rate hikes by the Federal Reserve. In its testimony before the Congress, Janet Yellen reaffirmed its intention to keep rising rates, should the economy bounce back. Her comments were not enough, however, to convince investors, and stocks plummeted to over 1-year lows, with the Dow accumulating over 1,400 points of decline ever since the year started. During the upcoming days, the US will release the Minutes of the latest FOMC meeting, alongside with inflation and manufacturing figures, which if negative, will likely keep the greenback under pressure. Also, ECB's Mario Draghi will testify before an EU Parliament committee, generally expected to present a dovish stance, given latest EUR's strength.
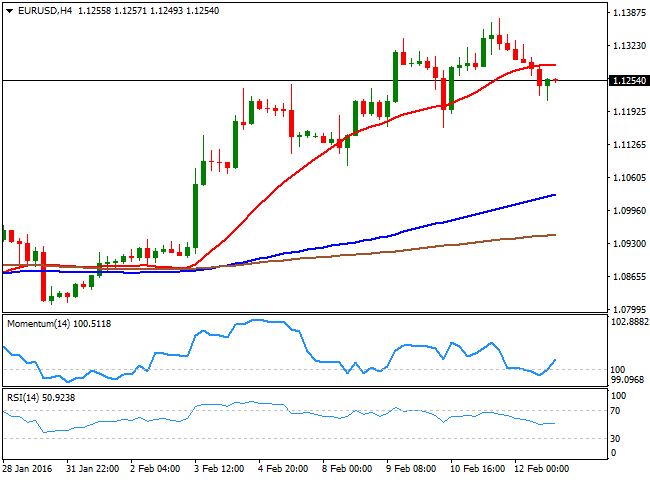
The EUR/USD rallied for a third straight week, reaching 1.1375, its highest since mid October, but retreated towards the mid 1.1250 region on Friday, helped by better-than-expected US Retail Sales data and some profit taking ahead of the weekend. The latest downward corrective movement may extend at the beginning of this week, according to technical readings, given that in the daily chart, the technical indicators have turned lower from oversold territory, and retain their bearish slopes. But in the same chart, the 20 SMA continued advancing beyond the 100 SMA and is about to cross the 200 SMA towards the upside, limiting the downward potential. In the 4 hours chart, the price broke below its 20 SMA, currently around 1.1295 and the immediate resistance, while the Momentum indicator bounced from its 100 level and the RSI consolidates around 50, also help keeping the downside limited.
Support levels: 1.1200 1.1160 1.1120
Resistance levels: 1.1299 1.1335 1.1380
EUR/JPY Current price: 127.50
View Live Chart for the EUR/JPY
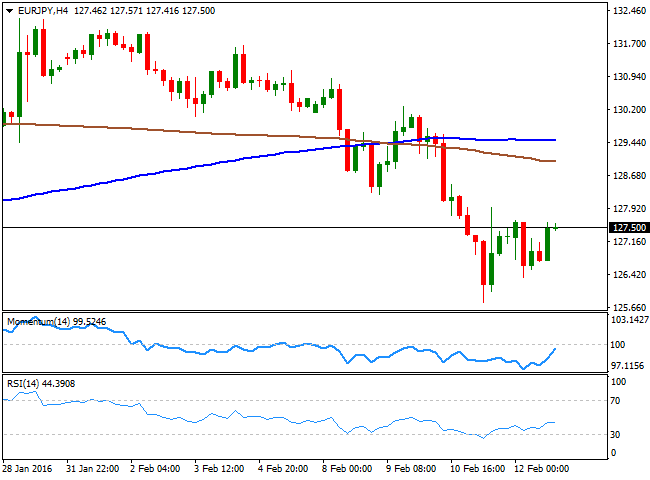
The Japanese edged sharply higher against all of its major rivals last week, as the safe-haven currency benefited from market turmoil, and the EUR/JPY plummeted to 125.76, levels last seen in June 2013, before rumors of a BOJ's intervention helped it bounce back above the 127.00 level. The ground recovered on Friday, however, stalled well below Thursday's high and the daily chart shows that the price stands far below a bearish 20 SMA, that the Momentum indicator heads south within bearish territory and that the RSI hovers around 36, all of which indicates the pair may continue falling this week. Shorter term, the 4 hours chart shows that the technical indicators have already corrected extreme oversold readings, but remain well below their mid-lines, while the price is far below its moving averages. A recovery above 127.95, Thursday's high and the immediate resistance is required to confirm further advances at the beginning of this week.
Support levels: 127.25 126.80 126.30
Resistance levels: 127.95 128.40 128.90
GBP/USD Current price: 1.4507
View Live Chart for the GBP/USD
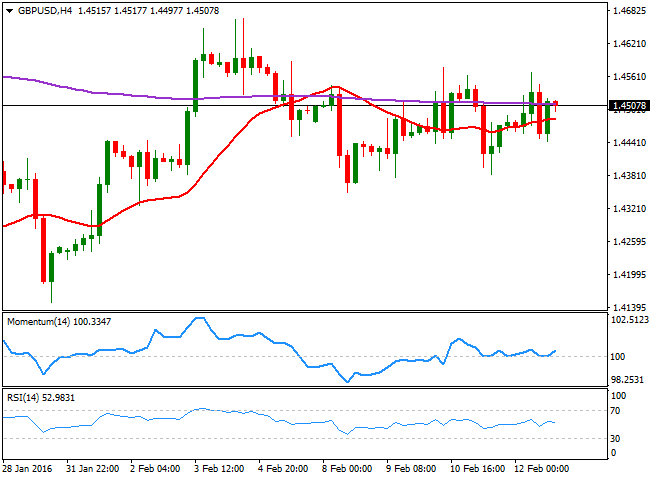
The GBP/USD pair ended the week flat around the 1.4500 level, with the Pound under pressure as the Bank of England has been quite dovish in its latest appearances, and Governor Mark Carney said that now, is no time to raise rates. Adding to the negative case for the British currency are fears of a Brexit, as the latest polls shown a large increase in those favoring a split. Nevertheless, the market is all about dollar's weakness these days, and the technical picture is bullish, as in the daily chart, the pair has been consistently meeting buying interest on approaches to a bullish 20 SMA, whilst the technical indicators head north, firmly above their mid-lines. Sellers, however, have contained advances between 1.4520/60, still the level to beat to confirm a more constructive outlook. Shorter term, the 4 hours chart presents a neutral stance, with the price hovering around its 20 SMA and 200 EMA, both lacking directional strength, while the technical indicators show no directional strength around their mid-lines.
Support levels: 1.4450 1.4400 1.14350
Resistance levels: 1.4525 1.4560 1.4600
USD/JPY Current price: 113.29
View Live Chart for the USD/JPY
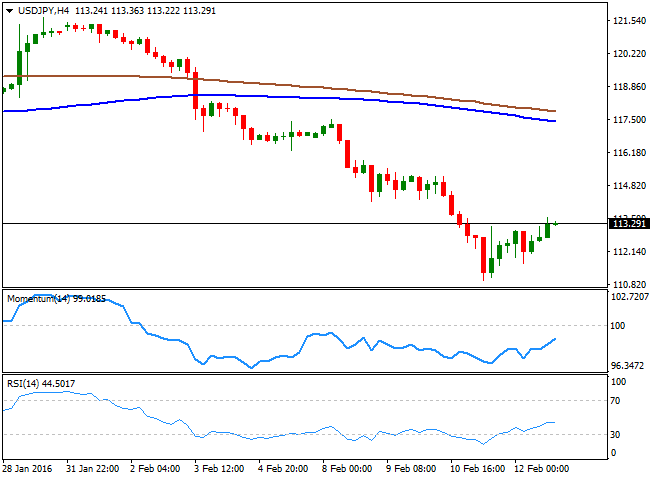
The USD/JPY pair shed over 1,000 pips ever since topping at 121.68 following BOJ's announcement of negative rates, as safe-haven demand favored the Japanese currency. The pair fell down to 110.97 in an overstretched round of panic, when market talks about a probable intervention helped it bounced over 200 pips. There were no official confirmation of BOJ's action on Friday, but speculators believe the Central Bank sold a boatload of currency to halt the bleeding. Anyway, the pair's advance seems barely corrective and the risk remains towards the downside, as in the daily chart, the technical indicators have stalled their sharp declines, but remain in extreme oversold territory, not yet confirming further recoveries. In the 4 hours chart, the technical indicators have also corrected oversold readings, but the RSI indicator has lost its upward strength around 44, whilst the price develops well below its moving averages, indicating limited buying interest at the current levels. Former lows in the 114.20 region provide a critical resistance for the upcoming days, as it will take a steep recovery above it to confirm an interim bottom has taken place.
Support levels: 113.00 112.60 112.10
Resistance levels: 113.80 114.20 114.65
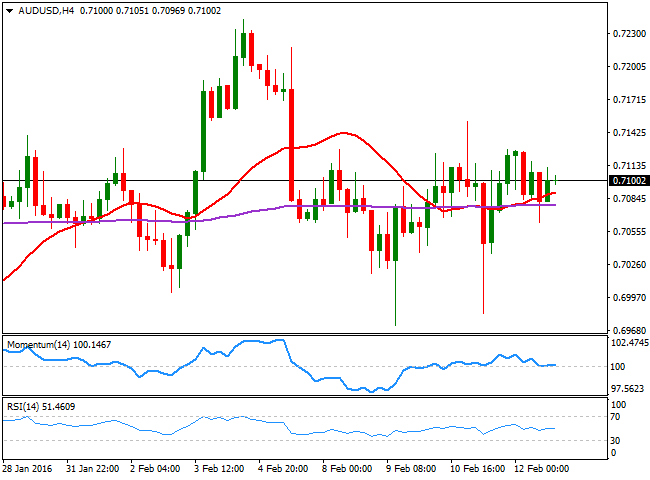
AUD/USD Current price: 0.7100
View Live Chart for the AUD/USD
The Australian dollar was generally lower against most of its rivals, but managed to close the week unchanged against the greenback around 0.7100, as the American currency also had its share of downward pressure. After bottoming at multi-year lows around 0.6820 last October, the commodity-related currency began a recovery that stalled early February, as base metals and oil plummeted on fears of a global slowdown. There will be some macroeconomic definitions coming from Australia this week, with the minutes from February’s RBA policy meeting and January’s employment report are in focus. Minutes had usually little to offer, but employment figures can trigger some price action, particularly if, once again, they surprise to the upside. The AUD/USD pair daily chart shows that the price managed to hold above a bullish 20 SMA, currently around 0.7060 and the immediate support, although the technical indicators have turned south within positive territory, limiting the upward potential. In the 4 hours chart, the pair presents a neutral stance, with the technical indicators stuck around their mid-lines, and the price moving back and forth around horizontal moving averages.
Support levels: 0.7060 0.7030 0.6980
Resistance levels: 0.7135 0.7170 0.7210
Information on these pages contains forward-looking statements that involve risks and uncertainties. Markets and instruments profiled on this page are for informational purposes only and should not in any way come across as a recommendation to buy or sell in these assets. You should do your own thorough research before making any investment decisions. FXStreet does not in any way guarantee that this information is free from mistakes, errors, or material misstatements. It also does not guarantee that this information is of a timely nature. Investing in Open Markets involves a great deal of risk, including the loss of all or a portion of your investment, as well as emotional distress. All risks, losses and costs associated with investing, including total loss of principal, are your responsibility. The views and opinions expressed in this article are those of the authors and do not necessarily reflect the official policy or position of FXStreet nor its advertisers. The author will not be held responsible for information that is found at the end of links posted on this page.
If not otherwise explicitly mentioned in the body of the article, at the time of writing, the author has no position in any stock mentioned in this article and no business relationship with any company mentioned. The author has not received compensation for writing this article, other than from FXStreet.
FXStreet and the author do not provide personalized recommendations. The author makes no representations as to the accuracy, completeness, or suitability of this information. FXStreet and the author will not be liable for any errors, omissions or any losses, injuries or damages arising from this information and its display or use. Errors and omissions excepted.
The author and FXStreet are not registered investment advisors and nothing in this article is intended to be investment advice.
Recommended Content
Editors’ Picks
AUD/USD rises to two-day high ahead of Aussie CPI

The Aussie Dollar recorded back-to-back positive days against the US Dollar and climbed more than 0.59% on Tuesday, as the US April S&P PMIs were weaker than expected. That spurred speculations that the Federal Reserve could put rate cuts back on the table. The AUD/USD trades at 0.6488 as Wednesday’s Asian session begins.
EUR/USD holds above 1.0700 on weaker US Dollar, upbeat Eurozone PMI

EUR/USD holds above the 1.0700 psychological barrier during the early Asian session on Wednesday. The weaker-than-expected US PMI data for April drags the Greenback lower and creates a tailwind for the pair.
Gold price cautious despite weaker US Dollar and falling US yields

Gold retreats modestly after failing to sustain gains despite fall in US Treasury yields, weaker US Dollar. XAU/USD struggles to capitalize following release of weaker-than-expected S&P Global PMIs, fueling speculation about potential Fed rate cuts.
Ethereum ETF issuers not giving up fight, expert says as Grayscale files S3 prospectus

Ethereum exchange-traded funds theme gained steam after the landmark approval of multiple BTC ETFs in January. However, the campaign for approval of this investment alternative continues, with evidence of ongoing back and forth between prospective issuers and the US SEC.
Australia CPI Preview: Inflation set to remain above target as hopes of early interest-rate cuts fade

An Australian inflation update takes the spotlight this week ahead of critical United States macroeconomic data. The Australian Bureau of Statistics will release two different inflation gauges on Wednesday.
