EUR/USD Current Price: 1.1253
View Live Chart for the EUR/USD
The American dollar found some support from FED's Yellen this Wednesday, although her comments were not enough to send it into the green, except against the EUR. In her first day of testimony before the Congress, the US Central Bank's head said that "financial conditions in the United States have recently become less supportive of growth," but she also reiterated that they are ready for further tightening, should economic conditions allow. Despite the less dovish-than-expected stance, the greenback fell during the American afternoon, while stocks trimmed some of their early gains, and oil prices continued declining. Markets however, continue trading on a doom mode over what the future to worldwide economies, and seems that the so long awaited testimony won't be able to affect the ongoing dollar's weakness.
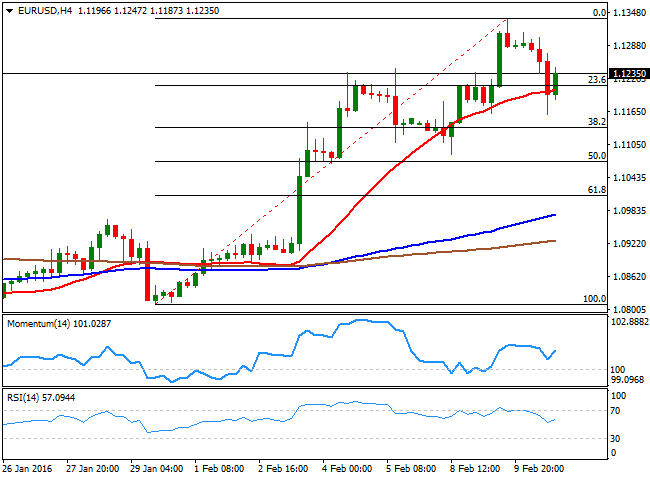
As for the EUR/USD, the pair fell down to 1.1160 before recovering above 1.1200, but is currently unable to rally beyond former highs around 1.1245, the immediate resistance. Nevertheless the technical picture is still bullish, as in the 4 hours chart, the price has quickly recovered above a mild bullish 20 SMA, while the technical indicators resumed their advance within positive territory, after a limited downward corrective move. The line in the sand is the 1.1120 as only below this level the pair can be at risk of further declines. In the meantime, investors are generally targeting the 1.1460 region, a major static resistance that contained the upside for most of this past 2015.
Support levels: 1.1200 1.1160 1.1120
Resistance levels: 1.1245 1.1290 1.1335
EUR/JPY Current price: 128.18
View Live Chart for the EUR/JPY
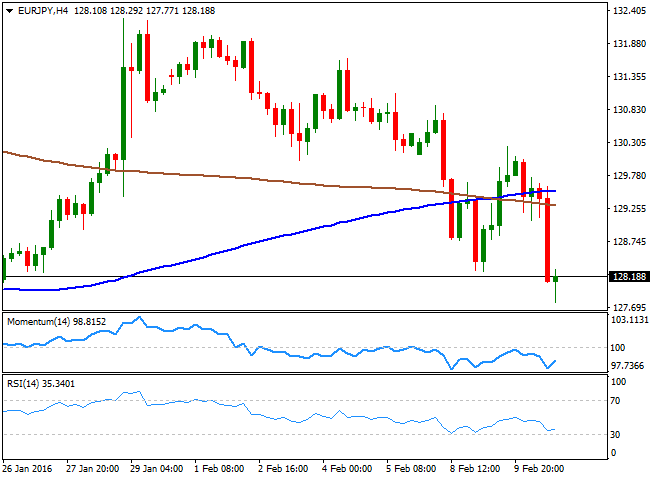
Yen's bulls are dominating all of the Japanese currency crosses, and the EUR/JPY pair plummeted to 127.77 during the American afternoon, now back above the 128.00, but overall bearish. The sharp advance of the JPY over these last few days have triggered some speculation over BOJ's intervention, but nothing beyond verbal at the time being. With a local holiday ahead, the 1 hour chart shows that the price has extended further below its 100 and 200 SMAs, while the technical indicators are posting tepid recoveries from oversold levels, and the price holds below former lows, all of which suggests some consolidation before a new leg south. In the 4 hours chart, the picture is less clear, given that the 100 SMA heads higher above the 200 SMA, both above the current level, while the technical indicators have bounced from near oversold levels.
Support levels: 127.70 127.25 126.80
Resistance levels: 128.40 128.90 129.35
GBP/USD Current price: 1.4500
View Live Chart for the GBP/USD
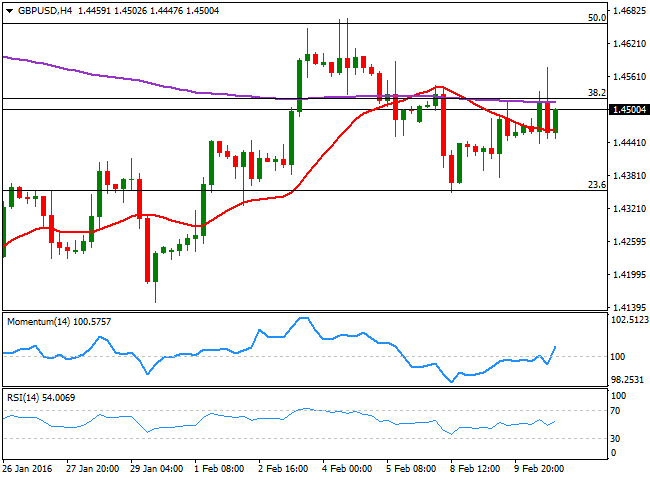
The GBP/USD pair ends the day with gains, in spite of poor industrial output data in the UK released earlier in the day. According to December figures, Britain had its worst quarter in almost three years by the end of 2015, as manufacturing production fell monthly basis by 0.2%, and 1.7% compared to a year before. Industrial production dropped by 1.1% compared to November, and fell by 0.4% on a year-on-year basis. Also, the NIESR GDP estimate showed a 0.4% growth in the three months ending January 2015, after a 0.5% advance in the three months ending in December. The pair trades around the 1.4500 figure after being as high as 1.4577, still meeting intraday selling interest in the 1.4520/30 region, where the pair has the 38.2% retracement of its latest weekly decline. Technically, the 1 hour chart shows that the price is advancing above a mild bullish 20 SMA, while the technical indicators are heading north after bouncing from their mid-lines, supporting some further gains, should the price finally break above the mentioned resistance. In the 4 hours chart, the Momentum indicator head strongly higher, while the 20 SMA has provided short term support ever since the day started, currently at 1.4460.
Support levels: 1.4460 1.4415 1.4370
Resistance levels: 1.4535 1.4580 1.4620
USD/JPY Current price: 113.94
View Live Chart for the USD/JPY
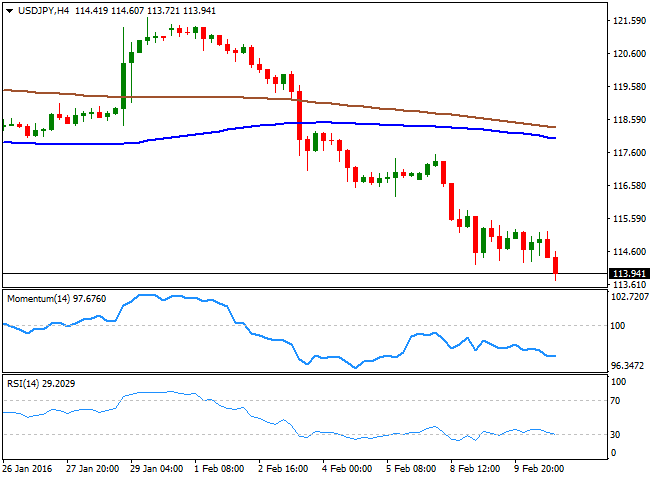
The Japanese yen gained further momentum against all of its major rivals, with the USD/JPY plummeting to 113.72, level last seen early November 2014. The pair attempted to recover ground earlier in the day, advancing up to 115.19 as market talks pointed out that the BOJ was calling interbank dealers to "check prices," a form of verbal intervention that usually helps the pair rising. Nevertheless, the rally was short lived, and this fresh lows are clearly showing that bears are in control. Short term, the technical outlook is still bearish, as the technical indicators have managed to post some upward corrections before resuming their declines, now approaching oversold territory, with a limited downward momentum, while the price continues developing well below its moving averages. In the 4 hours chart, the Momentum indicator hovers with no clear direction well below its mid-line, while the RSI indicator heads south at 29, indicating there's still room for additional declines.
Support levels: 113.75 113.30, 112.90
Resistance levels: 114.20 114.65 115.20
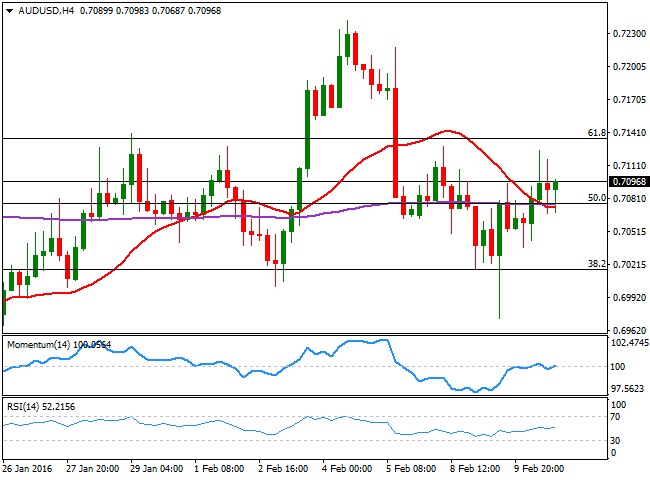
AUD/USD Current price: 0.7098
View Live Chart for the AUD/USD
The AUD/USD pair started the day advancing up to 07124, but failed to consolidate above the level and pulled back at the beginning of the New York session, as the dollar recovered ground across the board following Fed's Yellen testimony before the Congress. Australia will release its consumer inflation expectations for February during the upcoming session, previously at 3.6%. Holding into gains, the pair has a short term bullish tone, as in the 1 hour chart, the price is firmly above a bullish 20 SMA, whilst the technical indicators present upwards slopes above their mid-lines. In the 4 hours chart, the 20 SMA and the 200 EMA providing an immediate support around 0.7070, while the technical indicators aim higher within neutral territory, lacking enough strength to confirm a new leg higher. The pair needs to advance above the 0.7135 region, a Fibonacci resistance, to be able to extend its advance this Thursday.
Support levels: 0.7070 0.7030 0.7000
Resistance levels: 0.7135 0.7170 0.7200
Information on these pages contains forward-looking statements that involve risks and uncertainties. Markets and instruments profiled on this page are for informational purposes only and should not in any way come across as a recommendation to buy or sell in these assets. You should do your own thorough research before making any investment decisions. FXStreet does not in any way guarantee that this information is free from mistakes, errors, or material misstatements. It also does not guarantee that this information is of a timely nature. Investing in Open Markets involves a great deal of risk, including the loss of all or a portion of your investment, as well as emotional distress. All risks, losses and costs associated with investing, including total loss of principal, are your responsibility. The views and opinions expressed in this article are those of the authors and do not necessarily reflect the official policy or position of FXStreet nor its advertisers. The author will not be held responsible for information that is found at the end of links posted on this page.
If not otherwise explicitly mentioned in the body of the article, at the time of writing, the author has no position in any stock mentioned in this article and no business relationship with any company mentioned. The author has not received compensation for writing this article, other than from FXStreet.
FXStreet and the author do not provide personalized recommendations. The author makes no representations as to the accuracy, completeness, or suitability of this information. FXStreet and the author will not be liable for any errors, omissions or any losses, injuries or damages arising from this information and its display or use. Errors and omissions excepted.
The author and FXStreet are not registered investment advisors and nothing in this article is intended to be investment advice.
Recommended Content
Editors’ Picks
AUD/USD failed just ahead of the 200-day SMA

Finally, AUD/USD managed to break above the 0.6500 barrier on Wednesday, extending the weekly recovery, although its advance faltered just ahead of the 0.6530 region, where the key 200-day SMA sits.
EUR/USD met some decent resistance above 1.0700

EUR/USD remained unable to gather extra upside traction and surpass the 1.0700 hurdle in a convincing fashion on Wednesday, instead giving away part of the weekly gains against the backdrop of a decent bounce in the Dollar.
Gold stays firm amid higher US yields as traders await US GDP data

Gold recovers from recent losses, buoyed by market interest despite a stronger US Dollar and higher US Treasury yields. De-escalation of Middle East tensions contributed to increased market stability, denting the appetite for Gold buying.
Ethereum suffers slight pullback, Hong Kong spot ETH ETFs to begin trading on April 30

Ethereum suffered a brief decline on Wednesday afternoon despite increased accumulation from whales. This follows Ethereum restaking protocol Renzo restaked ETH crashing from its 1:1 peg with ETH and increased activities surrounding spot Ethereum ETFs.
Dow Jones Industrial Average hesitates on Wednesday as markets wait for key US data

The DJIA stumbled on Wednesday, falling from recent highs near 38,550.00 as investors ease off of Tuesday’s risk appetite. The index recovered as US data continues to vex financial markets that remain overwhelmingly focused on rate cuts from the US Fed.
