EUR/USD Current Price: 1.1522
View Live Chart for the EUR/USD
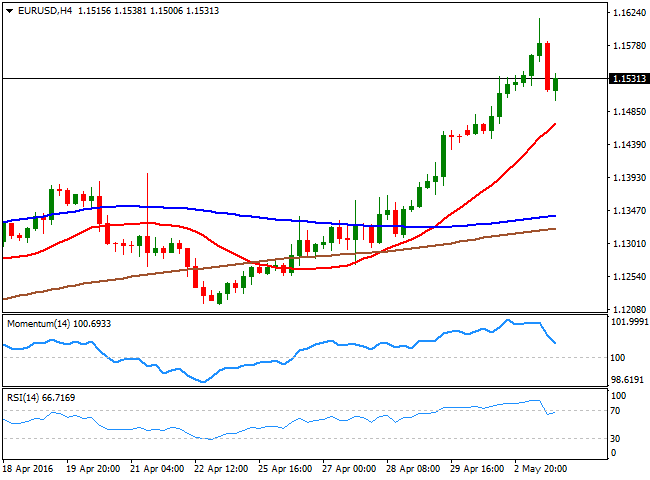
The American dollar fell to fresh yearly lows against most of its major rivals this Tuesday, as poor manufacturing data coming from China revived concerns over a global economic slowdown. European stocks plummeted, closing the day in the red, helping the common currency in surging to a fresh 8-month high of 1.1615 against the dollar. The release of better-than-expected data in Europe fueled demand for the common currency, as in March, industrial producer prices rose by 0.3% in the euro area, following a 0.7% in the previous month. The pair began to ease after the release of poor UK data, which gave the greenback a breath that turned into a strong intraday advance following Wall Street's opening.
The EUR/USD pair fell as low as 1.1500 before finally bouncing, to close the day flat. Nevertheless, the downward knee-jerk seems to have been merely corrective as in the 4 hours chart, the price remains far above a bullish 20 SMA, currently in the 1.1460 region, whilst the RSI indicator is resuming its advance after erasing extreme overbought conditions. Furthermore, and given the recent break above a major resistance, now support at 1.1460, the pair needs now to break below the 1.1380/1.1420 region to negate the ongoing bullish trend. The immediate resistance comes at 1.1565, and an upward extension beyond it should favor a retest of the mentioned high, en route to 1.1713, August 2015 monthly high.
Support levels: 1.1500 1.1460 1.1420
Resistance levels: 1.1565 1.1615 1.1660
EUR/JPY Current price: 122.48
View Live Chart for the EUR/JPY
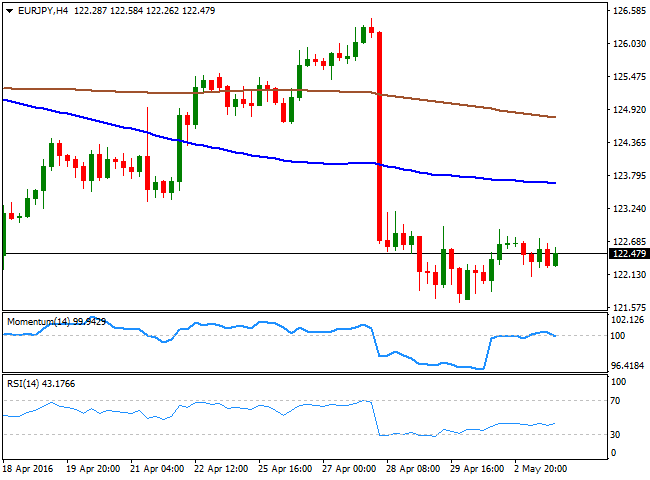
The EUR/JPY pair closed the day slightly lower, mute for the most as both the EUR and the JPY appreciated against the greenback on falling worldwide stocks. The daily chart shows that the technical indicators have recovered within negative territory, but are again turning south below their mid-lines, indicating a bearish sentiment prevails in the pair. Shorter term, the 1 hour chart presents a neutral stance, with the technical indicators flat around their mid-lines, although the 100 SMA continued falling, and stands now around 123.00, acting as an immediate resistance. In the 4 hours chart, the Momentum indicator has turned lower around its 100 level, while the RSI indicator hovers around 42, lacking clear directional strength. The pair needs now to break below 122.10, the daily low, to confirm further declines, eyeing as a first bearish target April low of 121.65.
Support levels: 122.10 121.65 121.30
Resistance levels: 123.00 123.40 122.85
GBP/USD Current price: 1.4549
View Live Chart for the GBP/USD
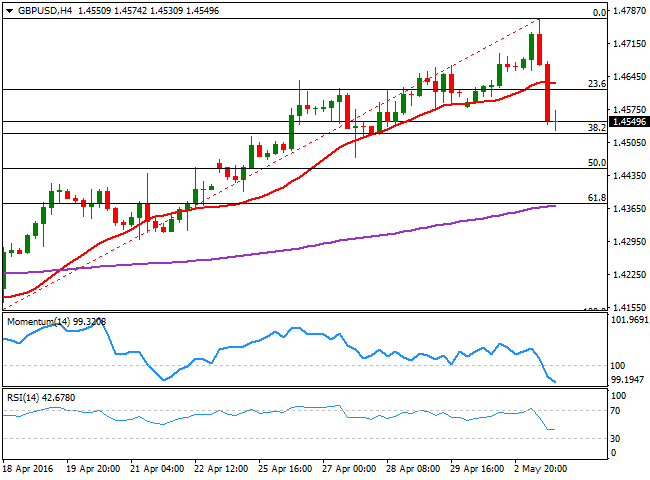
Following an advance to 1.4769, a fresh 4-month high, the GBP/USD pair plunged to 1.4530, with the Pound initially hit by the final revision of the UK April Markit manufacturing PMI that fell below 50.00 for the first time since March 2013, coming in at 49.2. The decline in the pair was later fueled by a sharp comeback of the greenback during the US afternoon, and the pair remains unable to pick up ahead of the Asian opening, trading near the mentioned low at the end of the day. The daily decline stalled a couple of pips above a major support, the 38.2% retracement of the latest bullish run, triggered by easing fears over a Brexit, at 1.4525, now the main support. From a technical point of view, the 4 hours chart supports some further declines as the divergence drew by the Momentum indicator, which started mid last month, got confirmed when the indicator broke below its mid-line. In the same chart, the RSI indicator consolidates at 42, rather reflecting the scarce volume typical of this time of the day than suggesting downward exhaustion, whilst the 20 SMA has turned flat in the 1.4630 region. Renewed selling interest below the mentioned Fibonacci support can see the pair sliding down to the 1.4370 region, the 61.8% retracement of the same rally.
Support levels: 1.4525 1.4480 1.4440
Resistance levels: 1.4585 1.4630 1.4680
USD/JPY Current price: 106.26
View Live Chart for the USD/JPY
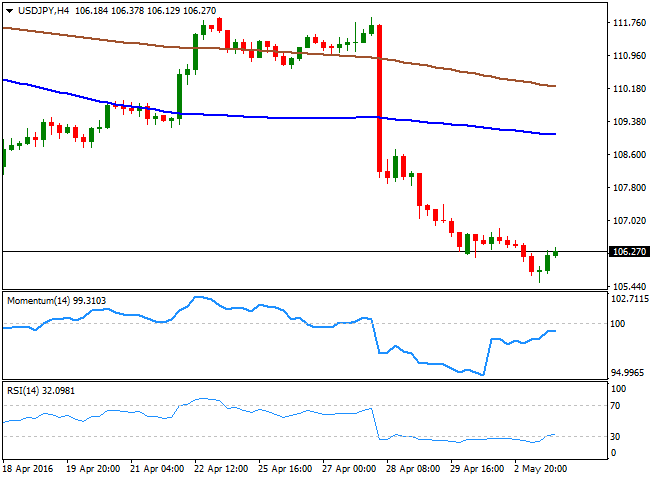
The USD/JPY pair extended its decline down to 105.54 before finally meeting some buying interest, and bounced modestly to close the day a handful of pips above the 106.00 mark. With Japanese markets closed for the Golden Week holidays, chances of a BOJ's intervention are limited, yet the risk of a surprise announced could not be dismissed. In the meantime, market players seem determinate to test BOJ's convictions by pushing the pair towards the 105.00 line in the sand, established a couple of weeks ago, something that should be favored by the continued negative mood. Intraday technical readings maintain the risk towards the downside, given that in the 1 hour chart, the price continues developing well below its 100 and 200 SMAs, with the shortest accelerating its decline and now around 107.50, whilst the technical indicators have corrected extreme oversold readings to end up turning flat within neutral territory, suggesting limited buying interest at current levels. In the 4 hours chart, technical indicators have also lost their upward strength after correcting from oversold territory, but remain well below their mid-lines, in line with a new leg south, particularly if the 106.00 level gives up again.
Support levels: 106.00 105.55 105.20
Resistance levels: 106.60 107.00 107.40
AUD/USD Current price: 0.7486
View Live Chart for the AUD/USD
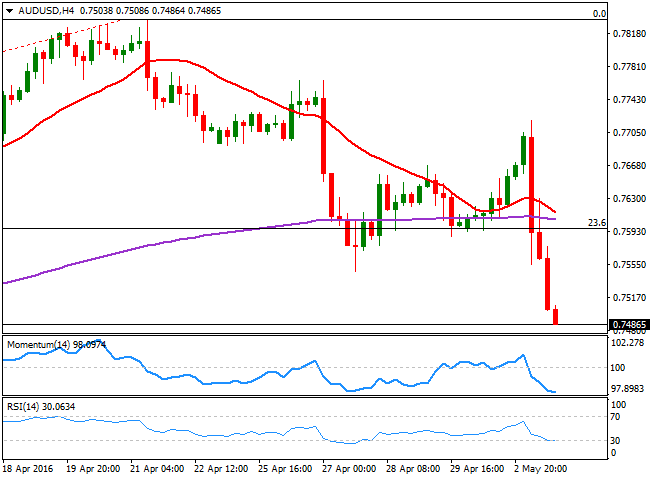
The Aussie is in a free fall ever since the Reserve Bank of Australia cut interest rates by 25bp to a record low of 1.75%, basing the decision on latest inflation readings, as Stevens remarked that "inflation has been quite low for some time and recent data were unexpectedly low,” pointing to a lower outlook for inflation than initially estimated. Also, the RBA's head reiterated his concerns over a strong Aussie that could "complicate" the economy’s transition away from mining investment. The AUD/USD pair traded as high as 0.7718 before plummeting below the 0.7500 mark by the end of the day, now around 0.7488, its lowest since late March. In the 4 hours chart, the price remained capped by a flat 20 SMA, now around 0.7660, while the technical indicators head sharply lower within bearish territory, with room to extend their slides. and supporting a downward continuation, particularly if the ongoing decline extends below 0.7450, the 38.2% retracement of this year's rally, a major support.
Support levels: 0.7450 0.7415 0.7370
Resistance levels: 0.7510 0.7560 0.7600
Information on these pages contains forward-looking statements that involve risks and uncertainties. Markets and instruments profiled on this page are for informational purposes only and should not in any way come across as a recommendation to buy or sell in these assets. You should do your own thorough research before making any investment decisions. FXStreet does not in any way guarantee that this information is free from mistakes, errors, or material misstatements. It also does not guarantee that this information is of a timely nature. Investing in Open Markets involves a great deal of risk, including the loss of all or a portion of your investment, as well as emotional distress. All risks, losses and costs associated with investing, including total loss of principal, are your responsibility. The views and opinions expressed in this article are those of the authors and do not necessarily reflect the official policy or position of FXStreet nor its advertisers. The author will not be held responsible for information that is found at the end of links posted on this page.
If not otherwise explicitly mentioned in the body of the article, at the time of writing, the author has no position in any stock mentioned in this article and no business relationship with any company mentioned. The author has not received compensation for writing this article, other than from FXStreet.
FXStreet and the author do not provide personalized recommendations. The author makes no representations as to the accuracy, completeness, or suitability of this information. FXStreet and the author will not be liable for any errors, omissions or any losses, injuries or damages arising from this information and its display or use. Errors and omissions excepted.
The author and FXStreet are not registered investment advisors and nothing in this article is intended to be investment advice.
Recommended Content
Editors’ Picks
AUD/USD remained bid above 0.6500

AUD/USD extended further its bullish performance, advancing for the fourth session in a row on Thursday, although a sustainable breakout of the key 200-day SMA at 0.6526 still remain elusive.
EUR/USD faces a minor resistance near at 1.0750

EUR/USD quickly left behind Wednesday’s small downtick and resumed its uptrend north of 1.0700 the figure, always on the back of the persistent sell-off in the US Dollar ahead of key PCE data on Friday.
Gold holds around $2,330 after dismal US data

Gold fell below $2,320 in the early American session as US yields shot higher after the data showed a significant increase in the US GDP price deflator in Q1. With safe-haven flows dominating the markets, however, XAU/USD reversed its direction and rose above $2,340.
Bitcoin price continues to get rejected from $65K resistance as SEC delays decision on spot BTC ETF options

Bitcoin (BTC) price has markets in disarray, provoking a broader market crash as it slumped to the $62,000 range on Thursday. Meanwhile, reverberations from spot BTC exchange-traded funds (ETFs) continue to influence the market.
US economy: slower growth with stronger inflation

The dollar strengthened, and stocks fell after statistical data from the US. The focus was on the preliminary estimate of GDP for the first quarter. Annualised quarterly growth came in at just 1.6%, down from the 2.5% and 3.4% previously forecast.