EUR/USD Current Price: 1.1317
View Live Chart for the EUR/USD
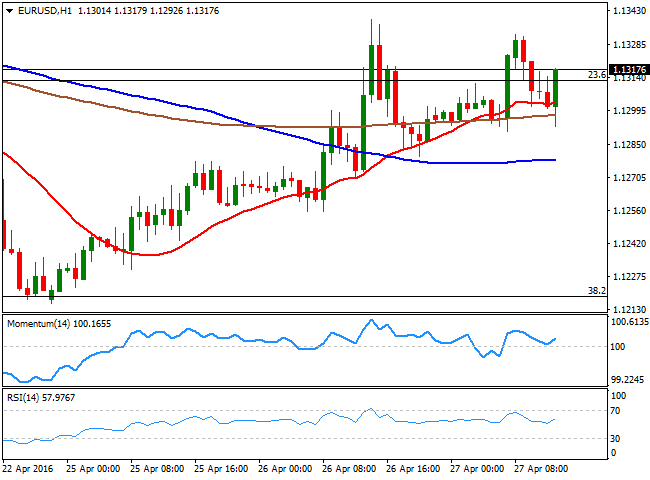
Majors are subject of choppy trading this Wednesday, with all eyes on the FED's economic policy decision later in the American afternoon, followed then by the RBNZ and the BOJ at the beginning of the Asian session. The EUR/USD pair eases from a daily high set early Europe at 1.1332, but continues trading around the 1.1300 figure, supported by some positive data coming from German. The latest GFK survey shows that confidence among local consumers ticked higher for May, printing 9.7 against previous 9.4. Import prices in the country during March fell by less than expected, down by 5.9% compared to a year before, and up 0.7% monthly basis. The US will release some housing data right after Wall Street's opening, but the market will likely wait for the US Central Bank before taking some strong positions.
In the meantime, the EUR/USD pair 1 hour chart shows that the technical indicators have bounced from their mid-lines, whilst the price keeps hovering around a flat 20 SMA. In the 4 hours chart, the pair presents a bullish stance, with the price holding between moving averages, and the Momentum indicator resuming its advance well above the 100 level. At this point is all about the FED, and whether they decide to do on rates in the upcoming future. As hawkish the US Central Bank, the higher the chances of a dollar recovery.
Support levels: 1.1270 1.1230 1.1200
Resistance levels: 1.1340 1.1385 1.1460
GBP/USD Current price: 1.4582
View Live Chart for the GBP/USD
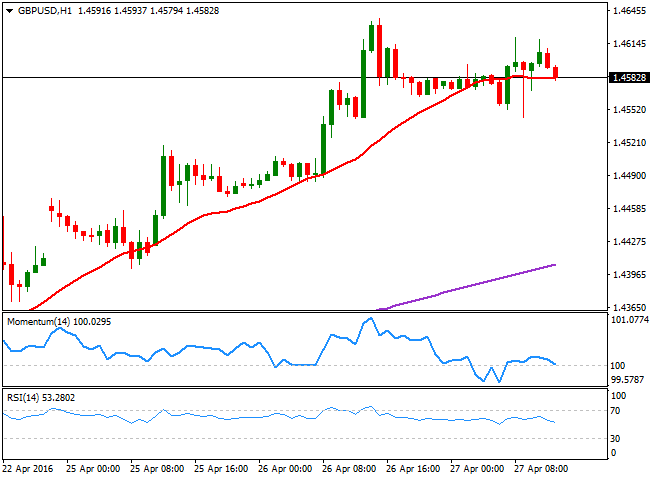
The GBP/USD pair consolidates its weekly gains right below the 1.4600 level, with the Pound having found some demand after the release of the UK Q1 GDP figures. The kingdom grew 0.4% during the first three months of the year as expected, while the year-on-year reading came in at 2.1%, above expectations of a 2.0% advance. Nevertheless, investors have took a step aside ahead of the upcoming Central Banks' events, and the pair was unable to extend beyond the 2-month high posted earlier this week at 1.4637. Technically, the short term picture is neutral, as in the 1 hour chart, the price is hovering around a horizontal 20 SMA, whilst the technical indicators have turned slightly lower within neutral territory. In the 4 hours chart, the technical indicators lack directional strength but remain well into positive territory, whilst the 20 SMA heads sharply higher, now around 1.4505, suggesting buying interest is still strong around the Sterling.
Support levels: 1.4550 1.4505 1.4470
Resistance levels: 1.4610 1.4660 1.4700
USD/JPY Current price: 111.25
View Live Chart for the USD/JPY
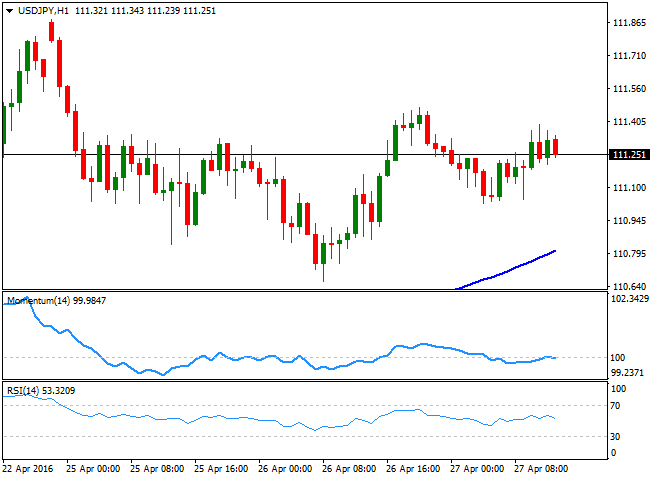
Lifeless ahead of Central Banks' decisions. The USD/JPY pair trades within a 40 pips range ever since the day started, unable to attract investors ahead of the FED and the BOJ's economic policy decisions. The pair has stabilized, however, above the 111.00 figure after a short lived dip to 110.65, a major support level, which suggests the bearish pressure has eased somehow. The latest COT report confirms record short positions for the last month, indicating the market may have finally found an interim bottom. Short term, the 1 hour chart shows that the technical indicators remain directionless within their mid-lines, but also that the price is above its 100 SMA, currently heading north around 110.90, the immediate support. In the 4 hours chart, technical indicators also present a neutral stance, whilst the price is a few pips above a bearish 200 SMA. The pair needs to advance above 111.90 to be able to extend its gains further on a hawkish FED, yet if the US Central Bank disappoints, the pair can plummet below the 110.65 region. The BOJ is largely expected to remain on-hold and therefore the pair can extend its decline below the 110.00 level early Thursday.
Support levels: 110.90 110.65 110.30
Resistance levels: 111.45 111.90 112.30
AUD/USD Current price: 0.7598
View Live Chart for the AUD/USD
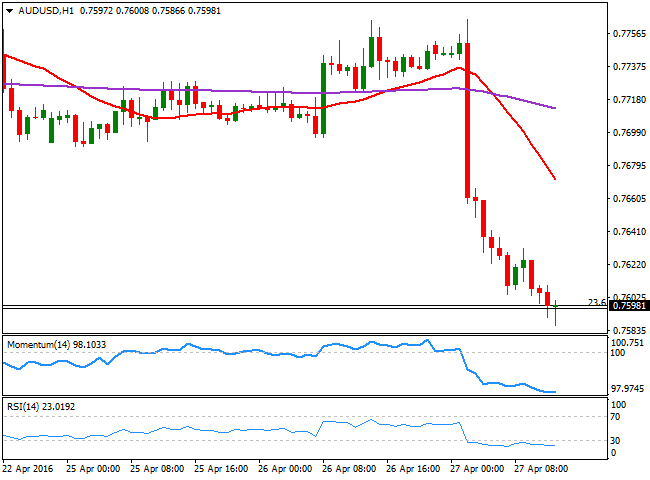
The Aussie plummeted early Asia, following the release of much weaker-than-expected Australian inflation readings for the first quarter of this 2016. The consumer price index fell by 0.2% in the three months to March, whilst the YoY reading resulted at 1.3%, well below the previous 1.7% and the 1.8% expected. The AUD/USD pair plummeted to the 0.7600 region, extending its decline down to 0.7586 early London session. Holding around the 0.7600 figure, the 23.6% retracement of this year rally, the 1 hour chart shows that the technical indicators are beginning to look exhausted towards the downside, but not yet able to confirm a steeper upward corrective move. In the 4 hours chart, the price is well below a bearish 20 SMA, the technical indicators have partially lost their bearish potential within oversold levels, and the price hovers around its 200 EMA, all of which supports additional declines on a break below the mentioned daily low.
Support levels: 0.7580 0.7545 0.7500
Resistance levels: 0.7620 0.7660 0.7695
Information on these pages contains forward-looking statements that involve risks and uncertainties. Markets and instruments profiled on this page are for informational purposes only and should not in any way come across as a recommendation to buy or sell in these assets. You should do your own thorough research before making any investment decisions. FXStreet does not in any way guarantee that this information is free from mistakes, errors, or material misstatements. It also does not guarantee that this information is of a timely nature. Investing in Open Markets involves a great deal of risk, including the loss of all or a portion of your investment, as well as emotional distress. All risks, losses and costs associated with investing, including total loss of principal, are your responsibility. The views and opinions expressed in this article are those of the authors and do not necessarily reflect the official policy or position of FXStreet nor its advertisers. The author will not be held responsible for information that is found at the end of links posted on this page.
If not otherwise explicitly mentioned in the body of the article, at the time of writing, the author has no position in any stock mentioned in this article and no business relationship with any company mentioned. The author has not received compensation for writing this article, other than from FXStreet.
FXStreet and the author do not provide personalized recommendations. The author makes no representations as to the accuracy, completeness, or suitability of this information. FXStreet and the author will not be liable for any errors, omissions or any losses, injuries or damages arising from this information and its display or use. Errors and omissions excepted.
The author and FXStreet are not registered investment advisors and nothing in this article is intended to be investment advice.
Recommended Content
Editors’ Picks
GBP/USD remains on the defensive below 1.2450 ahead of UK Retail Sales data

GBP/USD remains on the defensive near 1.2430 during the early Asian session on Friday. The downtick of the major pair is backed by the stronger US Dollar as the strong US economic data and hawkish remarks from the Fed officials have triggered the speculation that the US central bank will delay interest rate cuts to September.
EUR/USD extends its downside below 1.0650 on hawkish Fed remarks

The EUR/USD extends its downside around 1.0640 after retreating from weekly peaks of 1.0690 on Friday. The hawkish comments from Federal Reserve officials provide some support to the US Dollar.
Gold: Middle East war fears spark fresh XAU/USD rally, will it sustain?

Gold price is trading close to $2,400 early Friday, reversing from a fresh five-day high reached at $2,418 earlier in the Asian session. Despite the pullback, Gold price remains on track to book the fifth weekly gain in a row.
Dogwifhat price pumps 5% ahead of possible Coinbase effect

Dogwifhat price recorded an uptick on Thursday, going as far as to outperform its peers in the meme coins space. Second only to Bonk Inu, WIF token’s show of strength was not just influenced by Bitcoin price reclaiming above $63,000.
Israel vs. Iran: Fear of escalation grips risk markets

Recent reports of an Israeli aerial bombardment targeting a key nuclear facility in central Isfahan have sparked a significant shift out of risk assets and into safe-haven investments.