EUR/USD Current Price: 1.1352
View Live Chart for the EUR/USD
Investors resumed dollar's selling this Tuesday, and the American currency plummeted to fresh multi-month lows against most of its major rivals. The catalyst behind this move was a continued recovery in oil's prices, which fueled risk appetite, and therefore resulted in the USD plummeting. The EUR and the JPY underperformed due to their condition of funding currencies, but the common currency advanced up to the 1.3780 region and closed the day near its high, with solid gains.
Data came in mixed in Europe, and negative in the US, adding to the USD bearish case. The German ZEW survey showed an increase in the economic sentiment for the country, and the region, in April, although the assessment of the current situation fell, indicating that fears of a global economic slowdown persists. US housing data took a turn for the worst, as housing starts fell more than expected in March, plummeting 8.8% to 1.089 million, the lowest since October, whilst building permits declined by 7.7% to a 1.086 million annualized rate.
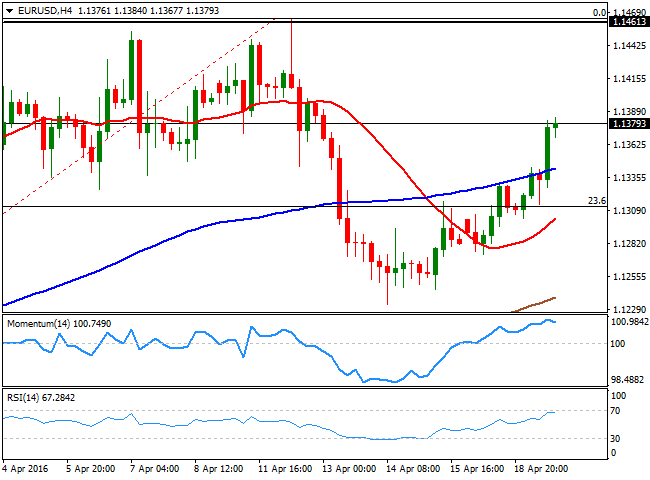
As for the technical outlook of the EUR/USD pair, the lack of upward momentum is present ever since the day started, and continues ahead of the Asian opening, as in the 4 hours chart, the technical indicators hold well above their mid-lines, but with no directional strength. In the same chart, the price recovered above a now bullish 20 SMA, suggesting the rally may extend during the upcoming sessions, particularly if markets' mood remains positive. Nevertheless, seems unlikely the market will dare to push the pair beyond the 1.1460 region ahead of the ECB economic policy decision, next Thursday, with speculators expected to take profits out of the table on approaches to this last.
Support levels: 1.1335 1.1280 1.1235
Resistance levels: 1.1420 1.1460 1.1500
EUR/JPY Current price: 124.10
View Live Chart for the EUR/JPY
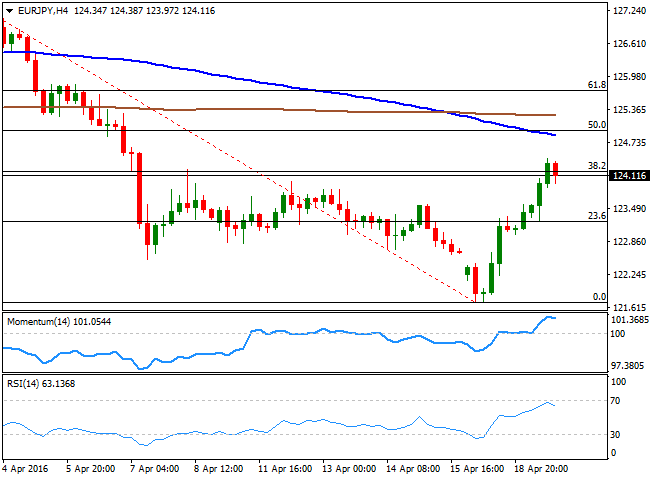
The Japanese yen's weakness has helped the EUR/JPY pair to rally to its highest in four weeks, as it reached 124.43, before poor US data helped the JPY to recover some ground, and sent the pair lower. Still holding above the 124.00 level, the pair is consolidating around the 38.2% retracement of the latest daily slump between 128.21 and 121.70, at 124.18, suggesting this latest upward corrective move can be merely corrective. Short term, the pair is headed lower, as in the 1 hour chart, the technical indicators are retreating from extreme overbought territory, although the 200 SMA converges with the 23.6% retracement of the same rally at 123.25, indicating the price needs to extend below this last to resume its bearish trend. In the 4 hours chart, the RSI indicator is retreating from near overbought levels, whilst the Momentum indicator turned lower within positive territory, as the 100 SMA extended its decline below the 200 SMA above the current level, and providing a major resistance around 124.90, in the case of further advances.
Support levels: 123.80 123.35 122.70
Resistance levels: 124.45 124.90 125.30
GBP/USD Current price: 1.4393
View Live Chart for the GBP/USD
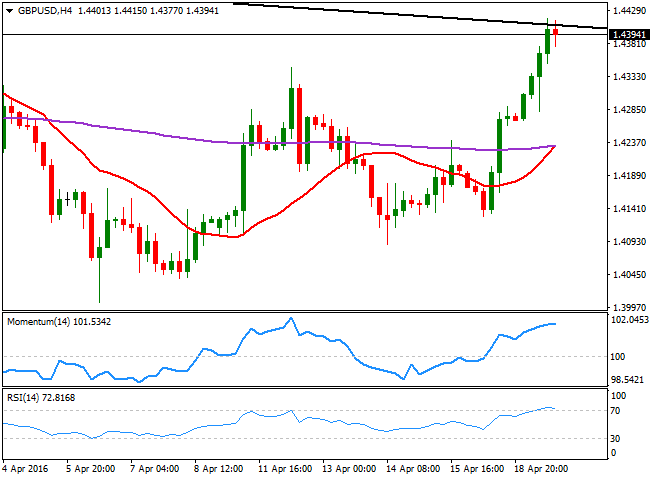
The GBP/USD pair advanced to a fresh April high of 1.4418, with the Pound buoyed ever since the day started as high yielders were back in vogue. The pair picked up pace early Europe, following the latest Brexit polls showing that those voting to remain within the EU are taking the lead, and accelerated further higher after US poor macroeconomic figures. The rally stalled at a major static resistance, a daily descendant trend line coming from February's high which stands around 1.4410, but so far, the pullback has been quite shallow, suggesting bulls are willing to break it towards the upside. Intraday technical readings are losing upward strength near overbought levels, rather reflecting the latest short term consolidative stage than suggesting that the upside is exhausted, but particularly referring to the 4 hours chart, the 20 SMA has rallied below the current level, surpassing its previous highs, and is currently aiming to cross above the 200 EMA, also anticipating the pair may rally further. If the market is able to push the pair through the trend line, the immediate target comes at 1.4458, March 30th high, whist additional gains beyond this last can take the pair up to the 1.4510 region.
Support levels: 1.4350 1.4315 1.4260
Resistance levels: 1.4410 1.4460 1.4510
USD/JPY Current price: 109.02
View Live Chart for the USD/JPY
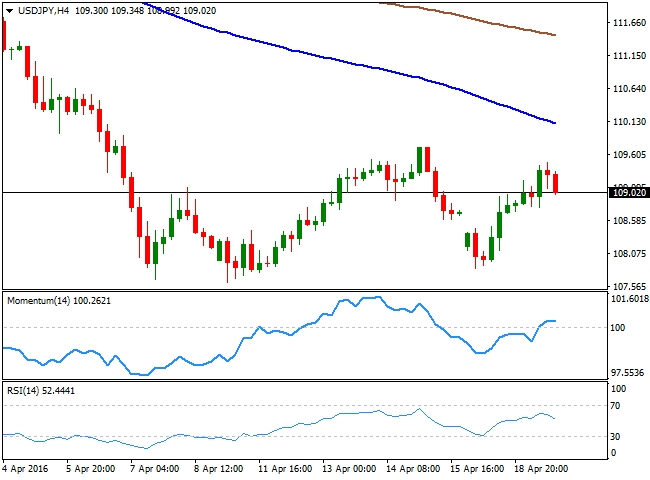
The American dollar gained against its Japanese rival this Tuesday, although the pair trimmed most of its daily gains early in the US session, weighed by tepid US housing data. The USD/JPY pair rallied up to 109.48, and the following retracement held above the 109.00 level, as aggressive selling interest has been reduced on fears that the BOJ will act sooner or later to prevent the local currency from appreciating further. The Japanese Central Bank will have its monthly meeting by the end of April, and speculators have started pricing in some form of extension of the ongoing facilities. Nevertheless, there's a long run ahead before the pair can turn long-term bullish, as it will need to advance beyond 115.00 to confirm dollar's comeback. Short term, the 1 hour chart shows that the price has bounced from a horizontal 100 SMA, whilst the technical indicators have lost directional strength around their mid-lines, following a strong correction from overbought levels and erasing the preceding bearish divergence. In the 4 hours chart, the technical indicators have turned slightly lower within positive territory, whilst the price remains well below a bearish 100 SMA, currently around 110.10, indicating that the downward risk is still present.
Support levels: 109.00 108.65 108.20
Resistance levels: 109.50 110.00 110.40
AUD/USD Current price: 0.7813
View Live Chart for the AUD/USD
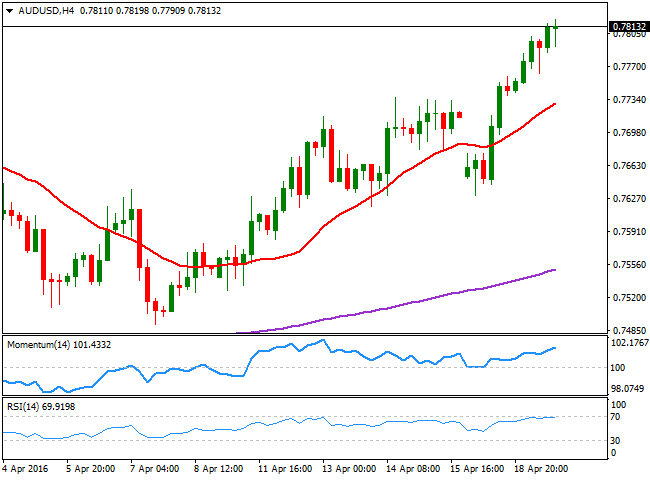
The Australian dollar extended its rally to a fresh year-high against its American rival, with the AUD/USD pair establishing above the 0.7800 level for the first time since June 2015. The release of the RBA meeting Minutes presented a twist, as the Central Bank stated that it is "appropriate for monetary policy to be very accommodative” with that "very" appearing for the first time this year, an implicit warning over current Aussie strength, as Governor Stevens has already warned that policy makers are not comfortable with the latest advance of the local currency. The technical outlook is neutral-to-bullish in the 1 hour chart, as the technical indicators have turned well above their mid-lines, although the 20 SMA maintains a strong bullish slope below the current level. In the 4 hours chart, however, the pair presents a strong upward potential, as the Momentum indicator maintains a clear upward slope near overbought territory, and the RSI indicator heads north around 70, all of which supports some further gains. Retracements towards the 0.7720 region will likely attract buying interest, without affecting the ongoing bullish trend.
Support levels: 0.7790 0.7750 0.7720
Resistance levels: 0.7820 0.7865 0.7905
Information on these pages contains forward-looking statements that involve risks and uncertainties. Markets and instruments profiled on this page are for informational purposes only and should not in any way come across as a recommendation to buy or sell in these assets. You should do your own thorough research before making any investment decisions. FXStreet does not in any way guarantee that this information is free from mistakes, errors, or material misstatements. It also does not guarantee that this information is of a timely nature. Investing in Open Markets involves a great deal of risk, including the loss of all or a portion of your investment, as well as emotional distress. All risks, losses and costs associated with investing, including total loss of principal, are your responsibility. The views and opinions expressed in this article are those of the authors and do not necessarily reflect the official policy or position of FXStreet nor its advertisers. The author will not be held responsible for information that is found at the end of links posted on this page.
If not otherwise explicitly mentioned in the body of the article, at the time of writing, the author has no position in any stock mentioned in this article and no business relationship with any company mentioned. The author has not received compensation for writing this article, other than from FXStreet.
FXStreet and the author do not provide personalized recommendations. The author makes no representations as to the accuracy, completeness, or suitability of this information. FXStreet and the author will not be liable for any errors, omissions or any losses, injuries or damages arising from this information and its display or use. Errors and omissions excepted.
The author and FXStreet are not registered investment advisors and nothing in this article is intended to be investment advice.
Recommended Content
Editors’ Picks
AUD/USD risks a deeper drop in the short term

AUD/USD rapidly left behind Wednesday’s decent advance and resumed its downward trend on the back of the intense buying pressure in the greenback, while mixed results from the domestic labour market report failed to lend support to AUD.
EUR/USD leaves the door open to a decline to 1.0600

A decent comeback in the Greenback lured sellers back into the market, motivating EUR/USD to give away the earlier advance to weekly tops around 1.0690 and shift its attention to a potential revisit of the 1.0600 neighbourhood instead.
Gold is closely monitoring geopolitics

Gold trades in positive territory above $2,380 on Thursday. Although the benchmark 10-year US Treasury bond yield holds steady following upbeat US data, XAU/USD continues to stretch higher on growing fears over a deepening conflict in the Middle East.
Bitcoin price shows strength as IMF attests to spread and intensity of BTC transactions ahead of halving

Bitcoin (BTC) price is borderline strong and weak with the brunt of the weakness being felt by altcoins. Regarding strength, it continues to close above the $60,000 threshold for seven weeks in a row.
Is the Biden administration trying to destroy the Dollar?

Confidence in Western financial markets has already been shaken enough by the 20% devaluation of the dollar over the last few years. But now the European Commission wants to hand Ukraine $300 billion seized from Russia.