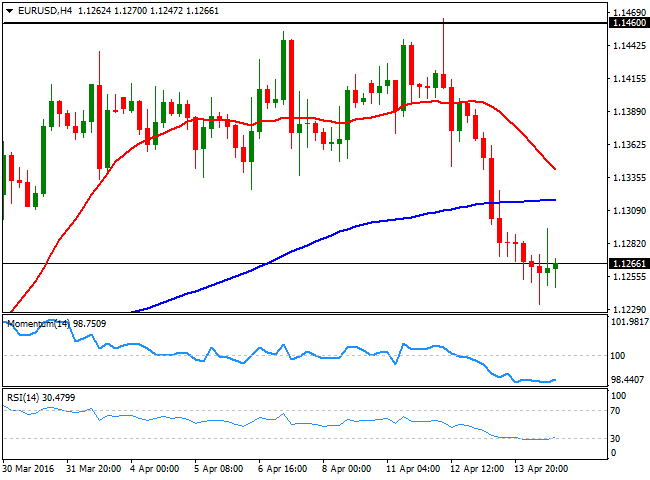
EUR/USD Current Price: 1.1266
View Live Chart for the EUR/USD
The American dollar was firmer once again, particularly against its European rivals, although the strong momentum of the currency seen on Wednesday receded. Asian share markets edged higher, but concerns over global growth returned after Singapore cut interest rates by surprise as growth stalled, leading to a poor performance in European and American indexes.
Data coming from both shores of the Atlantic failed to motive investors, as most of price developments occurred before the macroeconomic releases. In Europe, attention focused in the final EU CPI for March, with the headline figure revised a notch higher to 0.0% year-on-year, the monthly reading unchanged at 1.2%, and core inflation left unrevised at 1.0%. In the US, weekly unemployment claims fell to its lowest since 1978, printing 258K in the week ended April 8th, but inflation rose less-than-expected in March, up by 0.1% monthly basis and by 0.9% compared to a year before. Soft inflation readings will keep the FED on hold for longer, when it comes to raising rates.
The EUR/USD pair fell to a fresh 2-week low of 1.1233 early Europe, with the following bounce failing to extend beyond the 1.1300 level. The pair has been consolidating in a tight range for most of the American session, and holds around 1.1260. Technically, the 4 hours chart shows that the 20 SMA has accelerated its decline and now stands around 1.1340, whilst the technical indicators lack directional strength within oversold levels, far from supporting some additional gains for this Friday. Nevertheless, the pair needs to actually break below the 1.1200 to accelerate its decline, with scope now to extend down to 1.1120, a major static support zone.
Support levels: 1.1235 1.1200 1.1160
Resistance levels: 1.1280 1.1330 1.1380
EUR/JPY Current price: 122.96
View Live Chart for the EUR/JPY
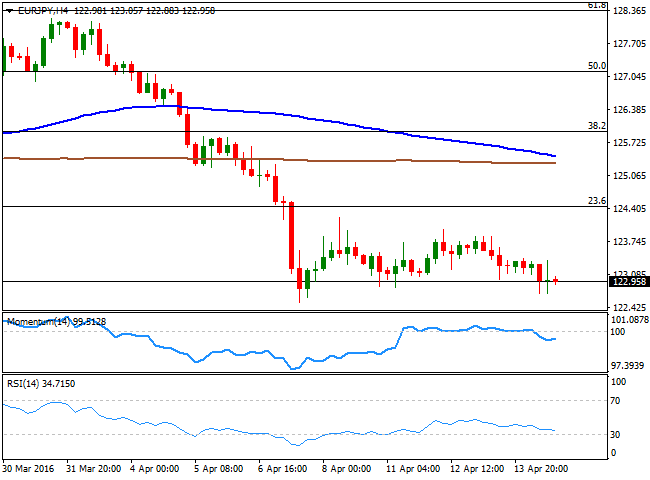
The EUR/JPY pair edged lower on Thursday, but remained confined to a limited intraday range as the EUR and the JPY moved in tandem against the greenback. The pair fell to a fresh weekly low of 122.71, a handful of pips below the previous one, and trades around 123.00 by the end of the day, with short term picture favoring additional declines, as in the 1 hour chart, the price remained contained by a horizontal 100 SMA, currently around 123.35, whilst the technical indicators remain flat below their mid-lines. In the 4 hours chart, the 100 SMA accelerated its decline above the 200 SMA, both far away from the current level in the 125.00 region, whilst the technical indicators hold below their mid-lines. Past week low of 122.50 is the key, as it will take a downward acceleration below it to confirm a continued decline to fresh lows below the 122.00 figure.
Support levels: 122.50 122.00 121.60
Resistance levels: 123.35 123.60 124.10
GBP/USD Current price: 1.4163
View Live Chart for the GBP/USD
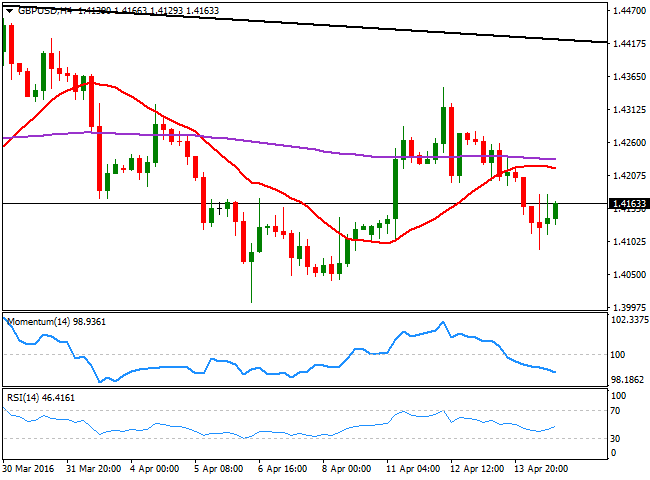
The GBP/USD pair closed in the red for a second day in-a-row, although the pair trimmed most of its daily losses ahead of the close. Nevertheless, Pound´s negative tone prevails, and the BOE did little for the local currency. The Bank of England had its monthly meeting, in where it left its monetary policy unchanged, as widely expected. The bank rate was maintained at record lows of 0.5% and the size of the Asset Purchase Facility was kept at £375bn, with all of the nine MPC members voting for this. The Minutes showed that policy makers are concerned over the Brexit referendum, as is possible that “referendum-related uncertainty would have a more pronounced effect on household sentiment and behavior as the vote drew nearer.” From a technical point of view, the intraday recovery was not enough to revert the negative tone of the pair, given that in the 4 hours chart, the price remains well below its 20 SMA and 200 EMA, while the Momentum indicator keeps heading lower within negative territory. In the same chart, the RSI indicator has partially recovered, but remains around 46. The pair can gather some additional upward momentum if the recovery extends beyond 1.4240, while a decline below 1.4090 exposes the pair to test the 1.4000 critical figure.
Support levels: 1.4130 1.4090 1.4050
Resistance levels: 1..4185 1.4240 1.4285
USD/JPY Current price: 109.17
View Live Chart for the USD/JPY
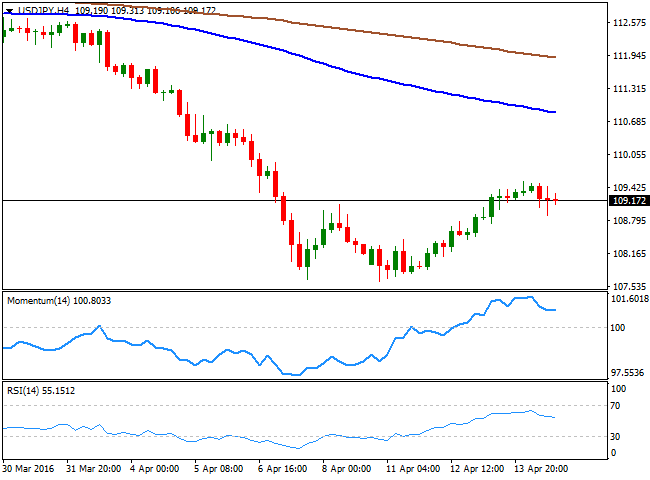
The USD/JPY pair traded uneventfully this Thursday, briefly falling below the 109.00 level in the American afternoon, but it bounced back to the current 109.20 region, where it stood for most of the day. Poor US inflation data was behind that short-lived slide, but given the lack of reaction in stocks markets, the pair was unable to catch a firmer directional tone. The weekly recovery extended up to 109.54 during the past Asian session, as the JPY traded inversely to local share market, and the Nikkei was the largest daily winner among worldwide indexes. Anyway, and technically speaking the long term outlook for the pair is still bearish, as it will take at least a recovery above the 110.60 region to confirm an interim bottom took place in the 107.60 lows posted this month. Short term, the 1 hour chart presents a neutral tone, as the technical indicators head higher right below their mid-lines, but the price remains stuck around a bearish 200 SMA. In the 4 hours chart, the technical indicators head higher within positive territory and after correcting overbought readings. Still, the 100 and 200 SMA head lower far above the current level, indicating advances will continue to be corrective.
Support levels: 108.90 108.40 107.95
Resistance levels: 109.50 110.00 110.45
AUD/USD Current price: 0.7710
View Live Chart for the AUD/USD
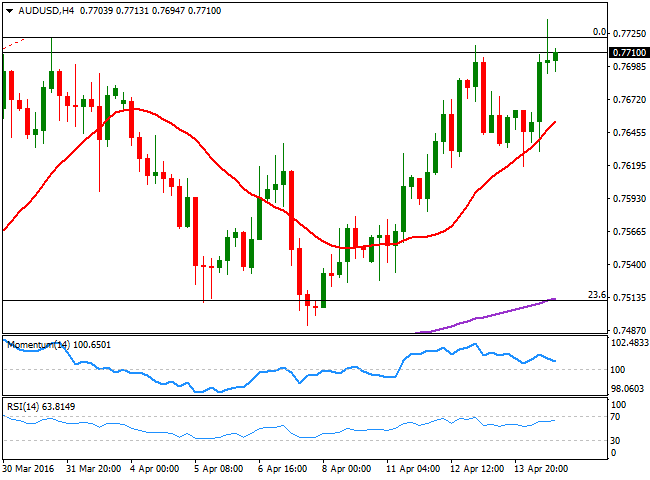
The AUD/USD pair rallied to a fresh year high of 0.7736 during the American session, following the release of tepid US inflation figures. The Aussie was underpinned at the beginning of the day, after Australian employment data for March, beat expectations. According to official data, the economy created 26,100 new jobs during the month, while the unemployment rate fell to 5.7%, the lowest since September 2013. The pair retreated quickly from the level, but met buying interest around 0.7690, now the immediate short term support. In the 1 hour chart, the technical indicators are retreating from overbought territory, whilst the 20 SMA heads sharply higher well below the current level, suggesting the pair may retreat in a short-lived corrective move, but that the risk remains towards the upside. In the 4 hours chart, the technical picture is quite alike, with the 20 SMA heading north around 0.7650 and the indicators retreating within positive territory, but nowhere near to suggest a continued decline for this Friday.
Support levels: 0.7690 0.7650 0.7610
Resistance levels: 0.7735 0.7760 0.7800
Information on these pages contains forward-looking statements that involve risks and uncertainties. Markets and instruments profiled on this page are for informational purposes only and should not in any way come across as a recommendation to buy or sell in these assets. You should do your own thorough research before making any investment decisions. FXStreet does not in any way guarantee that this information is free from mistakes, errors, or material misstatements. It also does not guarantee that this information is of a timely nature. Investing in Open Markets involves a great deal of risk, including the loss of all or a portion of your investment, as well as emotional distress. All risks, losses and costs associated with investing, including total loss of principal, are your responsibility. The views and opinions expressed in this article are those of the authors and do not necessarily reflect the official policy or position of FXStreet nor its advertisers. The author will not be held responsible for information that is found at the end of links posted on this page.
If not otherwise explicitly mentioned in the body of the article, at the time of writing, the author has no position in any stock mentioned in this article and no business relationship with any company mentioned. The author has not received compensation for writing this article, other than from FXStreet.
FXStreet and the author do not provide personalized recommendations. The author makes no representations as to the accuracy, completeness, or suitability of this information. FXStreet and the author will not be liable for any errors, omissions or any losses, injuries or damages arising from this information and its display or use. Errors and omissions excepted.
The author and FXStreet are not registered investment advisors and nothing in this article is intended to be investment advice.
Recommended Content
Editors’ Picks
EUR/USD clings to daily gains above 1.0650

EUR/USD gained traction and turned positive on the day above 1.0650. The improvement seen in risk mood following the earlier flight to safety weighs on the US Dollar ahead of the weekend and helps the pair push higher.
GBP/USD recovers toward 1.2450 after UK Retail Sales data

GBP/USD reversed its direction and advanced to the 1.2450 area after touching a fresh multi-month low below 1.2400 in the Asian session. The positive shift seen in risk mood on easing fears over a deepening Iran-Israel conflict supports the pair.
Gold holds steady at around $2,380 following earlier spike

Gold stabilized near $2,380 after spiking above $2,400 with the immediate reaction to reports of Israel striking Iran. Meanwhile, the pullback seen in the US Treasury bond yields helps XAU/USD hold its ground.
Bitcoin Weekly Forecast: BTC post-halving rally could be partially priced in Premium

Bitcoin price shows no signs of directional bias while it holds above $60,000. The fourth BTC halving is partially priced in, according to Deutsche Bank’s research.
Week ahead – US GDP and BoJ decision on top of next week’s agenda

US GDP, core PCE and PMIs the next tests for the Dollar. Investors await BoJ for guidance about next rate hike. EU and UK PMIs, as well as Australian CPIs also on tap.