EUR/USD Current Price: 1.1405
View Live Chart for the EUR/USD
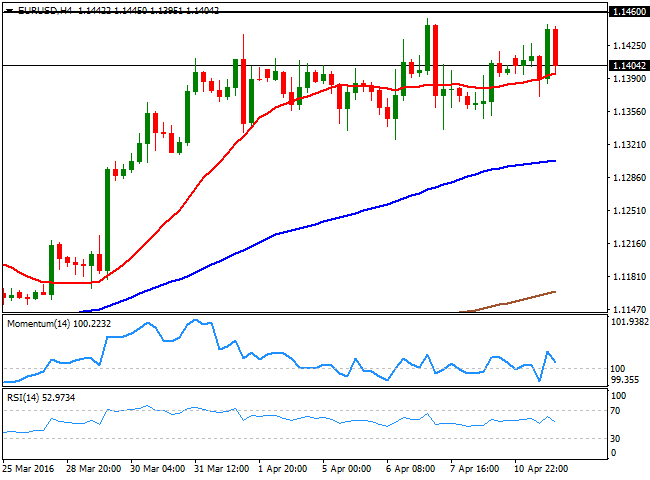
The EUR/USD pair held within its latest range in a lackluster start to the week, due to the absence of European and American macroeconomic data, which left traders clueless all through the day. During the Asian session, risk aversion led the way, favoring the most the JPY, as Chinese March inflation fell by 0.4%, while recording a softer-than-expected 2.3% compared to a year before. The Producer Price index, however, offered an upward surprise, as it fell less than expected, printing -4.3% year-on-year against previous 4.9%. But sentiment turned positive during the European morning, as local share markets opened with a strong footing to finally close in the green.
The common currency advanced up to 1.1447 against its American rival, but the pair was again rejected by selling interest around the 1.1460 region, a strong static resistance area. The short term picture is neutral, as the pair has been stuck between 1.1330 and 1.1460 for over a week now, but the longer term perspective still favors the upside. In the 4 hours chart, the pair is slightly above a horizontal 20 SMA, whilst the technical indicators have lost upward strength after entering positive territory, with no actual directional strength. Stop beyond the mentioned 1.1460 critical resistance are suspected to be large, which means that if they got triggered, the pair can rally up to 1.1500 beyond.
Support levels: 1.1370 1.1330 1.1280
Resistance levels: 1.1420 1.1460 1.1500
EUR/JPY Current price: 123.18
View Live Chart for the EUR/JPY
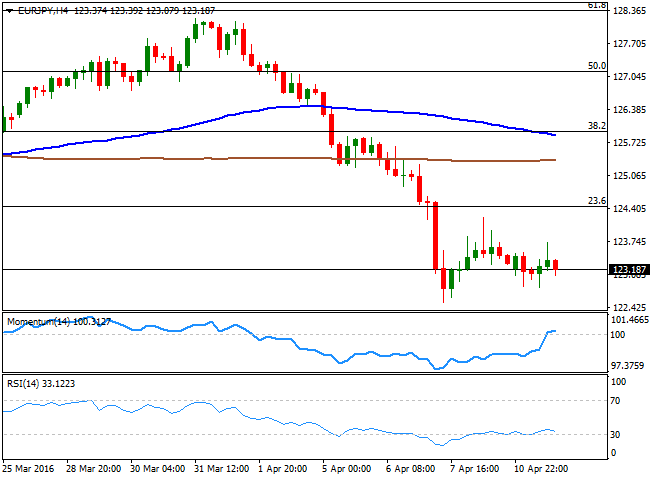
The EUR/JPY pair ends the day around Friday's close, a handful of pips above the 123.00 level. The Japanese yen was buoyed during the Asian session, but the decline in the pair was limited to 122.82, as the EUR is lately responding as a safe-haven currency when risk aversion takes over the financial world. The 1 hour chart presents a neutral-to-bearish stance ahead of the Asian opening, as the technical indicators have turned slightly lower around their mid-lines, whilst the 100 SMA has accelerated its decline above the current level, now offering a strong dynamic resistance around 124.10. In the 4 hours chart, the RSI indicator has corrected oversold readings, but remains weak around 33, while the Momentum indicator lost its upward strength around its 100 level. Overall, the risk remains towards the downside, with a break below 122.50, Friday's low, required to confirm additional declines towards fresh year lows below the 122.00 level.
Support levels: 123.00 122.50 122.00
Resistance levels: 123.65 124.10 124.45
GBP/USD Current price: 1.4239
View Live Chart for the GBP/USD
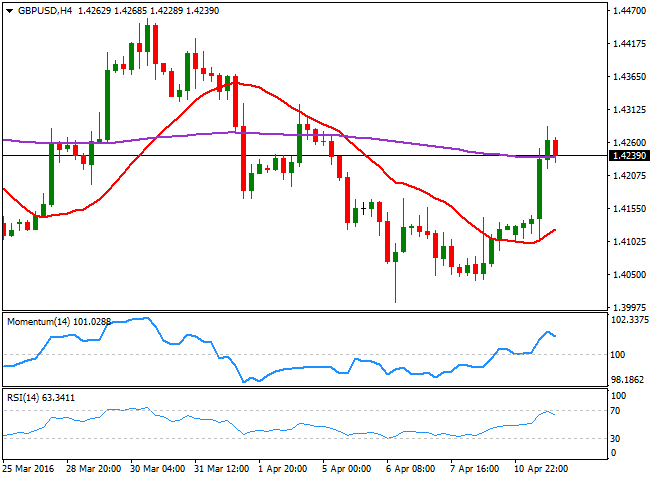
The British Pound enjoyed of some strong demand after London's opening, tracking local share markets' positive opening, and the GBP/USD pair advanced up to 1.4285, erasing all of the previous week losses. The UK will release its CPI and PPI figures early Tuesday, generally expected to have improved in March, compared to the previous month. An uptick in inflation indeed can help the pair to recover further, as Pound's latest decline, blamed on Brexit fears, seems to be overstretched, considering the dollar's underlying negative tone. The pair retreated partially from the mentioned high, overbought in the short term after adding around 180 pips daily basis. The technical picture however, keeps favoring the upside, as in the 1 hour chart, the technical indicators are resuming their advances well into positive territory and after correcting extreme readings. In the 4 hours chart, the price is currently above a horizontal 20 SMA, while the 20 SMA is gaining bullish strength in the 1.4120 region, not enough to suggest a stepper recovery. In the same chart, the technical indicators have turned south within positive territory, but hold far above their mid-lines, suggesting the pair may enter a consolidative phase, and even retreat some, before attempting a new upward move.
Support levels: 1.4190 1.4150 1.4100
Resistance levels: 1.4285 1.4330 1.4370
USD/JPY Current price: 107.97
View Live Chart for the USD/JPY
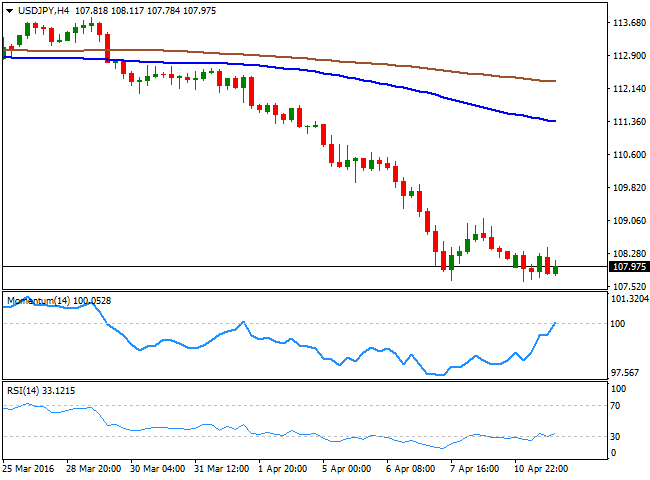
The Japanese yen extended its advance to a fresh multi-month high against its American rival, with the USD/JPY bouncing from 107.62, after BOJ's Governor Kuroda said that the Central Bank is monitoring exchange levels, and that they will add further stimulus without hesitation if needed. The intraday recovery in the pair reached 108.43 in the American afternoon, but it retreated back below the 108.00 figure, where it stands ahead of the Asian opening. Overall, the downside remains favored, both short and long term, given broad dollar's weakness and limited expectations of a US rate hike. In the 1 hour chart, the technical indicators have corrected oversold readings whilst the price remained range bound, a clear sign that bears are still in the driver's seat. In the same chart, the 100 SMA heads sharply lower around 109.00, offering a strong dynamic resistance in the case of a sudden recovery. In the 4 hours chart, the Momentum indicator presents a strong upward slope around its 100 level, whilst the RSI indicator keeps hovering around 32, but only an extension beyond the mentioned 109.00 region will offer a more upward constructive outlook for the pair.
Support levels: 107.65 107.30 106.90
Resistance levels: 108.45 109.90 109.35
AUD/USD Current price: 0.7608
View Live Chart for the AUD/USD
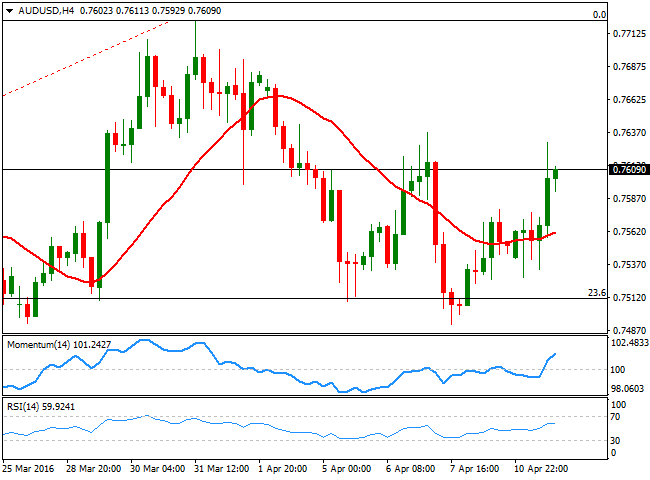
Slowly but steadily, the AUD/USD ground higher this Monday, underpinned by the positive tone in European and American equities, and further recoveries in oil's prices. Australia will release its March NAB Business confidence and current conditions indexes during the upcoming Asian session, while more data will be out from China, all of which can give the pair a lift on positive surprises. The pair is up for second day in-a-row, after testing once again the 0.7500 region late last week the 23.6% retracement of this year bullish run. Still at risk of correcting lower, given the inability of the pair to advance beyond the 0.7700 level, the pair presents a mild positive tone in the short term, as in the 1 hour chart, the price is well above a bullish 20 SA, whilst the technical indicators have lost their upward strength, and consolidate within positive territory. In the 4 hours chart, the 20 SMA offers an intraday support around 0.7560, while the technical indicators are losing upward steam and turning slightly lower within positive territory. At this point the pair needs to settle at least above 0.7640, to be able to advance further this Tuesday, back towards its year highs in the 0.7700 region.
Support levels: 0.7560 0.7520 0.7470
Resistance levels: 0.7640 9.7690 0.7735
Information on these pages contains forward-looking statements that involve risks and uncertainties. Markets and instruments profiled on this page are for informational purposes only and should not in any way come across as a recommendation to buy or sell in these assets. You should do your own thorough research before making any investment decisions. FXStreet does not in any way guarantee that this information is free from mistakes, errors, or material misstatements. It also does not guarantee that this information is of a timely nature. Investing in Open Markets involves a great deal of risk, including the loss of all or a portion of your investment, as well as emotional distress. All risks, losses and costs associated with investing, including total loss of principal, are your responsibility. The views and opinions expressed in this article are those of the authors and do not necessarily reflect the official policy or position of FXStreet nor its advertisers. The author will not be held responsible for information that is found at the end of links posted on this page.
If not otherwise explicitly mentioned in the body of the article, at the time of writing, the author has no position in any stock mentioned in this article and no business relationship with any company mentioned. The author has not received compensation for writing this article, other than from FXStreet.
FXStreet and the author do not provide personalized recommendations. The author makes no representations as to the accuracy, completeness, or suitability of this information. FXStreet and the author will not be liable for any errors, omissions or any losses, injuries or damages arising from this information and its display or use. Errors and omissions excepted.
The author and FXStreet are not registered investment advisors and nothing in this article is intended to be investment advice.
Recommended Content
Editors’ Picks
EUR/USD clings to daily gains above 1.0650

EUR/USD gained traction and turned positive on the day above 1.0650. The improvement seen in risk mood following the earlier flight to safety weighs on the US Dollar ahead of the weekend and helps the pair push higher.
GBP/USD recovers toward 1.2450 after UK Retail Sales data

GBP/USD reversed its direction and advanced to the 1.2450 area after touching a fresh multi-month low below 1.2400 in the Asian session. The positive shift seen in risk mood on easing fears over a deepening Iran-Israel conflict supports the pair.
Gold holds steady at around $2,380 following earlier spike

Gold stabilized near $2,380 after spiking above $2,400 with the immediate reaction to reports of Israel striking Iran. Meanwhile, the pullback seen in the US Treasury bond yields helps XAU/USD hold its ground.
Bitcoin Weekly Forecast: BTC post-halving rally could be partially priced in Premium

Bitcoin price shows no signs of directional bias while it holds above $60,000. The fourth BTC halving is partially priced in, according to Deutsche Bank’s research.
Week ahead – US GDP and BoJ decision on top of next week’s agenda

US GDP, core PCE and PMIs the next tests for the Dollar. Investors await BoJ for guidance about next rate hike. EU and UK PMIs, as well as Australian CPIs also on tap.