EUR/USD Current Price: 1.1335
View Live Chart for the EUR/USD
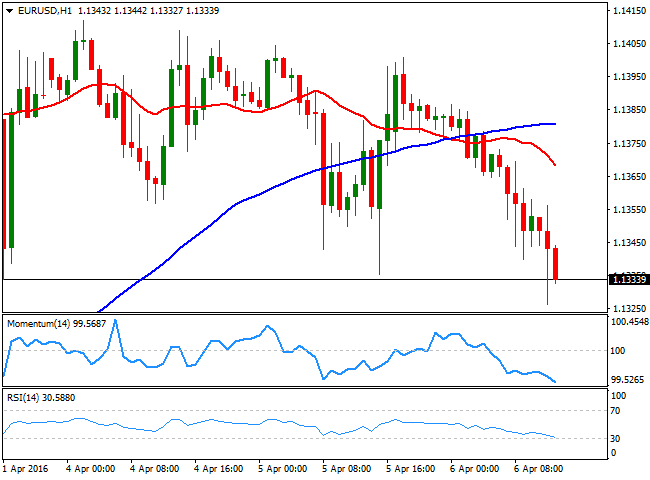
The dollar advances ahead of the US opening, helped by a tepid bounce in stocks and a firmer tone in oil's prices, as the commodity bounced and US futures trade near $37.00 a barrel. Data coming from the EU showed that German Industrial Production improved in February, but the poor factory orders published last Tuesday neutralized the positive news. During the upcoming hours, the US will release its latest crude oil stockpiles data, whilst later on will publish the Minutes of the latest FOMC meeting. The common currency is still reluctant to give up against its American rival, as the pair quotes around Friday's low, having been as low as 1.1326 so far today. In the 1 hour chart, the EUR/USD pair is biased lower, as the technical indicators head sharply lower within bearish territory, whilst the 20 SMA has turned lower above the current level. In the 4 hours chart, the downward momentum is limited, as the indicator has turned north below its 100 level, while the 20 SMA maintains its neutral stance around 1.1380. Renewed selling pressure below the daily low, should lead to a continued decline during the upcoming hours, particularly if markets gives a positive interpretation of the FED's minutes.
Support levels: 1.1330 1.1280 1.1245
Resistance levels: 1.1410 1.1460 1.1500
GBP/USD Current price: 1.4033
View Live Chart for the GBP/USD
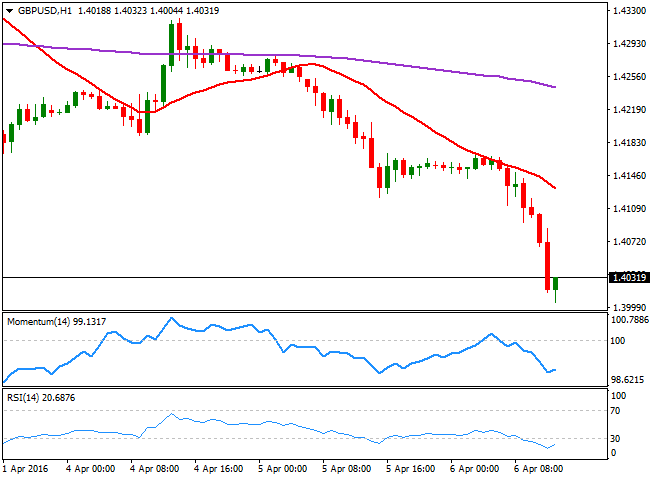
The GBP/USD pair plummeted to 1.4004, as the Pound remains as the weakest dollar's rival. There were no macroeconomic releases in the UK, and won't be any relevant reading coming out until Friday, with industrial and manufacturing figures for March. From a technical point of view, the pair may see some upward corrective movement in the short term, as in the 1 hour chart, the technical indicators are bouncing from extreme oversold levels, but still far from suggesting an upward continuation. In the same chart, the 20 SMA has extended further its decline, and stands now in the 1.4130 region, providing a strong dynamic resistance in the case of a recovery. In the 4 hours chart, the technical picture favors the downside, given that the technical indicator keep heading lower below their mid-lines, whilst the 20 SMA has accelerated its decline below the 200 EMA.
Support levels: 1.4000 1.3965 1.3930
Resistance levels: 1.4050 1.4090 1.4130
USD/JPY Current price: 110.39
View Live Chart for the USD/JPY
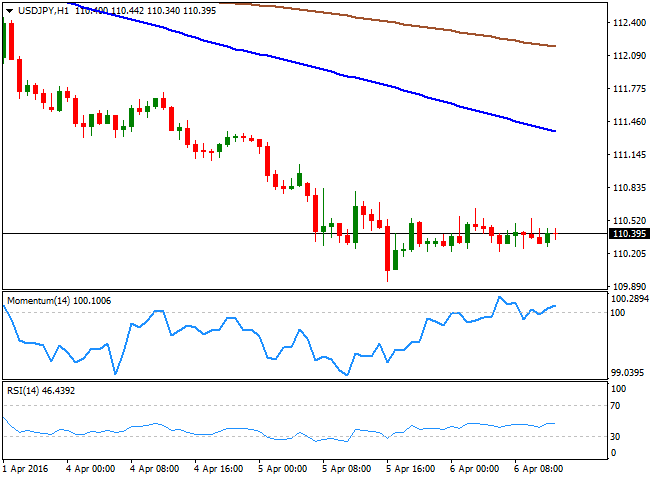
Looking for levels below 110.00. The USD/JPY pair trades uneventfully near its recent lows, having met some short term selling interest on attempts to advance beyond the 110.60 level, the immediate resistance. The Nikkei closed pretty much flat, down by 17 points, stabilizing after nose-diving for two days in-a-row. Technically, the risk remains towards the downside, as the line in the sand to confirm a long-term u-turn stands at 115.00. Short term, the 1 hour chart present a neutral-to-bearish stance, as the technical indicators hover around their mid-lines, whilst the 100 SMA has extended its decline above the current level, standing now at 111.20. In the 4 hours chart, the RSI indicator consolidates around 30, while the Momentum indicator has recovered some ground and heads north within negative territory, whilst the price remains far below its moving averages, all of which supports some further declines. The FED's Minutes will decide the tone, ad it somehow today's stance is more dovish than-expected, the pair may well approach to 109.00 ahead of the next Asian opening.
Support levels: 109.90 109.50 109.10
Resistance levels: 110.60 111.20 111.60
AUD/USD Current price: 0.7544
View Live Chart for the AUD/USD
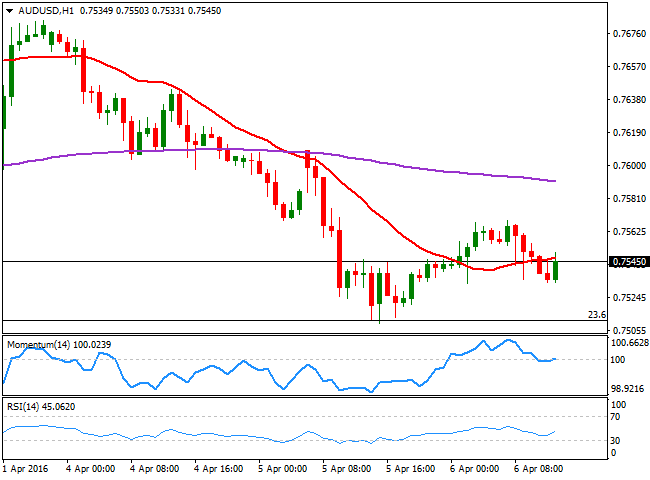
The Australian dollar has managed to hold above the 0.7500 level against its American rival, but retains the weak tone seen over the last few days. The AUD/USD pair rallied up to 0.7568, boosted by positive Chinese data, but retreated afterwards, suggesting that buying interest continues to diminish. From a technical point of view, however, the 1 hour chart shows that the technical indicators lack directional strength around their mid-lines, whilst the price is a handful of pips below its 20 SMA. In the 4 hours chart, however, the price is well below a bearish 20 SMA, whilst the technical indicators have managed to bounce some from oversold readings, but are far from supporting additional gains, maintaining the risk towards the downside. Should the price extend below 0.7500, the pair can extend its downward corrective movement towards 0.7425 this Wednesday, en route to 0.7380, the 38.2% retracement of this year's rally.
Support levels: 0.7500 0.7460 0.7425
Resistance levels: 0.7540 0.7575 0.7620
Information on these pages contains forward-looking statements that involve risks and uncertainties. Markets and instruments profiled on this page are for informational purposes only and should not in any way come across as a recommendation to buy or sell in these assets. You should do your own thorough research before making any investment decisions. FXStreet does not in any way guarantee that this information is free from mistakes, errors, or material misstatements. It also does not guarantee that this information is of a timely nature. Investing in Open Markets involves a great deal of risk, including the loss of all or a portion of your investment, as well as emotional distress. All risks, losses and costs associated with investing, including total loss of principal, are your responsibility. The views and opinions expressed in this article are those of the authors and do not necessarily reflect the official policy or position of FXStreet nor its advertisers. The author will not be held responsible for information that is found at the end of links posted on this page.
If not otherwise explicitly mentioned in the body of the article, at the time of writing, the author has no position in any stock mentioned in this article and no business relationship with any company mentioned. The author has not received compensation for writing this article, other than from FXStreet.
FXStreet and the author do not provide personalized recommendations. The author makes no representations as to the accuracy, completeness, or suitability of this information. FXStreet and the author will not be liable for any errors, omissions or any losses, injuries or damages arising from this information and its display or use. Errors and omissions excepted.
The author and FXStreet are not registered investment advisors and nothing in this article is intended to be investment advice.
Recommended Content
Editors’ Picks
EUR/USD fluctuates near 1.0700 after US data

EUR/USD stays in a consolidation phase at around 1.0700 in the American session on Wednesday. The data from the US showed a strong increase in Durable Goods Orders, supporting the USD and making it difficult for the pair to gain traction.
USD/JPY refreshes 34-year high, attacks 155.00 as intervention risks loom

USD/JPY is renewing a multi-decade high, closing in on 155.00. Traders turn cautious on heightened risks of Japan's FX intervention. Broad US Dollar rebound aids the upside in the major. US Durable Goods data are next on tap.
Gold keeps consolidating ahead of US first-tier figures

Gold finds it difficult to stage a rebound midweek following Monday's sharp decline but manages to hold above $2,300. The benchmark 10-year US Treasury bond yield stays in the green above 4.6% after US data, not allowing the pair to turn north.
Worldcoin looks set for comeback despite Nvidia’s 22% crash Premium

Worldcoin price is in a better position than last week's and shows signs of a potential comeback. This development occurs amid the sharp decline in the valuation of the popular GPU manufacturer Nvidia.
Three fundamentals for the week: US GDP, BoJ and the Fed's favorite inflation gauge stand out Premium

While it is hard to predict when geopolitical news erupts, the level of tension is lower – allowing for key data to have its say. This week's US figures are set to shape the Federal Reserve's decision next week – and the Bank of Japan may struggle to halt the Yen's deterioration.